Technical Foam Market by Form (Flexible, Rigid, Spray), Material (Elastomeric, PU, PE, Expanded Foam), End Use (Electricals & Electronics, Automotive & Transportation, Commercial Buildings, Office Equipment, Medical), and Region - Global Forecast to 2025


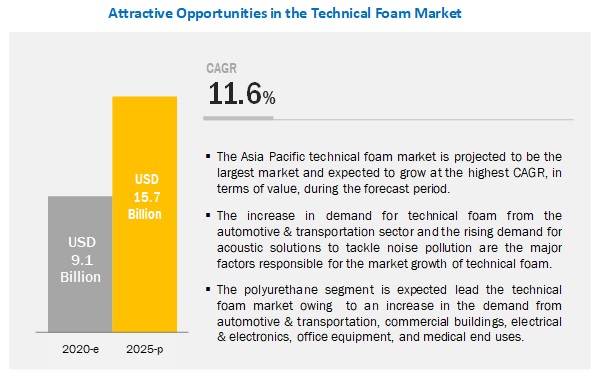
The technical foam market is projected to reach USD 15.7 billion by 2025, at a CAGR of 11.6%. The increase in demand for technical foam from the automotive & transportation sector and the rising demand for acoustic solutions to tackle noise pollution are the major factors responsible for the market growth of technical foam.
The flexible foam segment is projected to be the largest segment during the forecast period in terms of volume
Based on form, the flexible foam segment accounted for the largest share in 2019. Flexible technical foams are suitable for manufacturing automotive seat cushioning, office equipment, and furniture for comfort and support. Due to their shock absorbing capacity, they are suitable for use in the packaging of electrical devices and medical wipes & swabs. Apart from these properties, flexible foams are less expensive compared to rigid and spray foam, which drives the growth of this segment.
By material, polyurethane is expected to be the largest segment of the technical foam market during the forecast period
By material, the polyurethane segment accounted for the largest share of the technical foam market in 2019. This large share is attributed mainly to its properties, such as low weight, heat preservation, sound absorption, and excellent cushioning. Technical PU foams are mainly used in the automotive & transportation and commercial buildings segments. These foams are more widely used compared to other materials owing to their low heat conduction coefficient, low density, low water absorption, relatively good mechanical strength, and insulating properties.
Automotive & transportation is projected to be the largest end use of the technical foam market during the forecast period
Technical foam is preferred due to its low weight and durability for high-temperature insulation solutions. These foams also offer resistance to heat & fire, and noise dampening for boats & ships. Technical foam provides comfort, acoustic, and fire insulation. Thus, increasing demand for better vehicle operational and environmental efficiency, temperature control, superior dielectric insulation qualities, and thermal conductivity of various materials make technical foam suited for a broad range of specialist automotive applications. These are the prime factors responsible for the growth of the automotive & transportation end use of technical foam.
Asia Pacific projected to grow at highest CAGR during the forecast period
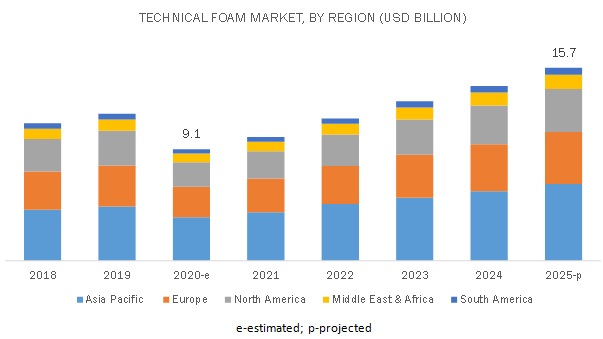
Asia Pacific accounted for the largest share of the global technical foam market in 2019, followed by Europe and North America. China is one of the major consumers of technical foam in the Asia Pacific region. The market in Asia Pacific is witnessing growth owing to the industrial development in the region and its improving economic conditions. Moreover, several foreign players are adopting inorganic growth strategies to establish their presence in the region, which is expected to trigger the Asia Pacific technical foam market.
Key Players in Technical Foam Market
BASF SE (Germany), Dow Inc. (US), SEKISUI CHEMICAL CO., LTD (Japan), Huntsman Corporation (US), Armacell International S.A. (Germany), LANXESS AG (Germany), Trelleborg AB (Sweden), Recticel NV/SA (Belgium), INOAC Corporation (Japan), UFP Technologies, Inc., (US) Wanhua Chemical Group Co., Ltd. (China), and The Woodbridge Group (US) are some of the major players in the global technical foam market.
These players have been focusing on strategies such as new product development/launches, expansions, acquisitions, agreements, joint ventures, collaborations, and partnerships, which help them expand their businesses in untapped and potential markets.
Technical Foam Market Report Scope
|
Report Metric |
Details |
|
Market Size Value in 2020 |
USD 9.1 billion |
|
Revenue Forecast in 2025 |
USD 15.7 billion |
|
CAGR |
11.6% |
|
Market size available for years |
2018–2025 |
|
Base year considered |
2019 |
|
Forecast period |
2020–2025 |
|
Forecast units |
Volume (Tons) and Value (USD) |
|
Segments covered |
Form, Material, End Use, and Region |
|
Regions covered |
North America, Europe, Asia Pacific, South America, and Middle East & Africa |
|
Companies covered |
BASF SE (Germany), Dow Inc. (US), SEKISUI CHEMICAL CO., LTD (Japan), Huntsman Corporation (US), Armacell International S.A. (Germany), LANXESS AG (Germany), Trelleborg AB (Sweden), Recticel NV/SA (Belgium), INOAC Corporation (Japan), and UFP Technologies, Inc. (US) and others |
Based on form:
- Flexible
- Rigid
- Spray
Based on material:
- Elastomeric
- Polyurethane
- Polyethylene
- Expanded Foam
- Others [EVA (Ethylene-Vinyl Acetate), Melamine Foam and Phenolic Foam]
Based on end use:
- Electricals & Electronics
- Automotive & Transportation
- Commercial Buildings
- Office Equipment
- Medical
- Others (cleaning & personal hygiene products, apparel, and industrial equipment)
Based on region:
- Asia Pacific
- Europe
- North America
- Middle East & Africa
- South America
Recent Developments in Technical Foam Market
- In February 2020, Huntsman Corporation acquired Icynene-Lapolla, a leading North American manufacturer and distributor of spray polyurethane foam (SPF) insulation systems for residential and commercial applications. Huntsman acquired the business from an affiliate of FFL Partners, LLC, for USD 350 million. The acquisition of Icynene-Lapolla is aligned with Huntsman’s strategy of growing its downstream polyurethanes business.
- In December 2019, BASF SE expanded its range of melamine resin foam, Basotect, by developing and improving emission properties in the new grade Basotect UF+. It is suitable for the insulation of rail vehicles and for heating, ventilation, and air conditioning (HVAC) in buildings.
- In October 2018, Recticel NV/SA set up its first foam converting plant in Tangier, Morocco, with an investment of USD 1.2 million. The new Tangier plant specializes in manufacturing specific technical foams for the automotive market, which strengthens the company’s position in the automotive sector in the Middle East & Africa region.
- In April 2019, Armacell International S.A. and Thermaflex (Netherlands), a manufacturer of high-end PE and pre-insulated piping solutions, entered into a commercial co-operation agreement wherein Thermaflex will operate as the exclusive distributor for Armacell in the Russian Federation and some CIS countries.
- In February 2018, UFP Technologies, Inc. acquired Dielectrics, Inc. (US), a leader in the design, development, and manufacturing of medical devices using thermoplastic materials. With this acquisition, the company has increased its customer base and been able to manufacture foam material for the packaging of medical devices manufactured by Dielectrics.
Key Questions Addressed by the Report
- What are the future revenue pockets in the technical foam market?
- Which key developments are expected to have a long-term impact on the technical foam industry?
- Which materials are expected to cannibalize existing markets?
- How is the current regulatory framework expected to impact the market?
- What will be the future product mix of the technical foam industry?
- What are the prime strategies of leaders in the technical foam market?
To speak to our analyst for a discussion on the above findings, click Speak to Analyst
 Exclusive indicates content/data unique to MarketsandMarkets and not available with any competitors.
TABLE OF CONTENTS
1 INTRODUCTION (Page No. - 19)
1.1 OBJECTIVES OF THE STUDY
1.2 MARKET DEFINITION
1.3 MARKET SCOPE
1.3.1 MARKET SEGMENTATION
1.3.2 YEARS CONSIDERED FOR THE STUDY
1.4 CURRENCY
1.5 UNITS
1.6 STAKEHOLDERS
2 RESEARCH METHODOLOGY (Page No. - 22)
2.1 MARKET DEFINITION AND SCOPE
2.2 BASE NUMBER CALCULATION
2.3 FORECAST NUMBER CALCULATION
2.4 MARKET ENGINEERING PROCESS
2.4.1 TOP-DOWN APPROACH
2.4.2 BOTTOM-UP APPROACH
2.5 MARKET BREAKDOWN AND DATA TRIANGULATION
2.6 ASSUMPTIONS
2.7 RESEARCH DATA
2.7.1 SECONDARY DATA
2.7.1.1 Key data from secondary sources
2.7.2 PRIMARY DATA
2.7.2.1 Key data from primary sources
2.7.2.2 Breakdown of primary interviews
2.7.2.3 Key industry insights
3 EXECUTIVE SUMMARY (Page No. - 29)
4 PREMIUM INSIGHTS (Page No. - 31)
4.1 ATTRACTIVE OPPORTUNITIES IN THE TECHNICAL FOAM MARKET
4.2 TECHNICAL FOAM MARKET, BY MATERIAL
4.3 TECHNICAL FOAM MARKET, BY FORM
4.4 TECHNICAL FOAM MARKET, BY END USE AND REGION
5 MARKET OVERVIEW (Page No. - 33)
5.1 INTRODUCTION
5.2 MARKET DYNAMICS
5.2.1 DRIVERS
5.2.1.1 Increasing demand from automotive & transportation sector
5.2.1.2 Rising demand for acoustic solutions to tackle noise pollution
5.2.2 RESTRAINTS
5.2.2.1 Fluctuations in availability and prices of raw material
5.2.3 OPPORTUNITIES
5.2.3.1 Production of bio-based polyols
5.2.4 CHALLENGES
5.2.4.1 High capital cost and lack of skilled labor
5.2.4.2 Health risks associated with the use of spray foam
5.3 PORTER’S FIVE FORCES ANALYSIS
5.3.1 THREAT OF SUBSTITUTES
5.3.2 BARGAINING POWER OF BUYERS
5.3.3 THREAT OF NEW ENTRANTS
5.3.4 BARGAINING POWER OF SUPPLIERS
5.3.5 INTENSITY OF COMPETITIVE RIVALRY
5.4 CORONA VIRUS (COVID-19) IMPACT ASSESSMENT
5.4.1 DISRUPTION IN END-USE SECTORS
5.4.2 IMPACT OF COVID-19 ON AUTOMOTIVE & TRANSPORT
5.4.3 IMPACT OF COVID-19 ON COMMERCIAL BUILDINGS
5.4.4 IMPACT OF COVID-19 ON ELECTRICALS & ELECTRONICS
5.4.5 IMPACT OF COVID-19 ON MEDICAL END USE
6 TECHNICAL FOAM MARKET, BY FORM (Page No. - 40)
6.1 INTRODUCTION
6.2 FLEXIBLE FOAM
6.2.1 SOFTNESS AND MOISTURE RESISTANCE PROPERTIES EXPECTED TO DRIVE THE MARKET FOR FLEXIBLE FOAM
6.3 RIGID FOAM
6.3.1 ABILITY TO WITHSTAND PRESSURE FUELS THE MARKET FOR RIGID FOAM
6.4 SPRAY FOAM
6.4.1 BETTER INSULATION PROPERTIES THAN OTHER FOAMS EXPECTED TO DRIVE THE MARKET FOR SPRAY FOAMS
7 TECHNICAL FOAM MARKET, BY MATERIAL (Page No. - 45)
7.1 INTRODUCTION
7.2 POLYURETHANE (PU)
7.2.1 INCREASING DEMAND FROM AUTOMOTIVE & TRANSPORTATION SEGMENT EXPECTED TO DRIVE THE POLYURETHANE SEGMENT
7.3 ELASTOMERIC
7.3.1 MOISTURE RESISTANCE PROPERTIES PROJECTED TO FUEL THE MARKET FOR ELASTOMERIC FOAM
7.4 POLYETHYLENE
7.4.1 SOUND-ABSORBING AND DAMPENING PROPERTIES EXPECTED TO TRIGGER THE POLYETHYLENE MARKET
7.5 EXPANDED FOAM
7.5.1 INCREASING USE IN FOOD PACKAGING APPLICATIONS TO DRIVETHE MARKET FOR EXPANDED FOAM
7.6 OTHERS
7.6.1 INCREASING APPLICATIONS OF OTHER FOAMS EXPECTED TO DRIVE THE MARKET
8 TECHNICAL FOAM MARKET, BY END USE (Page No. - 52)
8.1 INTRODUCTION
8.2 AUTOMOTIVE & TRANSPORTATION
8.2.1 ABILITY TO PERFORM IN ADVERSE ENVIRONMENTS DRIVES THE USE OF TECHNICAL FOAM IN AUTOMOTIVE & TRANSPORTATION
8.3 COMMERCIAL BUILDINGS
8.3.1 INCREASING CONSTRUCTION ACTIVITIES PROJECTED TO FUEL THE COMMERCIAL BUILDINGS SEGMENT
8.4 ELECTRICALS & ELECTRONICS
8.4.1 INCREASE IN THE CONSUMPTION OF SMART HOME APPLIANCES IS EXPECTED TO DRIVE THE ELECTRICAL & ELECTRONICS SEGMENT
8.5 OFFICE EQUIPMENT
8.5.1 INCREASING NUMBER OF COMMERCIAL BUILDINGS WILL TRIGGER THE MARKET FOR TECHNICAL FOAM IN OFFICE EQUIPMENT
8.6 MEDICAL
8.6.1 RESISTANCE TO MICROBIAL GROWTH AND LOW MOISTURE ABSORPTION PROJECTED TO FUEL THE MARKET FOR MEDICAL END USES
8.7 OTHERS
8.7.1 HIGH TENSILE STRENGTH, TEAR STRENGTH, AND LOAD-BEARING PERFORMANCE DRIVE THE MARKET FOR OTHER END USES
9 TECHNICAL FOAM MARKET, BY REGION (Page No. - 60)
9.1 INTRODUCTION
9.2 ASIA PACIFIC
9.2.1 CHINA
9.2.1.1 China is expected to lead the Asia Pacific technical foam market
9.2.2 JAPAN
9.2.2.1 Increase in demand for pipe insulation drives the market in Japan
9.2.3 INDIA
9.2.3.1 Increase in the construction of commercial buildings will fuel the technical foam market in India
9.2.4 SOUTH KOREA
9.2.4.1 Increase in the demand for foam in electronics products is projected to drive the market in South Korea
9.2.5 REST OF ASIA PACIFIC
9.2.5.1 Stringent regulations for efficient HVAC systems projected to propel the market in Rest of Asia Pacific
9.3 EUROPE
9.3.1 GERMANY
9.3.1.1 Germany is expected to lead the market in Europe
9.3.2 UK
9.3.2.1 Growth in commercial sector will drive the demand for technical foam in the UK
9.3.3 FRANCE
9.3.3.1 Increase in new construction projects expected to trigger market growth in France
9.3.4 ITALY
9.3.4.1 Increase in automotive vehicle sales drives the market in Italy
9.3.5 SPAIN
9.3.5.1 Growing infrastructural activities projected to drive the market in Spain
9.3.6 RUSSIA
9.3.6.1 Low temperatures in the country drive demand for technical foam in Russia
9.3.7 TURKEY
9.3.7.1 Growing commercial building sector projected to drive the market in Turkey
9.3.8 REST OF EUROPE
9.3.8.1 Presence of major players to propel the market in Rest of Europe
9.4 NORTH AMERICA
9.4.1 US
9.4.1.1 Increase in demand for polyurethane from automotive & transport projected to drive market in the US
9.4.2 CANADA
9.4.2.1 Increase in demand for acoustic insulation in construction expected to fuel the market in Canada
9.4.3 MEXICO
9.4.3.1 Increasing investment in construction is expected to trigger the technical foam market in Mexico
9.5 MIDDLE EAST & AFRICA
9.5.1 SAUDI ARABIA
9.5.1.1 Increase in construction activities expected to propel the market in Saudi Arabia
9.5.2 UAE
9.5.2.1 Increase in sales of automobiles projected to drive the market in the UAE
9.5.3 SOUTH AFRICA
9.5.3.1 Government initiatives and increase in infrastructural activities drive the market in South Africa
9.5.4 REST OF MIDDLE EAST & AFRICA
9.5.4.1 Increasing construction of commercial buildings projected to drive market in Rest of Middle East & Africa
9.6 SOUTH AMERICA
9.6.1 BRAZIL
9.6.1.1 Brazil is expected to lead the technical foam market in South America
9.6.2 ARGENTINA
9.6.2.1 Increasing expenditure in medical sector projected to drive the market in Argentina
9.6.3 REST OF SOUTH AMERICA
9.6.3.1 Increase in demand from office equipment and medical end uses expected to drive the market in Rest of South America
10 COMPETITIVE LANDSCAPE (Page No. - 105)
10.1 INTRODUCTION
10.2 COMPETITIVE LEADERSHIP MAPPING
10.2.1 VISIONARY LEADERS
10.2.2 INNOVATORS
10.2.3 DYNAMIC DIFFERENTIATORS
10.2.4 EMERGING COMPANIES
10.3 STRENGTH OF PRODUCT PORTFOLIO
10.4 BUSINESS STRATEGY EXCELLENCE
10.5 SHARE OF KEY PLAYERS IN THE TECHNICAL FOAM MARKET
11 COMPANY PROFILES (Page No. - 110)
(Business Overview, Products Offered, Recent Developments, SWOT Analysis, winning imperatives, Threat from Competition, Right to Win)*
11.1 BASF SE
11.2 SEKISUI CHEMICAL CO., LTD.
11.3 DOW INC.
11.4 HUNTSMAN CORPORATION
11.5 TRELLEBORG AB
11.6 ARMACELL INTERNATIONAL S.A.
11.7 RECTICEL NV/SA
11.8 INOAC CORPORATION
11.9 UFP TECHNOLOGIES, INC.
11.10 FXI HOLDINGS, INC.
11.11 FOAMPARTNER GROUP
11.12 LANXESS AG
11.13 EUROFOAM GROUP
11.14 WANHUA CHEMICAL GROUP CO., LTD.
11.15 SHEELA FOAM LIMITED.
11.16 COMPAGNIE DE SAINT-GOBAIN S.A.
11.17 THE WOODBRIDGE GROUP
11.18 GENERAL PLASTICS MANUFACTURING COMPANY
11.19 OTHER KEY PLAYERS
11.19.1 ADIENT PLC
11.19.2 FUTURE FOAM, INC.
11.19.3 AMERICAN FOAM PRODUCTS INC.
11.19.4 CARPENTER SAS (SUBSIDIARY OF CARPENTER CO.)
11.19.5 FOAM SUPPLIES, INC.
11.19.6 HENKEL POLYBIT INDUSTRIES LTD.
11.19.7 REMPAC FOAM CORPORATION
*Details on Business Overview, Products Offered, Recent Developments, SWOT Analysis, winning imperatives, Threat from Competition, Right to Win might not be captured in case of unlisted companies.
12 APPENDIX (Page No. - 157)
12.1 DISCUSSION GUIDE
12.2 KNOWLEDGE STORE: MARKETSANDMARKETS SUBSCRIPTION PORTAL
12.3 AVAILABLE CUSTOMIZATIONS
12.4 RELATED REPORTS
12.5 AUTHOR DETAILS
LIST OF TABLES (122 Tables)
TABLE 1 TECHNICAL FOAM MARKET, BY FORM, 2018–2025 (USD MILLION)
TABLE 2 TECHNICAL FOAM MARKET, BY FORM, 2018–2025 (TONS)
TABLE 3 FLEXIBLE TECHNICAL FOAM MARKET, BY REGION, 2018–2025 (USD MILLION)
TABLE 4 FLEXIBLE TECHNICAL FOAM MARKET, BY REGION, 2018–2025 (TONS)
TABLE 5 RIGID TECHNICAL FOAM MARKET, BY REGION, 2018–2025 (USD MILLION)
TABLE 6 RIGID TECHNICAL FOAM MARKET, BY REGION, 2018–2025 (TONS)
TABLE 7 SPRAY TECHNICAL FOAM MARKET, BY REGION, 2018–2025 (USD MILLION)
TABLE 8 SPRAY TECHNICAL FOAM MARKET, BY REGION, 2018–2025 (TONS)
TABLE 9 TECHNICAL FOAM MARKET, BY MATERIAL, 2018–2025 (USD MILLION)
TABLE 10 TECHNICAL FOAM MARKET, BY MATERIAL, 2018–2025 (TONS)
TABLE 11 POLYURETHANE TECHNICAL FOAM MARKET, BY REGION, 2018–2025 (USD MILLION)
TABLE 12 POLYURETHANE TECHNICAL FOAM MARKET, BY REGION, 2018–2025 (TONS)
TABLE 13 ELASTOMERIC TECHNICAL FOAM MARKET, BY REGION, 2018–2025 (USD MILLION)
TABLE 14 ELASTOMERIC TECHNICAL FOAM MARKET, BY REGION, 2018–2025 (TONS)
TABLE 15 POLYETHYLENE TECHNICAL FOAM MARKET, BY REGION, 2018–2025 (USD MILLION)
TABLE 16 POLYETHYLENE TECHNICAL FOAM MARKET, BY REGION, 2018–2025 (TONS)
TABLE 17 EXPANDED TECHNICAL FOAM MARKET, BY REGION, 2018–2025 (USD MILLION)
TABLE 18 EXPANDED TECHNICAL FOAM MARKET, BY REGION, 2018–2025 (TONS)
TABLE 19 OTHER TECHNICAL FOAM MARKET, BY REGION, 2018–2025 (USD MILLION)
TABLE 20 OTHER TECHNICAL FOAM MARKET, BY REGION, 2018–2025 (TONS)
TABLE 21 TECHNICAL FOAM MARKET, BY END USE, 2018–2025 (USD MILLION)
TABLE 22 MARKET, BY END USE, 2018–2025 (TONS)
TABLE 23 TECHNICAL FOAM MARKET FOR AUTOMOTIVE & TRANSPORTATION, BY REGION, 2018–2025 (USD MILLION)
TABLE 24 MARKET FOR AUTOMOTIVE & TRANSPORTATION, BY REGION, 2018–2025 (TONS)
TABLE 25 TECHNICAL FOAM MARKET FOR COMMERCIAL BUILDINGS, BY REGION, 2018–2025 (USD MILLION)
TABLE 26 MARKET FOR COMMERCIAL BUILDINGS, BY REGION, 2018–2025 (TONS)
TABLE 27 TECHNICAL FOAM MARKET FOR ELECTRICALS & ELECTRONICS, BY REGION, 2018–2025 (USD MILLION)
TABLE 28 MARKET FOR ELECTRICALS & ELECTRONICS, BY REGION, 2018–2025 (TONS)
TABLE 29 TECHNICAL FOAM MARKET FOR OFFICE EQUIPMENT, BY REGION, 2018–2025 (USD MILLION)
TABLE 30 MARKET FOR OFFICE EQUIPMENT, BY REGION, 2018–2025 (TONS)
TABLE 31 TECHNICAL FOAM MARKET FOR MEDICAL END USE, BY REGION, 2018–2025 (USD MILLION)
TABLE 32 MARKET FOR MEDICAL END USE, BY REGION, 2018–2025 (TONS)
TABLE 33 TECHNICAL FOAM MARKET FOR OTHER END USES, BY REGION, 2018–2025 (USD MILLION)
TABLE 34 MARKET FOR OTHER END USES, BY REGION, 2018–2025 (TONS)
TABLE 35 TECHNICAL FOAM MARKET, BY REGION, 2018–2025 (USD MILLION)
TABLE 36 MARKET, BY REGION, 2018–2025 (TONS)
TABLE 37 ASIA PACIFIC: TECHNICAL FOAM MARKET, BY COUNTRY, 2018–2025 (USD MILLION)
TABLE 38 ASIA PACIFIC: MARKET, BY COUNTRY, 2018–2025 (TONS)
TABLE 39 ASIA PACIFIC: TECHNICAL FOAM MARKET, BY FORM, 2018–2025 (USD MILLION)
TABLE 40 ASIA PACIFIC: MARKET, BY FORM, 2018–2025 (TONS)
TABLE 41 ASIA PACIFIC: TECHNICAL FOAM MARKET, BY MATERIAL, 2018–2025 (USD MILLION)
TABLE 42 ASIA PACIFIC: MARKET, BY MATERIAL, 2018–2025 (TONS)
TABLE 43 ASIA PACIFIC: TECHNICAL FOAM MARKET, BY END USE, 2018–2025 (USD MILLION)
TABLE 44 ASIA PACIFIC: MARKET, BY END USE, 2018–2025 (TONS)
TABLE 45 CHINA: TECHNICAL FOAM MARKET, BY END USE, 2018–2025 (USD MILLION)
TABLE 46 CHINA: MARKET, BY END USE, 2018–2025 (TONS)
TABLE 47 JAPAN: TECHNICAL FOAM MARKET, BY END USE, 2018–2025 (USD MILLION)
TABLE 48 JAPAN: MARKET, BY END USE, 2018–2025 (TONS)
TABLE 49 INDIA: TECHNICAL FOAM MARKET, BY END USE, 2018–2025 (USD MILLION)
TABLE 50 INDIA: MARKET, BY END USE, 2018–2025 (TONS)
TABLE 51 SOUTH KOREA: TECHNICAL FOAM MARKET, BY END USE, 2018–2025 (USD MILLION)
TABLE 52 SOUTH KOREA: MARKET, BY END USE, 2018–2025 (TONS)
TABLE 53 REST OF ASIA PACIFIC: TECHNICAL FOAM MARKET, BY END USE, 2018–2025 (USD MILLION)
TABLE 54 REST OF ASIA PACIFIC: MARKET, BY END USE, 2018–2025 (TONS)
TABLE 55 EUROPE: TECHNICAL FOAM MARKET, BY COUNTRY, 2018–2025 (USD MILLION)
TABLE 56 EUROPE: MARKET, BY COUNTRY, 2018–2025 (TONS)
TABLE 57 EUROPE: TECHNICAL FOAM MARKET, BY FORM, 2018–2025 (USD MILLION)
TABLE 58 EUROPE: MARKET, BY FORM, 2018–2025 (TONS)
TABLE 59 EUROPE: TECHNICAL FOAM MARKET, BY MATERIAL, 2018–2025 (USD MILLION)
TABLE 60 EUROPE: MARKET, BY MATERIAL, 2018–2025 (TONS)
TABLE 61 EUROPE: TECHNICAL FOAM MARKET, BY END USE, 2018–2025 (USD MILLION)
TABLE 62 EUROPE: MARKET, BY END USE, 2018–2025 (TONS)
TABLE 63 GERMANY: TECHNICAL FOAM MARKET, BY END USE, 2018–2025 (USD MILLION)
TABLE 64 GERMANY: MARKET, BY END USE, 2018–2025 (TONS)
TABLE 65 UK: TECHNICAL FOAM MARKET, BY END USE, 2018–2025 (USD MILLION)
TABLE 66 UK: MARKET, BY END USE, 2018–2025 (TONS)
TABLE 67 FRANCE: TECHNICAL FOAM MARKET, BY END USE, 2018–2025 (USD MILLION)
TABLE 68 FRANCE: MARKET, BY END USE, 2018–2025 (TONS)
TABLE 69 ITALY: TECHNICAL FOAM MARKET, BY END USE, 2018–2025 (USD MILLION)
TABLE 70 ITALY: MARKET, BY END USE, 2018–2025 (TONS)
TABLE 71 SPAIN: TECHNICAL FOAM MARKET, BY END USE, 2018–2025 (USD MILLION)
TABLE 72 SPAIN: MARKET, BY END USE, 2018–2025 (TONS)
TABLE 73 RUSSIA: TECHNICAL FOAM MARKET, BY END USE, 2018–2025 (USD MILLION)
TABLE 74 RUSSIA: MARKET, BY END USE, 2018–2025 (TONS)
TABLE 75 TURKEY: TECHNICAL FOAM MARKET, BY END USE, 2018–2025 (USD MILLION)
TABLE 76 TURKEY: MARKET, BY END USE, 2018–2025 (TONS)
TABLE 77 REST OF EUROPE: TECHNICAL FOAM MARKET, BY END USE, 2018–2025 (USD MILLION)
TABLE 78 REST OF EUROPE: MARKET, BY END USE, 2018–2025 (TONS)
TABLE 79 NORTH AMERICA: TECHNICAL FOAM MARKET SIZE, BY COUNTRY, 2018–2025 (USD MILLION)
TABLE 80 NORTH AMERICA: MARKET SIZE, BY COUNTRY, 2018–2025 (TONS)
TABLE 81 NORTH AMERICA: TECHNICAL FOAM MARKET SIZE, BY FORM, 2018–2025 (USD MILLION)
TABLE 82 NORTH AMERICA: MARKET SIZE, BY FORM, 2018–2025 (TONS)
TABLE 83 NORTH AMERICA: TECHNICAL FOAM MARKET SIZE, BY MATERIAL, 2018–2025 (USD MILLION)
TABLE 84 NORTH AMERICA: MARKET SIZE, BY MATERIAL, 2018–2025 (TONS)
TABLE 85 NORTH AMERICA: TECHNICAL FOAM MARKET SIZE, BY END USE, 2018–2025 (USD MILLION)
TABLE 86 NORTH AMERICA: MARKET SIZE, BY END USE, 2018–2025 (TONS)
TABLE 87 US: TECHNICAL FOAM MARKET SIZE, BY END USE, 2018–2025 (USD MILLION)
TABLE 88 US: MARKET SIZE, BY END USE, 2018–2025 (TONS)
TABLE 89 CANADA: TECHNICAL FOAM MARKET SIZE, BY END USE, 2018–2025 (USD MILLION)
TABLE 90 CANADA: MARKET SIZE, BY END USE, 2018–2025 (TONS)
TABLE 91 MEXICO: TECHNICAL FOAM MARKET SIZE, BY END USE, 2018–2025 (USD MILLION)
TABLE 92 MEXICO: MARKET SIZE, BY END USE, 2018–2025 (TONS)
TABLE 93 MIDDLE EAST & AFRICA: TECHNICAL FOAM MARKET, BY COUNTRY, 2018–2025 (USD MILLION)
TABLE 94 MIDDLE EAST & AFRICA: MARKET, BY COUNTRY, 2018–2025 (TONS)
TABLE 95 MIDDLE EAST & AFRICA: TECHNICAL FOAM MARKET, BY FORM, 2018–2025 (USD MILLION)
TABLE 96 MIDDLE EAST & AFRICA: MARKET, BY FORM, 2018–2025 (TONS)
TABLE 97 MIDDLE EAST & AFRICA: TECHNICAL FOAM MARKET, BY MATERIAL, 2018–2025 (USD MILLION)
TABLE 98 MIDDLE EAST & AFRICA: MARKET, BY MATERIAL, 2018–2025 (TONS)
TABLE 99 MIDDLE EAST & AFRICA: TECHNICAL FOAM MARKET, BY END USE, 2018–2025 (USD MILLION)
TABLE 100 MIDDLE EAST & AFRICA: MARKET, BY END USE, 2018–2025 (TONS)
TABLE 101 SAUDI ARABIA: TECHNICAL FOAM MARKET, BY END USE, 2018–2025 (USD MILLION)
TABLE 102 SAUDI ARABIA: TECHNICAL FOAM MARKET, BY END USE, 2018–2025 (TONS)
TABLE 103 UAE: TECHNICAL FOAM MARKET, BY END USE, 2018–2025 (USD MILLION)
TABLE 104 UAE: TECHNICAL FOAM MARKET, BY END USE, 2018–2025 (TONS)
TABLE 105 SOUTH AFRICA: TECHNICAL FOAM MARKET, BY END USE, 2018–2025 (USD MILLION)
TABLE 106 SOUTH AFRICA: TECHNICAL FOAM MARKET, BY END USE, 2018–2025 (TONS)
TABLE 107 REST OF MIDDLE EAST & AFRICA: TECHNICAL FOAM MARKET, BY END USE, 2018–2025 (USD MILLION)
TABLE 108 REST OF MIDDLE EAST & AFRICA: TECHNICAL FOAM MARKET, BY END USE, 2018–2025 (TONS)
TABLE 109 SOUTH AMERICA: TECHNICAL FOAM MARKET, BY COUNTRY, 2018–2025 (USD MILLION)
TABLE 110 SOUTH AMERICA: MARKET, BY COUNTRY, 2018–2025 (TONS)
TABLE 111 SOUTH AMERICA: TECHNICAL FOAM MARKET, BY FORM, 2018–2025 (USD MILLION)
TABLE 112 SOUTH AMERICA: MARKET, BY FORM, 2018–2025 (TONS)
TABLE 113 SOUTH AMERICA: TECHNICAL FOAM MARKET, BY MATERIAL, 2018–2025 (USD MILLION)
TABLE 114 SOUTH AMERICA: MARKET, BY MATERIAL, 2018–2025 (TONS)
TABLE 115 SOUTH AMERICA: TECHNICAL FOAM MARKET, BY END USE, 2018–2025 (USD MILLION)
TABLE 116 SOUTH AMERICA: MARKET, BY END USE, 2018–2025 (TONS)
TABLE 117 BRAZIL: TECHNICAL FOAM MARKET, BY END USE, 2018–2025 (USD MILLION)
TABLE 118 BRAZIL: TECHNICAL FOAM MARKET, BY END USE, 2018–2025 (TONS)
TABLE 119 ARGENTINA: TECHNICAL FOAM MARKET, BY END USE, 2018–2025 (USD MILLION)
TABLE 120 ARGENTINA: TECHNICAL FOAM MARKET, BY END USE, 2018–2025 (TONS)
TABLE 121 REST OF SOUTH AMERICA: TECHNICAL FOAM MARKET, BY END USE, 2018–2025 (USD MILLION)
TABLE 122 REST OF SOUTH AMERICA: TECHNICAL FOAM MARKET, BY END USE, 2018–2025 (TONS)
LIST OF FIGURES (53 Figures)
FIGURE 1 BASE NUMBER CALCULATION – APPROACH 1
FIGURE 2 BASE NUMBER CALCULATION – APPROACH 2
FIGURE 3 BASE NUMBER CALCULATION – APPROACH 3
FIGURE 4 BASE NUMBER CALCULATION – APPROACH 4
FIGURE 5 MARKET SIZE ESTIMATION: TOP-DOWN APPROACH
FIGURE 6 MARKET SIZE ESTIMATION: BOTTOM-UP APPROACH
FIGURE 7 POLYURETHANE SEGMENT TO DOMINATE THE TECHNICAL FOAM MARKET (USD MILLION)
FIGURE 8 AUTOMOTIVE & TRANSPORTATION TO BE THE LARGEST END USE OF TECHNICAL FOAM (USD MILLION)
FIGURE 9 ASIA PACIFIC TO LEAD THE TECHNICAL FOAM MARKET (USD MILLION)
FIGURE 10 INCREASING DEMAND FROM VARIOUS END USES OFFERS LUCRATIVE OPPORTUNITIES FOR MARKET PLAYERS
FIGURE 11 POLYURETHANE TO BE THE LARGEST MATERIAL SEGMENT DURING THE FORECAST PERIOD (TONS)
FIGURE 12 FLEXIBLE FOAM EXPECTED TO BE THE LARGEST FORM SEGMENT (TONS)
FIGURE 13 AUTOMOTIVE & TRANSPORTATION SEGMENT TO ACCOUNT FOR THE LARGEST MARKET SHARE (TONS)
FIGURE 14 DRIVERS, RESTRAINTS, OPPORTUNITIES, AND CHALLENGES IN THE TECHNICAL FOAM MARKET
FIGURE 15 CRUDE OIL PRICES, (2016-2019)
FIGURE 16 TECHNICAL FOAM MARKET: PORTER’S FIVE FORCES ANALYSIS
FIGURE 17 TECHNICAL FOAM MARKET, BY FORM, 2020 & 2025 (USD MILLION)
FIGURE 18 TECHNICAL FOAM MARKET, BY MATERIAL, 2020 & 2025 (USD MILLION)
FIGURE 19 TECHNICAL FOAM MARKET, BY END USE, 2020 & 2025 (USD MILLION)
FIGURE 20 TECHNICAL FOAM MARKET, BY REGION (USD MILLION)
FIGURE 21 ASIA PACIFIC TECHNICAL FOAM MARKET SNAPSHOT
FIGURE 22 EUROPE TECHNICAL FOAM MARKET SNAPSHOT
FIGURE 23 NORTH AMERICA: TECHNICAL FOAM MARKET SNAPSHOT
FIGURE 24 MIDDLE EAST & AFRICA TECHNICAL FOAM MARKET SNAPSHOT
FIGURE 25 SOUTH AMERICA TECHNICAL FOAM MARKET SNAPSHOT
FIGURE 26 TECHNICAL FOAM MARKET COMPETITIVE LEADERSHIP MAPPING, 2019
FIGURE 27 PRODUCT PORTFOLIO ANALYSIS OF TOP PLAYERS IN TECHNICAL FOAM MARKET
FIGURE 28 BUSINESS STRATEGY EXCELLENCE OF TOP PLAYERS IN TECHNICAL FOAM MARKET
FIGURE 29 SHARE OF KEY PLAYERS IN TECHNICAL FOAM MARKET, 2019
FIGURE 30 BASF SE: COMPANY SNAPSHOT
FIGURE 31 BASF SE: SWOT ANALYSIS
FIGURE 32 SEKISUI CHEMICAL CO., LTD.: COMPANY SNAPSHOT
FIGURE 33 SEKISUI CHEMICAL CO., LTD.: SWOT ANALYSIS
FIGURE 34 DOW INC.: COMPANY SNAPSHOT
FIGURE 35 DOW INC.: SWOT ANALYSIS
FIGURE 36 HUNTSMAN CORPORATION: COMPANY SNAPSHOT
FIGURE 37 HUNTSMAN CORPORATION: SWOT ANALYSIS
FIGURE 38 TRELLEBORG AB: COMPANY SNAPSHOT
FIGURE 39 TRELLEBORG AB: SWOT ANALYSIS
FIGURE 40 ARMACELL INTERNATIONAL S.A.: COMPANY SNAPSHOT
FIGURE 41 ARMACELL INTERNATIONAL S.A.: SWOT ANALYSIS
FIGURE 42 RECTICEL NV/SA: COMPANY SNAPSHOT
FIGURE 43 RECTICEL NV/SA: SWOT ANALYSIS
FIGURE 44 INOAC CORPORATION: COMPANY SNAPSHOT
FIGURE 45 UFP TECHNOLOGIES, INC.: COMPANY SNAPSHOT
FIGURE 46 UFP TECHNOLOGIES, INC.: SWOT ANALYSIS
FIGURE 47 LANXESS AG: COMPANY SNAPSHOT
FIGURE 48 LANXESS AG: SWOT ANALYSIS
FIGURE 49 WANHUA CHEMICAL GROUP CO., LTD.: COMPANY SNAPSHOT
FIGURE 50 SHEELA FOAM LIMITED: COMPANY SNAPSHOT
FIGURE 51 SHEELA FOAM LIMITED: SWOT ANALYSIS
FIGURE 52 COMPAGNIE DE SAINT-GOBAIN S.A.: COMPANY SNAPSHOT
FIGURE 53 COMPAGNIE DE SAINT-GOBAIN S.A.: SWOT ANALYSIS
The study involved four major activities to estimate the current size of the technical foam market. Exhaustive secondary research was carried out to collect information on the market, peer markets, and the parent market. The next step was to validate the findings obtained from secondary sources, assumptions, and sizing with industry experts across the value chain through primary research. Both, the top-down and bottom-up approaches were employed to estimate the complete market size. Thereafter, the market breakdown and data triangulation procedures were used to estimate the market size of segments and subsegments.
Secondary Research
Secondary data includes company information obtained from annual reports, press releases, and investor presentations; white papers; and articles by recognized authors. In the market engineering process (including calculations for market statistics, market breakdown, market size estimations, market forecast, and data triangulation), both, the top-down and bottom-up approaches were extensively used, along with several data triangulation methods to obtain, verify, and validate the market revenues arrived at. Extensive qualitative and quantitative analysis was performed on the complete market engineering process to list key information/insights throughout the report.
Primary Research
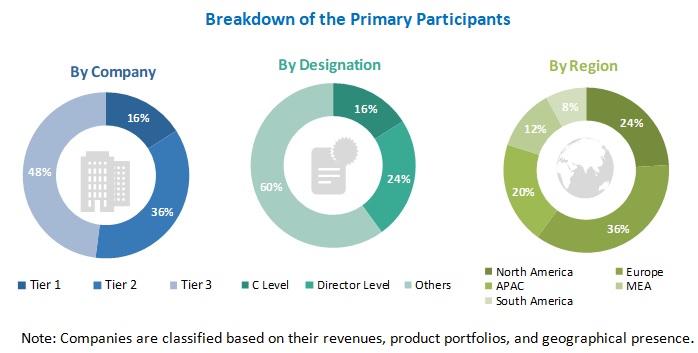
In the primary research process, experts from the supply and demand sides were interviewed to obtain qualitative and quantitative information and to validate the data arrived at through secondary research. Primary sources from the supply side included industry experts such as CEOs, vice presidents, marketing directors, technology & innovation directors, and related key executives from various key companies and organizations operating in the technical foam market. Following is the breakdown of primary respondents.
To know about the assumptions considered for the study, download the pdf brochure
Market Size Estimation
Both, the top-down and bottom-up approaches were used to estimate and validate the total size of the technical foam market. These methods were also used extensively to estimate the size of various subsegments in the market. The research methodology used to estimate the market size included the following:
- Key players in the industry and markets were identified through extensive secondary research.
- The industry’s supply chain and market size, in terms of volume and value, were determined through primary and secondary research processes.
- All percentage shares, splits, and breakdowns were determined using secondary sources and verified through primary sources.
Data Triangulation
After arriving at the overall market size-using the technical foam market size estimation process explained above-the market was split into several segments and subsegments. To complete the overall market engineering process and arrive at the exact statistics of each market segment and subsegment, the data triangulation, and market breakdown procedures were employed, wherever applicable. The data was triangulated by studying various factors and trends from both, the demand and supply sides.
Report Objectives
- To define, describe, and forecast the market size for technical foam, in terms of value and volume
- To provide detailed information regarding the major factors (drivers, restraints, opportunities, and challenges) influencing market growth
- To estimate and forecast the technical foam market size on the basis of form, type, end use, and region
- To analyze opportunities in the market for stakeholders and present a competitive landscape of market leaders
- To strategically profile key players in the market and comprehensively analyze their core competencies1
Available Customizations
With the given market data, MarketsandMarkets offers customizations according to the specific requirements of companies. The following customization options are available for the report:
Material Type Analysis
- A further breakdown of the material type segments of the technical foam market with respect to a particular end-user
End Use Analysis
- A further breakdown of the end use segments of the technical foam market with respect to a particular country
Company Information
- Detailed analysis and profiles of additional market players (up to 5)


Growth opportunities and latent adjacency in Technical Foam Market