Terrestrial Laser Scanning Market by Solution (TLS System, TLS Services), Application (Building Information Modelling (BIM), Surveying, Research & Development), Type (Phase-Shift, Pulse-Based and Mobile Scanner), and Region - Global Forecast From 2025 to 2035


Terrestrial laser scanning has emerged as a cornerstone technology in the built environment, infrastructure projects, and scientific research. By capturing high density three dimensional point clouds of physical spaces with exceptional accuracy and speed, terrestrial laser scanners provide a digital twin of the world that professionals can use for measurement, modelling and analysis. The market for terrestrial laser scanning encompasses hardware systems and a broad array of services that turn raw scan data into actionable insights. As industries pursue greater productivity, safety and sustainability, adoption of terrestrial laser scanning solutions is accelerating across construction, surveying, asset management and research. This report style blog explores the market by solution, application, scanner type and region and presents a global forecast from 2025 to 2035.
Download PDF Brochure: https://www.marketsandmarkets.com/pdfdownloadNewNew.asp?id=3652955
What is Terrestrial Laser Scanning
Terrestrial laser scanning is a method of collecting precise three dimensional data from physical environments using lasers that measure the distance to surfaces. The output is a point cloud where each point has positional coordinates and often intensity and color attributes. When combined with photogrammetry, GPS and building models, point clouds become the foundation for visualisation, analysis and decision making. Two broad solution categories dominate the market. The first is the TLS system which refers to the physical scanner hardware and its bundled software. The second is TLS services which covers data capture, processing, registration, modelling and delivery of final products to clients. Both the TLS system and TLS services business models are critical to the ecosystem and often complement each other.
Market Overview and Growth Drivers
Global demand for terrestrial laser scanning has been driven by the construction industry move towards digital project delivery, the need for accurate as built documentation for renovation works and the rise of large scale infrastructure projects. Surveying practices now require faster capture of complex geometries and verification against designs. Building information modelling has become the default approach for many major projects and high fidelity point clouds accelerate model creation and clash detection. Research organisations use TLS to monitor deformation, study heritage sites, and measure environmental change with a level of detail that was not possible with earlier survey methods.
Other growth drivers include improved affordability of compact scanners, advances in software automation, cloud based processing, and integration with mobile mapping systems and unmanned aerial vehicle data. The combination of higher throughput and lower cost per square meter scanned expands the addressable market beyond large projects into medium and small scale applications.
Solutions by Category
TLS System
The TLS system market covers the sale and leasing of scanner hardware along with bundled capture software and basic processing tools. Systems vary from high precision tripod mounted scanners to portable units designed for quick setup. Vendors differentiate on range accuracy, point density, scanning speed, weight and ruggedness. High end systems for engineering and defense applications focus on millimeter level accuracy at long ranges, while compact systems for architecture and interior capture emphasize portability, integrated cameras and simple workflows.
Scanner manufacturers increasingly offer ecosystem services like calibration, training and software plugins that enhance the value of their hardware. Product roadmaps show a clear trend toward convergence of lidar sensors with multi sensor payloads, edge computing for on device classification and tighter integration with BIM and GIS platforms.
TLS Services
TLS services form an essential part of the market by turning raw scans into useful deliverables. Service offerings include on site scanning, registration of multiple scans into a common coordinate system, noise reduction, classification of point clouds into semantic categories, conversion to mesh models, generation of as built drawings and direct integration into BIM. Many firms provide managed scanning services for ongoing asset monitoring and change detection, which is valuable for industrial plants, rail corridors and heritage management.
Service providers range from specialist scanning companies to multidisciplinary engineering consultancies and survey firms. The services market benefits from cloud based processing platforms that allow rapid turnaround and collaboration between remote teams. As automation improves, services are shifting toward higher value tasks such as analysis, simulation and predictive maintenance support.
Applications
Building Information Modelling
Building information modelling and terrestrial laser scanning are natural partners. Point clouds accelerate the transition from physical reality to a rich digital model. For new construction, scans verify installation accuracy and enable quality control. For renovation and retrofit projects, scans provide precise as built conditions that inform design decisions and cost estimates. Point cloud to BIM workflows reduce rework, improve coordination and shorten project timelines. As owners demand more digital deliverables and lifecycle data, the role of TLS in delivering accurate base models becomes more important.
Surveying
Surveying remains a primary application for TLS and benefits from rapid capture and high accuracy. Topographic surveys, corridor mapping, deformation monitoring and detailed site documentation are common use cases. TLS complements GNSS and total station workflows by providing dense spatial context. Surveyors are increasingly adopting TLS systems to meet client expectations for speed and thoroughness. Mobile scanning solutions enable survey teams to cover large areas efficiently while stationary systems provide the precision required for critical structures and boundary verification.
Research and development
Research and development uses of TLS span civil engineering, geology, archaeology, forestry and environmental sciences. Researchers rely on high resolution scans to quantify displacement in landslides, monitor structural health of bridges, measure sediment transport and create digital archives of cultural heritage sites. The repeatability of scans makes TLS ideal for monitoring changes over time and validating physical models. R D users also benefit from the increasing availability of open formats and tools that support custom analysis.
Types of Scanners
Phase Shift scanners
Phase Shift scanners measure the difference in phase between emitted and received continuous wave laser signals to compute distance. These sensors typically excel at high speed scanning and are effective for capturing dense point clouds of nearby to medium distance scenes. Phase Shift scanners are commonly used for indoor mapping, architecture and facility management due to their rapid capture rate and high point density. Their accuracy and performance make them suitable for many BIM and surveying tasks but they may be limited in very long range outdoor capture compared to pulse based systems.
Pulse Based scanners
Pulse Based scanners operate by emitting short laser pulses and measuring the time of flight for each return. These sensors are well suited to long range measurements and excel in rugged outdoor environments such as mining sites, tall building facades and long corridor mapping. Pulse based systems often provide reliable performance in variable lighting and atmospheric conditions and are preferred for large scale civil engineering surveys. The trade off is typically a lower point density at short range compared to phase shift scanners, but continuous improvements in detector technology are narrowing this gap.
Mobile Scanner systems
Mobile Scanner systems combine lidar sensors with positioning units and cameras mounted on vehicles, backpacks or handheld rigs. These systems offer a balance between coverage and detail by capturing data while in motion. Mobile scanners are ideal for corridor mapping, urban surveys, road asset management and interior walkthroughs at scale. They reduce acquisition time for linear infrastructure projects and provide synchronized imagery that aids in feature identification and GIS integration. Recent advances in SLAM algorithms and multi sensor fusion have improved registration accuracy for mobile systems, making them more competitive with static TLS in many applications.
Regional Market Segmentation
North America
North America remains a leading market for terrestrial laser scanning owing to high construction spend, mature surveying industries and widespread adoption of BIM. The United States drives demand in infrastructure renewal, building retrofit and defense related applications. Canada shows strong use in resource sectors and Arctic infrastructure monitoring. Adoption is accelerated by government investment in smart city initiatives and digital asset management.
Europe
Europe is a significant market driven by stringent building regulations, extensive historical preservation efforts and large public infrastructure programs. Western European countries lead in BIM adoption which fuels TLS use. Central and Eastern Europe show growing demand as investments in modernization and transport networks increase.
Asia Pacific
Asia Pacific is the fastest growing region as rapid urbanization and infrastructure development create large scale scanning opportunities. China, Japan and South Korea drive demand in both commercial construction and industrial plant monitoring. Southeast Asia and India show expanding interest as costs decline and local service ecosystems mature.
Middle East and Africa
The Middle East invests heavily in monumental construction and energy sector projects where TLS supports design verification and asset management. Africa is an emerging market where scanning aids in mining, infrastructure and heritage documentation. Growth in these regions depends on local training and availability of service providers.
Latin America
Latin America is a developing market with demand led by oil and gas, mining and transportation projects. Investment cycles and public sector spending influence uptake, while cross border projects and international firms often bring scanning expertise to the region.
Market Forecast 2025 to 2035
Global adoption of terrestrial laser scanning is expected to expand significantly between 2025 and 2035. Three distinct phases will characterize the decade to come. The initial phase from 2025 to 2028 focuses on consolidation and digitization. During this period large infrastructure programs and BIM mandates generate steady demand for TLS systems and services. Cloud processing platforms and software automation accelerate service delivery and expand addressable customers.
The mid phase from 2029 to 2031 is characterised by rapid scaling. Compact and mobile scanning solutions reach price points attractive to small and medium enterprises. Automation in point cloud classification, AI based feature extraction and plug and play integrations with BIM tools drive widespread use. Governments initiating large retrofit programs for decarbonization and resilience fuel recurring service contracts for condition assessment and monitoring.
The final phase from 2032 to 2035 is defined by maturity and embedding of TLS into digital twins, predictive maintenance workflows and continuous monitoring regimes. Renewed investment in transportation and energy infrastructure globally sustains long term demand. Service revenues grow faster than hardware sales as clients outsource scanning and analytics to specialist providers. Regionally, North America and Europe maintain dominant shares in value terms, while Asia Pacific becomes the largest volume market in unit shipments.
In numeric terms the global TLS system market is forecast to grow at a compound annual growth rate in the low to mid teens over 2025 to 2035 while the TLS services market is expected to grow faster as scanning becomes a recurring operational expense for asset owners. Service expansion and higher value deliverables such as change detection analytics and model integration will drive revenue per project upward.
Competitive Landscape and Key Business Models
The competitive field includes specialized scanner manufacturers, software developers and service integrators. Hardware vendors compete on sensor fidelity, portability and integration with cameras and GNSS units. Software firms compete on automation, cloud processing speed and interoperability with BIM and GIS platforms. Service providers differentiate through domain expertise, rapid turnaround and the ability to deliver regulatory compliant deliverables.
Several business models coexist. Manufacturers sell equipment directly and also offer subscription based cloud software to lock in long term revenue. Service firms provide project based scanning and managed scanning as a service for ongoing asset monitoring. Platform providers offer marketplaces that connect asset owners with certified scanning teams and provide standardised deliverables. Partnerships between hardware vendors and global engineering consultancies accelerate adoption for mega projects.
Major players in the terrestrial laser scanning market include 3D Digital Corporation (US), Carl Zeiss Optotechnik (Germany), Creaform (Canada), FARO Technologies (US), Maptek (Australia), Trimble (US), RIEGL Laser Measurement Systems (Austria), Teledyne Technologies (US), Topcon (Japan), Hexagon (Sweden), and Zoller + Fröhlich (Germany), among others.
Technology Trends Shaping the Next Decade
A number of technology trends will shape the market over the forecast period. Edge computing in scanners allows on device filtering and classification to reduce data transfer burdens. AI and deep learning simplify feature extraction like pipework, windows and structural elements which speeds up model integration. Interoperability standards improve so point clouds and BIM models can flow into asset management systems seamlessly.
Sensor fusion between lidar, thermal imaging and hyperspectral cameras opens new use cases in condition assessment and material identification. Mobile scanning systems will continue to improve registration accuracy making them suitable for even more demanding surveying tasks. Software as a service business models and pay per scan pricing will make scanning accessible to a wider set of users.
Challenges and Barriers to Adoption
Key challenges remain for market expansion. Managing and storing very large point clouds presents ongoing IT costs and workflow complexity. Integration with existing design and asset management systems requires mapping of data semantics which is non trivial. Skilled personnel are still required for best practice capture and registration even as automation improves, and a shortage of trained technicians in some regions slows adoption.
Regulatory compliance for certain infrastructure projects demands certified survey workflows and audited documentation which can favour established service providers and slow new entrants. Environmental factors such as atmospheric conditions and obstructed line of sight also limit the effectiveness of TLS in some contexts. Finally, customer procurement cycles and project based work mean that adoption patterns can be volatile and correlated with broader construction industry cycles.
Use Case Deep Dives
Digital Twins for Infrastructure Resilience
Terrestrial laser scanning is central to creating digital twins for bridges, rail corridors and industrial facilities. By combining repeated scans with sensor data and BIM, owners can monitor structural health and predict maintenance needs. Change detection algorithms flag corrosion, settlement or deformation early enabling targeted interventions that reduce downtime and prolong asset life.
Historical Preservation and Cultural Heritage
Museums and heritage organisations use TLS to document fragile sites in high fidelity. Point clouds enable accurate replication and virtual exhibitions and provide a permanent digital archive to study degradation over time. Scanning also supports restoration projects by providing precise geometries for missing or damaged elements.
Industrial Facilities and Plant Management
In industrial plants TLS improves safety and efficiency by enabling detailed as built models for piping, structural elements and equipment. These models support retrofit work, clash detection prior to shutdowns and serve as reference geometry for laser guided maintenance and robotics.
Investment Landscape and M A Activity
The TLS ecosystem has attracted investment into sensor development, cloud processing platforms and specialist service firms. Strategic acquisitions by large engineering consultancies and technology groups have been common as firms look to internalise scanning capabilities and offer end to end digital services. Venture investment focuses on AI tools that automate classification and model creation and on mobile scanning startups that offer fast capture for linear infrastructure. Expect continued consolidation as larger firms buy niche players to embed scanning into broader digital offerings.
Skills, Training and Standards
Widespread adoption depends on availability of trained technicians and standardised practices. Educational institutions and vendors increasingly provide certification courses that cover capture protocols, best practice registration, accuracy assessment and safety. Standards bodies and professional organisations are developing guidelines for deliverables and accuracy reporting which provide confidence to asset owners and regulators. Standardisation also enables market growth by reducing buyer uncertainty and enabling the development of marketplace ecosystems.
Environmental and Regulatory Influences
Sustainability initiatives influence scanning demand as retrofit and retrofit verification programs require detailed as built data to assess energy performance and to plan retrofits. Regulations that require digital record keeping and compliance checks are generating new scanning mandates in some jurisdictions. Environmental restrictions can both help and hinder demand. In protected heritage sites scanning is encouraged for documentation, while delicate ecosystems might restrict physical access requiring novel capture strategies.
Advice for buyers and asset owners
Asset owners considering TLS should evaluate the full lifecycle cost including capture frequency, processing and storage. For many use cases subscribing to managed scanning services delivers lower total cost of ownership and predictable budgets. Buyers should insist on open formats and integration with existing BIM or GIS platforms. Pilot projects help validate workflows and create internal advocates. Finally, investing in staff training ensures organisations can capture value from scanned data beyond the initial deliverable.
Future outlook and long term impact
By 2035 terrestrial laser scanning will be an embedded capability across infrastructure lifecycle management. The market will have matured into a predictable services dominated industry with hardware playing a supporting role in innovation. The real value will accrue to firms that can combine accurate spatial capture with analytics, predictive modelling and continuous monitoring. Cross sector applications from urban planning to autonomous vehicle validation will expand the TAM for TLS solutions. The ability to create living digital twins that inform operational, maintenance and planning decisions will cement the role of TLS in the digital transformation of the built world.
Terrestrial laser scanning is no longer a niche surveying tool. It is a foundational technology for modern construction, surveying and research workflows. The market offers two complementary tracks: TLS systems that provide the sensory input and TLS services that convert point clouds into business value. Scanner types offer trade offs between range density and mobility and choosing the right type is key to project success. Regions show varying adoption rates but global growth will be robust from 2025 to 2035 as software automation, cloud processing and mobile capture expand the addressable market. For investors, service firms and asset owners the imperative is clear. Those who embed scanning as a continuous operational capability will gain competitive advantage in cost control, safety and data driven asset management.
 Exclusive indicates content/data unique to MarketsandMarkets and not available with any competitors.
Table of Contents
1 Introduction (Page No. - 16)
1.1 Objectives of the Study
1.2 Market Definition
1.3 Study Scope
1.3.1 Markets Covered
1.3.2 Regional Scope
1.4 Years Considered for the Study
1.5 Currency
1.6 Limitations
1.7 Market Stakeholders
2 Research Methodology (Page No. - 20)
2.1 Research Data
2.1.1 Secondary Data
2.1.1.1 Key Data From Secondary Sources
2.1.2 Primary Data
2.1.2.1 Key Data From Primary Sources
2.1.2.2 Breakdown of Primaries
2.2 Market Size Estimation
2.2.1 Bottom-Up Approach
2.2.2 Top-Down Approach
2.3 Market Breakdown and Data Triangulation
2.4 Assumptions
3 Executive Summary (Page No. - 28)
4 Premium Insights (Page No. - 31)
4.1 Attractive Growth Opportunities in Terrestrial Laser Scanner Market
4.2 Europe Terrestrial Laser Scanner Market, By Solution & Country
4.3 Terrestrial Laser Scanner Market, By Major Countries
5 Market Overview (Page No. - 34)
5.1 Introduction
5.2 Market Dynamics
5.2.1 Drivers
5.2.1.1 Increasing Adoption of LiDAR in Building Information Modeling (BIM) Applications
5.2.1.2 Advancements in Networking for GNSS Applications of Land Survey Equipment
5.2.1.3 Increasing Adoption of Software as A Solution (SaaS)
5.2.2 Restraints
5.2.2.1 Limitations of LiDAR in Harsh Weather Conditions
5.2.3 Opportunities
5.2.3.1 Increased Use of LiDAR in GIS Applications
5.2.3.2 Increase in the Number of New Applications Demanding Terrestrial Laser Scanning Technology
5.2.4 Challenges
5.2.4.1 Conventional Mapping Techniques as A Low-Cost Substitute for LiDAR
6 Industry Trends (Page No. - 38)
6.1 Introduction
6.2 Future Trends
6.3 Technology Trends
6.3.1 Advancements in Mobile LiDAR Software and User Interface
6.3.2 Fusion of LiDAR Data and Images
6.3.3 Geiger-Mode and Single Photon LiDAR
6.3.4 Microprocessors and Electronic Theodolites
6.3.5 Storage and Others Support Devices (Display, Prism, and Accessories)
6.4 Patent/Patent Applications
7 Terrestrial Laser Scanning Market, By Solution (Page No. - 41)
7.1 Introduction
7.2 Terrestrial Laser Scanning System
7.2.1 Hardware
7.2.1.1 Laser Scanners
7.2.1.1.1 High Depth Reconstruction Accuracy is Increasing the Demand for Laser Scanners
7.2.1.2 Interface Devices
7.2.1.2.1 Demand for High Volume Data Transfer is Driving the Growth of Interface Devices
7.2.1.3 Wireless LAN Antenna
7.2.1.3.1 Increasing Trend for Wireless Connectivity is Driving Wireless LAN Antenna Market
7.2.1.4 Inertial Measurement Systems
7.2.1.4.1 Demand for Accurate TLS Data Presentation is Supporting the Growth of Inertial Measurement System (IMS)
7.2.1.5 GPS/Positioning Systems
7.2.1.5.1 Precise Positioning Requirements is Major Driver for Global Positioning Systems (GPS)
7.2.1.6 Digital Cameras
7.2.1.6.1 Advanced Features of Digital Camera Such as Digital Imaging and Geo-Referencing Will Be in High Demand
7.2.1.7 Others
7.2.2 Software
7.2.2.1 Huge Demand for Post Processing TLS Data Software is Driving the Software Market
7.3 Terrestrial Laser Scanning Services
7.3.1 Oil & Gas
7.3.1.1 Rise in the Demand for Asset Management Services in Oil & Gas Industry is Driving TLS Market.
7.3.2 Mining
7.3.2.1 Accurate Representations of Mines and Mining Machinery for Site Survey and Inspection is Driving the Terrestrial Laser Scanning Market in Mining
7.3.3 Infrastructure
7.3.3.1 Increasing Capital Expenditure in the Infrastructure Industry is Likely to Drive Terrestrial Laser Scanning Market
7.3.4 Forestry & Agriculture
7.3.4.1 Advances in Agriculture Technology & Increasing Crop Monitoring Activities is Increasing the Demand for Terrestrial Laser Scanning
7.3.5 Transportation & Logistics
7.3.5.1 High Demand for Corridor Mapping Services are Driving the Growth of Transportation & Logistics
7.3.6 Others
8 Terrestrial Laser Scanning Market, By Application (Page No. - 49)
8.1 Introduction
8.1.1 Building Information Modeling (BIM)
8.1.1.1 Architecture
8.1.1.1.1 Demand for Digitalization From the Architecture Firms are Driving the Growth for BIM Application
8.1.1.2 Civil Engineering
8.1.1.2.1 Increase in the Growth for Housing and New Construction Projects are Driving the Market for Civil Engineering
8.1.2 Surveying
8.1.2.1 Monitoring Survey
8.1.2.1.1 Oil & Gas Exploration is Expected to Drive Monitor Survey Applications
8.1.2.2 Mining Survey
8.1.2.2.1 Increasing Demand for Mine Exploration From Developing Economies are Expected to Drive Market
8.1.2.3 Topographical Survey
8.1.2.3.1 Increasing Border and Land Development Activities are Expected to Drive Demand for Topographical Survey
8.1.2.4 Forestry & Agricultural Survey
8.1.2.4.1 Modernization of Agricultural Activities Across the World is Driving the Terrestrial Laser Scanning Market.
8.1.2.5 City Modeling Survey
8.1.2.5.1 Growing Road and Rail Transport is Expected to Drive Demand for City Modelling Survey
8.1.2.6 Archaeological Survey
8.1.2.6.1 Spreading Awareness About the Preservation of Valuable Historical Assets and Monuments Will Increase the Demand for Archaeological Survey
8.1.3 Research & Engineering
8.1.3.1 Rise in the Institutional Research is Driving the Marker for Research & Engineering
8.1.4 Others
9 Terrestrial Laser Scanning Market, By Type (Page No. - 56)
9.1 Introduction
9.2 Phase-Shift Scanner
9.2.1 Due to Advantages Like Increased Speed of Acquisition and Dynamic Range Phase Shift Scanners Expected to Lead Terrestrial Laser Scanning Market
9.3 Pulse-Based Scanner
9.3.1 Increase in the Civil Engineering Projects are Expected to Increase the Demand Pulse-Based Scanner Type Segment
9.4 Mobile Scanner
9.4.1 Increasing Corridor Mapping Activities Will Increase the Demand for Mobile Scanners
10 Regional Analysis (Page No. - 60)
10.1 Introduction
10.2 Asia Pacific
10.2.1 By Country
10.2.1.1 China
10.2.1.1.1 Increasing Demand for TLS Services for Oil and Gas Industry is Driving the Market Growth
10.2.1.2 Japan
10.2.1.2.1 Digitalization in the Japanese Infrastructure Industry is Driving the Market
10.2.1.3 India
10.2.1.3.1 Increasing Demand for Terrestrial Laser Scanning Devices for Mining & Infrastructure Surveys are Driving the Market
10.2.1.4 Singapore
10.2.1.4.1 Increase in Smart Infrastructure is Expected to Drive the Terrestrial Laser Scanning in Singapore
10.2.1.5 Australia
10.2.1.5.1 Growth in the Mining Industry is Expected to Drive the Terrestrial Laser Scanning
10.3 North America
10.3.1 By Country
10.3.1.1 US
10.3.1.1.1 Positive Changes in the US Government Infrastructure Policy is Expected to Drive the TLS Market in US
10.3.1.2 Canada
10.3.1.2.1 Growth in the Service Sector is Expected to Drive the Terrestrial Laser Scanning in Canada
10.4 Europe
10.4.1 By Country
10.4.1.1 UK
10.4.1.1.1 Rise in the Demand for BIM Services are Driving the Growth of the Terrestrial Laser Scanning in UK
10.4.1.2 Germany
10.4.1.2.1 Infrastructure Modernization is Driving the Growth of the Terrestrial Laser Scanning in Germany
10.4.1.3 France
10.4.1.3.1 Increase in the Demand for Smart Infrastructure is Driving the Terrestrial Laser Scanning
10.4.1.4 Russia
10.4.1.4.1 Increasing in Oil and Gas Exploration is Expected to Drive the Terrestrial Laser Scanning in Russia
10.5 Middle East
10.5.1 By Country
10.5.1.1 Saudi Arabia
10.5.1.1.1 Increasing Smart Infrastructure and Oil & Gas Assets Management is Expected to Drive the Terrestrial Laser Scanning Market in Saudi Arabia
10.5.1.2 UAE
10.5.1.2.1 Rise in the Building Smart Infrastructures are Expected to Drive the Terrestrial Laser Scanning in the UAE
10.6 Rest of the World
10.6.1 By Country
10.6.1.1 South America
10.6.1.1.1 Rise in the Demand for Assets Management Services in the Mining Industry is Driving the Terrestrial Laser Scanning Market in South America
10.6.1.2 Africa
10.6.1.2.1 Growing Demand for Land Surveys for Agriculture and Forestry Projects is Driving the Market for Africa
11 Competitive Landscape (Page No. - 100)
11.1 Introduction
11.2 Competitive Analysis
11.3 Market Ranking Analysis
11.4 Competitive Scenario
11.4.1 New Product Launches
11.4.2 Acquisitions
11.4.3 Investment and Expansion
11.4.4 Partnerships and Agreements
12 Company Profiles (Page No. - 112)
(Business Overview, Products Offered, Recent Developments, SWOT Analysis, MnM View)*
12.1 Hexagon Geosystems
12.2 Trimble
12.3 Teledyne Technologies
12.4 Faro Technologies
12.5 Riegl Laser Measurement Systems
12.6 Creaform (Ametek)
12.7 Maptek
12.8 3D Digital Corporation
12.9 Carl Zeiss Optotechnik
12.10 Basic Software Inc.
12.11 Zoller + Fröhlich
12.12 Merrett Survey
*Details on Business Overview, Products Offered, Recent Developments, SWOT Analysis, MnM View might not be captured in case of unlisted companies.
13 Appendix (Page No. - 143)
13.1 Discussion Guide
13.2 Knowledge Store: Marketsandmarkets’ Subscription Portal
13.3 Related Reports
13.4 Author Details
List of Tables (84 Tables)
Table 1 Innovation and Patent Registrations, 2013-2017
Table 2 Terrestrial Laser Scanning, By Solution, 2016–2023 (USD Million)
Table 3 Terrestrial Laser Scanning, By System, 2016–2023 (USD Million)
Table 4 Terrestrial Laser Scanning, By Hardware, 2016–2023 (USD Million)
Table 5 Terrestrial Laser Scanning Services Market, By Industry, 2016–2023 (USD Million)
Table 6 Terrestrial Laser Scanning, By Application, 2016–2023 (USD Million)
Table 7 Terrestrial Laser Scanning in the BIM Application, By Type, 2016–2023 (USD Million)
Table 8 Terrestrial Laser Scanning Market in the Surveying Application, By Type, 2016–2023 (USD Million)
Table 9 Terrestrial Laser Scanning, By Type, 2016–2023 (USD Million)
Table 10 Phase-Shift Scanners Terrestrial Laser Scanning, By Region, 2016–2023 (USD Million)
Table 11 Pulse-Based Scanners Terrestrial Laser Scanning, By Region, 2016–2023 (USD Million)
Table 12 Mobile Scanners Terrestrial Laser Scanning, By Region, 2016–2023 (USD Million)
Table 13 Terrestrial Laser Scanning Size, By Region, 2016–2023 (USD Million)
Table 14 Asia Pacific Terrestrial Laser Scanning Size, By Solution, 2016–2023 (USD Million)
Table 15 Asia Pacific Terrestrial Laser Scanning Size, By Terrestrial Laser Scanning System, 2016–2023 (USD Million)
Table 16 Asia Pacific Terrestrial Laser Scanning Size, By Terrestrial Laser Scanning Services, 2016–2023 (USD Million)
Table 17 Asia Pacific Terrestrial Laser Scanning Size, By Application, 2016–2023 (USD Million)
Table 18 Asia Pacific Terrestrial Laser Scanning Size, By Country, 2016–2023 (USD Million)
Table 19 China Terrestrial Laser Scanning Size, By Solution, 2016–2023 (USD Million)
Table 20 China Terrestrial Laser Scanning Size, By Terrestrial Laser Scanning System, 2016–2023 (USD Million)
Table 21 China Terrestrial Laser Scanning Size, By Terrestrial Laser Scanning Services, 2016–2023 (USD Million)
Table 22 Japan Terrestrial Laser Scanning Size, By Solution, 2016–2023 (USD Million)
Table 23 Japan Terrestrial Laser Scanning Size, By Terrestrial Laser Scanning System, 2016–2023 (USD Million)
Table 24 Japan Terrestrial Laser Scanning Size, By Terrestrial Laser Scanning Services, 2016–2023 (USD Million)
Table 25 India Terrestrial Laser Scanning Size, By Solution, 2016–2023 (USD Million)
Table 26 India Terrestrial Laser Scanning Size, By Terrestrial Laser Scanning System, 2016–2023 (USD Million)
Table 27 India Terrestrial Laser Scanning Size, By Terrestrial Laser Scanning Services, 2016–2023 (USD Million)
Table 28 Singapore Terrestrial Laser Scanning Size, By Solution, 2016–2023 (USD Million)
Table 29 Singapore Terrestrial Laser Scanning Size, By Terrestrial Laser Scanning System, 2016–2023 (USD Million)
Table 30 Singapore Terrestrial Laser Scanning Size, By Terrestrial Laser Scanning Services, 2016–2023 (USD Million)
Table 31 Australia Terrestrial Laser Scanning Size, By Solution, 2016–2023 (USD Million)
Table 32 Australia Terrestrial Laser Scanning Size, By Terrestrial Laser Scanning System, 2016–2023 (USD Million)
Table 33 Australia Terrestrial Laser Scanning Size, By Terrestrial Laser Scanning Services, 2016–2023 (USD Million)
Table 34 North America Terrestrial Laser Scanning Size, By Solution, 2016–2023 (USD Million)
Table 35 North America Terrestrial Laser Scanning Size, By Terrestrial Laser Scanning System, 2016–2023 (USD Million)
Table 36 North America Terrestrial Laser Scanning Size, By Terrestrial Laser Scanning Services, 2016–2023 (USD Million)
Table 37 North America Terrestrial Laser Scanning Size, By Application, 2016–2023 (USD Million)
Table 38 North America Terrestrial Laser Scanning Size, By Country, 2016–2023 (USD Million)
Table 39 US Terrestrial Laser Scanning Size, By Solution, 2016–2023 (USD Million)
Table 40 US Terrestrial Laser Scanning Size, By Terrestrial Laser Scanning System, 2016–2023 (USD Million)
Table 41 US Terrestrial Laser Scanning Market Size, By Terrestrial Laser Scanning Services, 2016–2023 (USD Million)
Table 42 Canada Terrestrial Laser Scanning Size, By Solution, 2016–2023 (USD Million)
Table 43 Canada Terrestrial Laser Scanning Size, By Terrestrial Laser Scanning Services, 2016–2023 (USD Million)
Table 44 Canada Terrestrial Laser Scanning Size, By Terrestrial Laser Scanning Services, 2016–2023 (USD Million)
Table 45 Europe Terrestrial Laser Scanning Size, By Solution, 2016–2023 (USD Million)
Table 46 Europe Terrestrial Laser Scanning Size, By Terrestrial Laser Scanning System, 2016–2023 (USD Million)
Table 47 Europe Terrestrial Laser Scanning Size, By Terrestrial Laser Scanning Services, 2016–2023 (USD Million)
Table 48 Europe Terrestrial Laser Scanning Size, By Application, 2016–2023 (USD Million)
Table 49 Europe Terrestrial Laser Scanning Size, By Country, 2016–2023 (USD Million)
Table 50 Terrestrial Laser Scanning Size, By Solution, 2016–2023 (USD Million)
Table 51 Terrestrial Laser Scanning Size, By Terrestrial Laser Scanning System, 2016–2023 (USD Million)
Table 52 Terrestrial Laser Scanning Size, By Terrestrial Laser Scanning Services, 2016–2023 (USD Million)
Table 53 Germany Terrestrial Laser Scanning Size, By Solution, 2016–2023 (USD Million)
Table 54 Germany Terrestrial Laser Scanning Size, By Terrestrial Laser Scanning System, 2016–2023 (USD Million)
Table 55 Germany Terrestrial Laser Scanning Size, By Terrestrial Laser Scanning Services, 2016–2023 (USD Million)
Table 56 France Terrestrial Laser Scanning Size, By Solution, 2016–2023 (USD Million)
Table 57 France Terrestrial Laser Scanning Size, By Terrestrial Laser Scanning System, 2016–2023 (USD Million)
Table 58 France Terrestrial Laser Scanning Size, By Terrestrial Laser Scanning Services, 2016–2023 (USD Million)
Table 59 Russia Terrestrial Laser Scanning Size, By Solution, 2016–2023 (USD Million)
Table 60 Russia Terrestrial Laser Scanning Size, By Terrestrial Laser Scanning System, 2016–2023 (USD Million)
Table 61 Russia Terrestrial Laser Scanning Size, By Terrestrial Laser Scanning Services, 2016–2023 (USD Million)
Table 62 Middle East Terrestrial Laser Scanning Size, By Solution, 2016–2023 (USD Million)
Table 63 Middle East Terrestrial Laser Scanning Size, By Terrestrial Laser Scanning System, 2016–2023 (USD Million)
Table 64 Middle East Terrestrial Laser Scanning Size, By Terrestrial Laser Scanning Services, 2016–2023 (USD Million)
Table 65 Middle East Terrestrial Laser Scanning Size, By Application, 2016–2023 (USD Million)
Table 66 Middle East Terrestrial Laser Scanning Size, By Country, 2016–2023 (USD Million)
Table 67 Saudi Arabia Terrestrial Laser Scanning Size, By Solution, 2016–2023 (USD Million)
Table 68 Saudi Arabia Terrestrial Laser Scanning Size, By Terrestrial Laser Scanning System, 2016–2023 (USD Million)
Table 69 Saudi Arabia Terrestrial Laser Scanning Size, By Terrestrial Laser Scanning Services, 2016–2023 (USD Million)
Table 70 UAE Terrestrial Laser Scanning Size, By Solution, 2016–2023 (USD Million)
Table 71 UAE Terrestrial Laser Scanning Size, By Terrestrial Laser Scanning System, 2016–2023 (USD Million)
Table 72 UAE Terrestrial Laser Scanning Size, By Terrestrial Laser Scanning Services, 2016–2023 (USD Million)
Table 73 Rest of the World Terrestrial Laser Scanning Size, By Solution, 2016–2023 (USD Million)
Table 74 Rest of the World Terrestrial Laser Scanning Size, By Terrestrial Laser Scanning System, 2016–2023 (USD Million)
Table 75 Rest of the World Terrestrial Laser Scanning Size, By Terrestrial Laser Scanning Services, 2016–2023 (USD Million)
Table 76 Rest of the World Terrestrial Laser Scanning Size, By Application, 2016–2023 (USD Million)
Table 77 Rest of the World Terrestrial Laser Scanning Size, By Country, 2016–2023 (USD Million)
Table 78 South America Terrestrial Laser Scanning Size, By Solution, 2016–2023 (USD Million)
Table 79 South America Terrestrial Laser Scanning Size, By Terrestrial Laser Scanning System, 2016–2023 (USD Million)
Table 80 South America Terrestrial Laser Scanning Size, By Terrestrial Laser Scanning Services, 2016–2023 (USD Million)
Table 81 Africa Terrestrial Laser Scanning Size, By Solution, 2016–2023 (USD Million)
Table 82 Africa Terrestrial Laser Scanning Size, By Terrestrial Laser Scanning System, 2016–2023 (USD Million)
Table 83 Africa Terrestrial Laser Scanning Size, By Terrestrial Laser Scanning Services, 2016–2023 (USD Million)
Table 84 Ranking of Key Players in Terrestrial Laser Scanning, 2017
List of Figures (26 Figures)
Figure 1 Terrestrial Laser Scanning Segmentation
Figure 2 Research Process Flow
Figure 3 Research Design
Figure 4 Data Triangulation Methodology
Figure 5 Terrestrial Laser Scanning Services Segment Anticipated to Lead Terrestrial Laser Scanning From 2018 to 2023
Figure 6 Phase Shift Scanner Segment Estimated to Lead Terrestrial Laser Scanning in 2018
Figure 7 Building Information Modeling (BIM)Segment Anticipated to Grow at Highest CAGR During Forecast Period
Figure 8 Asia Pacific Anticipated to Lead Terrestrial Laser Scanner Market From 2018 to 2023
Figure 9 Increasing Investments By Various Companies to Develop Fully Autonomous Ships is Driving Terrestrial Laser Scanner Market in Europe
Figure 10 Terrestrial Laser Scanning Services Segment to Lead Europe Terrestrial Laser Scanner Market in 2018
Figure 11 Terrestrial Laser Scanner Market Major Countries CAGR, From 2018 to 2023
Figure 12 Market Dynamics for the Terrestrial Laser Scanning
Figure 13 Global Installed Base for GNSS Devices (2012-2023)
Figure 14 Terrestrial Laser Scanning Services Solution Segment Projected to Grow at Highest CAGR During Forecast Period
Figure 15 Building Information Modeling (BIM) Segment Projected to Grow at Highest CAGR During Forecast Period
Figure 16 Pahse-Shift Scanner Type Segment of the Terrestrial Laser Scanning Projected to Grow at the Highest CAGR From 2018 to 2023
Figure 17 North America Estimated to Hold Largest Share of Terrestrial Laser Scanning in 2018
Figure 18 Asia Pacific Terrestrial Laser Scanning Snapshot
Figure 19 North America Terrestrial Laser Scanning Snapshot
Figure 20 Europe Terrestrial Laser Scanning Snapshot
Figure 21 Middle East Terrestrial Laser Scanning Market Snapshot
Figure 22 Companies Adopted New Product Launches as Key Growth Strategy Between June 2014 and October 2018
Figure 23 Hexagon Geosystems: Company Snapshot
Figure 24 Trimble: Company Snapshot
Figure 25 Teledyne Technologies: Company Snapshot
Figure 26 Faro Technologies: Company Snapshot
The study considered major activities to estimate the current market size for terrestrial laser scanning. Exhaustive secondary research was undertaken to collect information on the market, the peer market, and the parent market. The next step was to validate these findings, assumptions, and sizing with industry experts across the value chain through primary research. Both, top-down and bottom-up approaches were employed to estimate the complete market size. Thereafter, market breakdown and data triangulation procedures were used to estimate the market size of segments and subsegments.
Secondary Research
In the secondary research process, various secondary sources, such as D&B Hoovers, Bloomberg, BusinessWeek, and Terrestrial Laser Scanning Manufacturers, Land surveyor’s associations, different magazines were referred to identify and collect information for this study. Secondary sources included annual reports, press releases & investor presentations of companies, certified publications, articles by recognized authors, and terrestrial laser scanning databases.
Primary Research
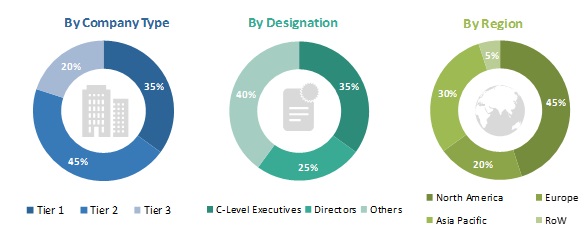
The terrestrial laser scanning market comprises several stakeholders, such as raw material suppliers, processors, end-product manufacturers, and regulatory organizations in the supply chain. The demand-side of this market is characterized by various end users, such as land surveyors as well as facility providers and leasing companies. The supply-side is characterized by advancements in terrestrial laser scanning technology, development of terrestrial laser scanning systems hardware, and software development. Various primary sources from both, the supply- and demand-sides of the market were interviewed to obtain qualitative and quantitative information. Following is the breakdown of primary respondents:
To know about the assumptions considered for the study, download the pdf brochure
Market Size Estimation
Both, top-down and bottom-up approaches were used to estimate and validate the total size of the terrestrial laser scanning market. These methods were also used extensively to estimate the size of various subsegments in the market. The research methodology used to estimate the market size includes the following:
- Key players in the industry and markets were identified through extensive secondary research.
- The industry’s supply chain and market size, in terms of value, were determined through primary and secondary research processes.
- All percentage shares, splits, and breakdowns were determined using secondary sources and verified through primary sources.
Data Triangulation
After arriving at the overall market size using the market size estimation processes as explained above—the market was split into several segments and subsegments. To complete the overall market engineering process and arrive at the exact statistics of each market segment and subsegment, data triangulation and market breakdown procedures were employed, wherever applicable. The data was triangulated by studying various factors and trends from both, the demand- and supply-sides, in the terrestrial laser scanning industry.
Report Objectives
- To identify and analyze key drivers, restraints, opportunities, and challenges influencing the growth of the terrestrial laser scanning market
- To analyze macro and micro indicators of the terrestrial laser scanning market
- To forecast the market size of segments based on 5 regions, including North America, Europe, Asia Pacific, the Middle East, and Rest of the World, along with major countries in each of these regions
- To strategically analyze micromarkets1 with respect to individual technological trends, prospects, and their contribution to the overall market
- To strategically profile key market players and comprehensively analyze their market shares and core competencies2
- To provide a detailed competitive landscape of the terrestrial laser scanning market, along with an analysis of business and corporate strategies such as joint ventures, acquisitions, and new product developments
- To identify detailed financial positions, key products, unique selling points, and key developments of leading companies in the terrestrial laser scanning market
Available Customizations
Along with the market data, MarketsandMarkets offers customizations according to the company’s specific needs.
Product Analysis
- Product matrix, which gives a detailed comparison of the product portfolio of each company
Company Information
- Detailed analysis and profiles of additional market players (up to 5)


Growth opportunities and latent adjacency in Terrestrial Laser Scanning Market