
Building Information Modeling Market Size, Share & Growth

Building Information Modeling Market Size, Share, Growth & Trends by Design & Modeling Software, Construction Simulation & Scheduling Software, Sustainability & Energy Analysis Software, Facility & Asset Management Software and Training & Certification - Global Forecast to 2030


BUILDING INFORMATION MODELING MARKET SIZE, SHARE & TRENDS
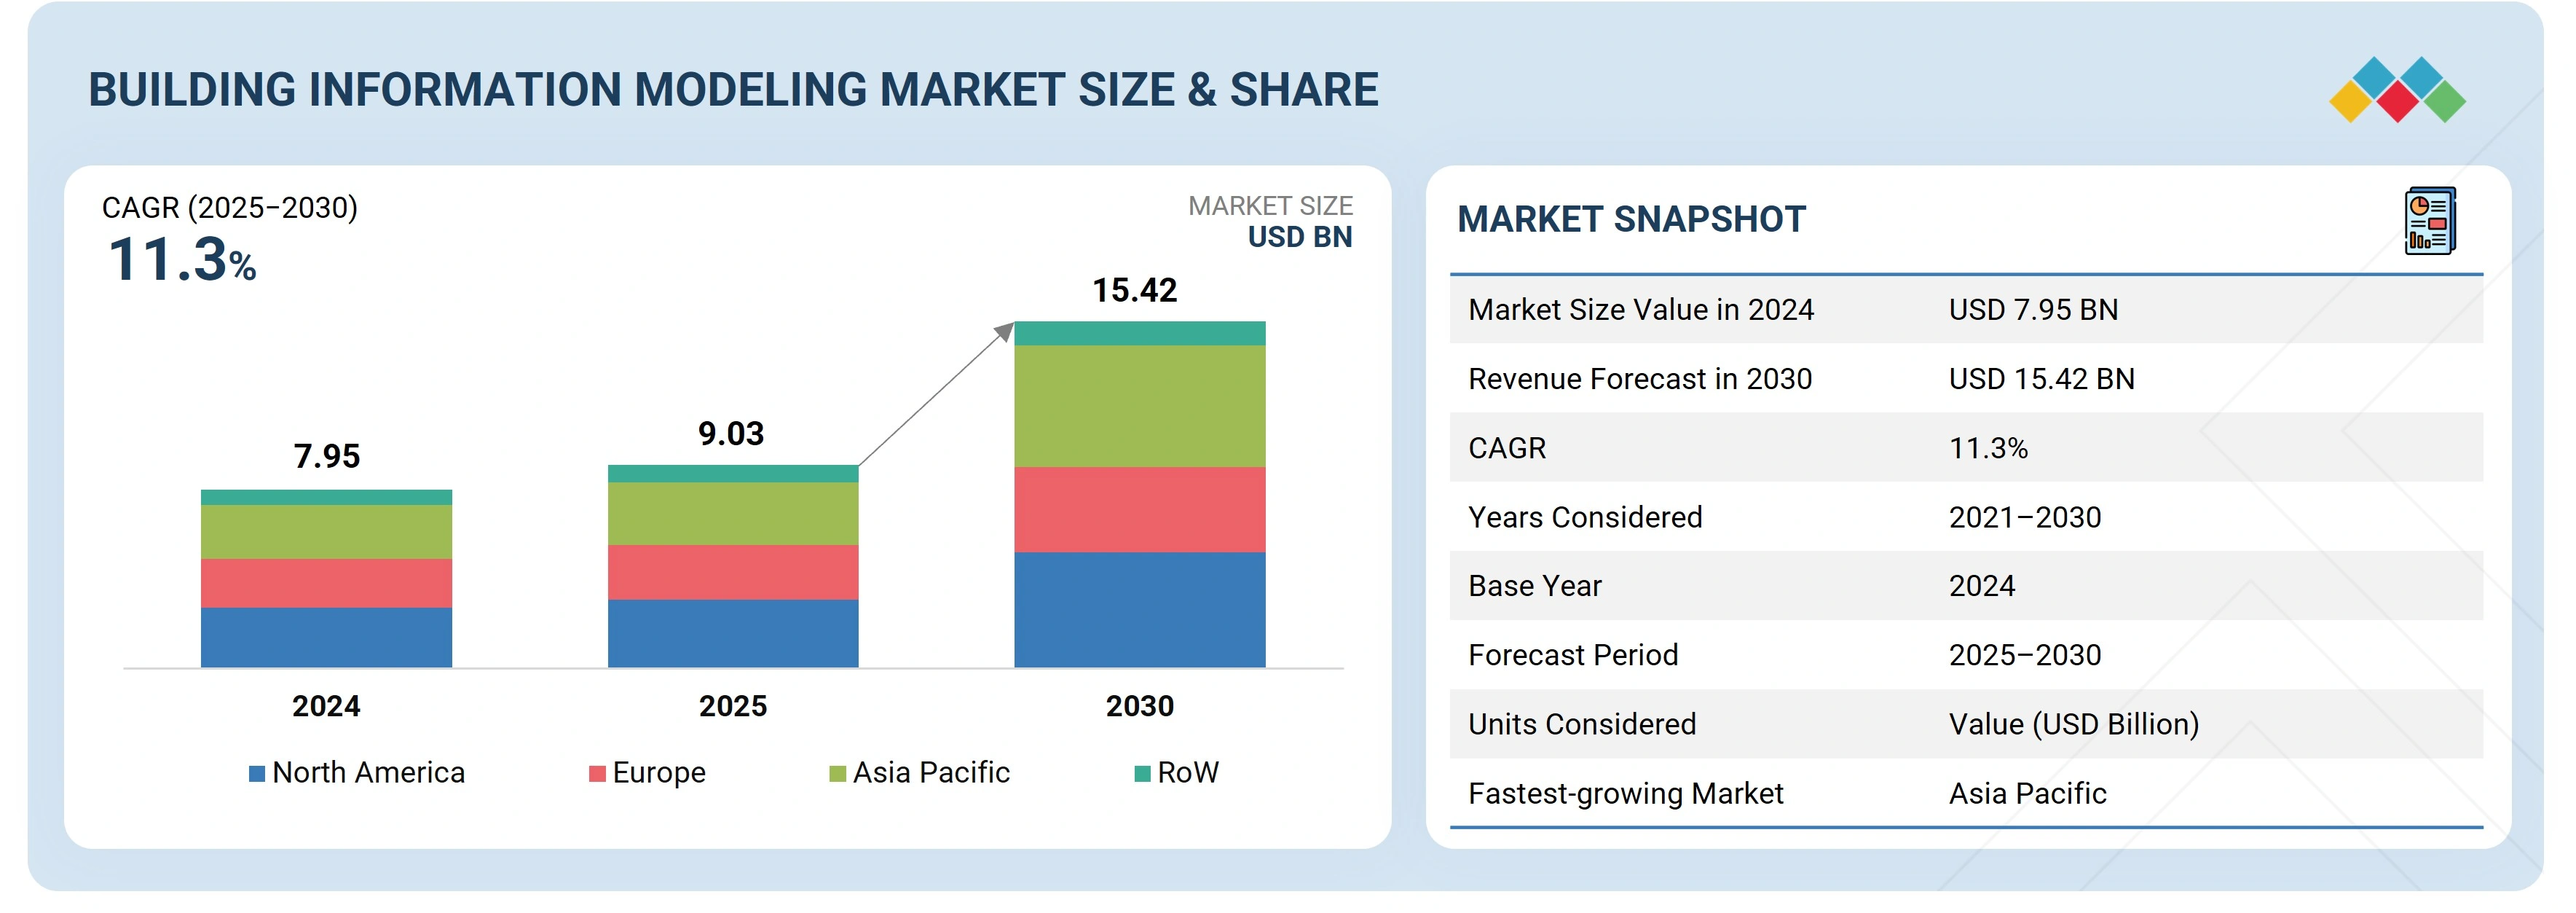
According to Marketsandmarkets, the global building information modeling market size was valued at USD 9.03 billion in 2025 and is projected to reach USD 15.42 billion by 2030, growing at a CAGR of 11.3% from 2025 to 2030. Rise in urbanization and infrastructure development globally, the growing adoption of digital twin technology to enhance lifecycle management, the growing emphasis on sustainability and green building certifications, and the need for real-time collaboration, improved efficiency, and project visualization across stakeholders drive the market during the forecast period.
The building information modeling market size is expanding steadily as the construction industry accelerates digital transformation and adopts advanced project management technologies. This expansion is driven by increasing urbanization, rising infrastructure development projects, and the growing need for efficient project visualization and collaboration among architects, engineers, and construction stakeholders. As adoption increases across commercial buildings, industrial facilities, and civil infrastructure projects, the building information modeling market share continues to expand globally. The rising demand for digital construction workflows is strengthening the overall building information modeling market size, positioning BIM technologies as a critical solution for improving design accuracy, cost efficiency, and lifecycle management in the construction sector.
Several evolving building information modeling market trends are shaping the future of the BIM ecosystem. The integration of BIM platforms with emerging technologies such as digital twins, artificial intelligence, cloud computing, and IoT is enhancing data-driven decision-making and improving project lifecycle management. Government mandates requiring BIM adoption for public infrastructure projects are also boosting the building information modeling market growth worldwide. In addition, the software segment continues to hold a dominant building information modeling market share, while BIM services such as training, implementation, and consulting are gaining momentum as organizations modernize their construction processes. With increasing adoption across North America, Europe, and rapidly developing Asia-Pacific economies, the BIM market size is expected to grow significantly in the coming years, reinforcing the importance of the building information modeling market size and strengthening the long-term outlook of the global BIM technology landscape.
MARKET SNAPSHOT TABLE
| REPORT METRIC | DETAILS |
|---|---|
| Market Size in 2025 (Value) | USD 9.03 Billion |
| Market Forecast in 2030 (Value) | USD 15.42 Billion |
| Growth Rate | CAGR of 11.3% from 2025–2030 |
| Years Considered | 2021–2030 |
| Base Year | 2024 |
| Forecast Period | 2025–2030 |
| Units Considered | Value (USD Billion) |
| Report Coverage | Revenue Forecast, Company Ranking, Competitive Landscape, Growth Factors, and Trends |
| Segments Covered | • Offering Type: Software and Services • Deployment Type: On-premises and Cloud • Project Lifecycle: Pre-construction, Construction, and Operation • Vertical: Buildings, Industrial, Civil Infrastructure, Oil & Gas, Utilities, and Other Verticals • End Use |
| Regional Scope | North America, Europe, Asia Pacific, and RoW |
| Top Companies |
|
| Growth Drivers |
|
Market Size & Forecast
BUILDING INFORMATION MODELING MARKET GROWTH KEY TAKEAWAYS
-
BY OFFERING TYPEBIM software leads the market, driven by demand for design, visualization, and simulation, while services are growing fast as firms seek implementation, training, and lifecycle support.
-
BY DEPLOYMENT TYPEOn-premises solutions remain preferred for security and compliance, whereas cloud adoption is accelerating due to scalability, collaboration, and remote access benefits.
-
BY PROJECT LIFECYCLEPre-construction drives BIM adoption through design optimization, construction leverages it for coordination and monitoring, and operations use it for facility management and digital twins.
-
BY VERTICALBuildings lead adoption due to high project volume, industrial and civil infrastructure are growing steadily, and oil & gas, utilities, and other verticals are gradually integrating BIM for efficiency and asset management.
-
BY END USERAEC professionals lead adoption for design, visualization, clash detection, and coordination, while consultants and facility managers leverage BIM for lifecycle management, maintenance planning, and digital twin integration.
-
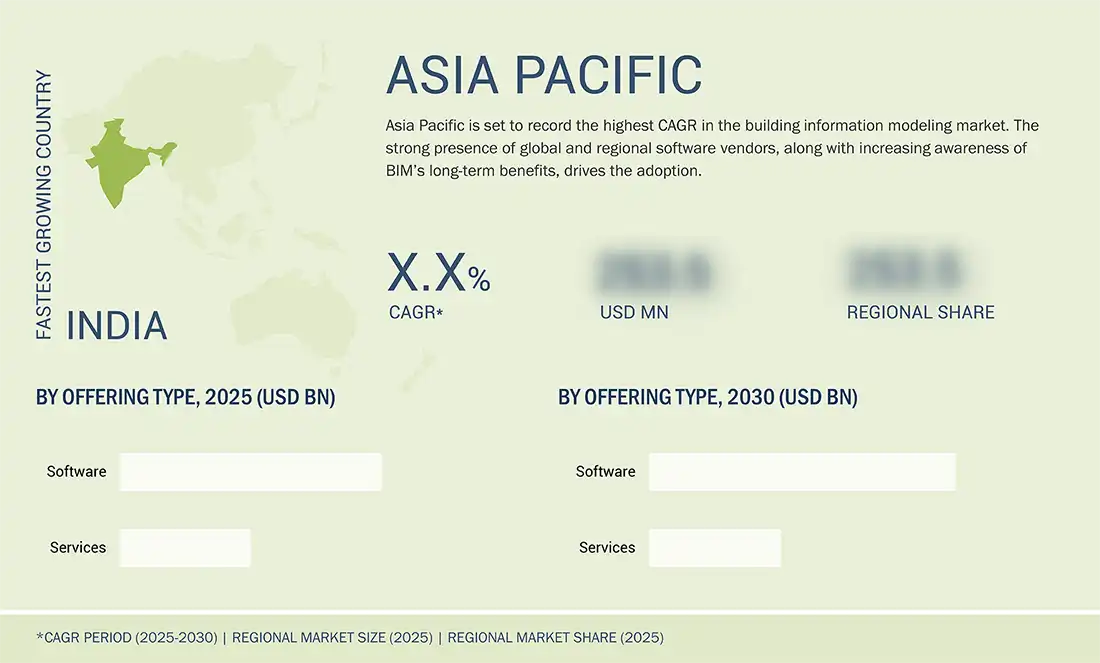
BY REGIONAsia Pacific is expected to register the highest CAGR in the buillding information modeling market, driven by rapid urbanization and large-scale infrastructure projects, strong government mandates promoting BIM adoption, and increasing integration with technologies such as AI, cloud, and data analytics to enhance project efficiency and collaboration.
-
COMPETITIVE LANDSCAPEMajor market players have adopted organic and inorganic strategies, including partnerships and agreements. For instance, Dassault Systèmes entered a five-year partnership with BoConcept, a global leader in affordable premium furniture, to deliver advanced 3D room design and product configuration experiences to BoConcept customers across 65 countries.
The global building information modeling market is witnessing strong growth, driven by increasing adoption across the architecture, engineering, and construction sectors to improve design accuracy, collaboration, and project efficiency. Key trends include the shift toward cloud-based solutions enabling real-time collaboration, the integration of BIM with emerging technologies, such as AI, IoT, and digital twins, and the growing emphasis on sustainability and green building practices. Additionally, government mandates and large-scale infrastructure projects accelerate adoption, while the rising demand for lifecycle management and facility operations solutions is further expanding market opportunities.
Source: Secondary Research, Interviews with Experts, MarketsandMarkets Analysis
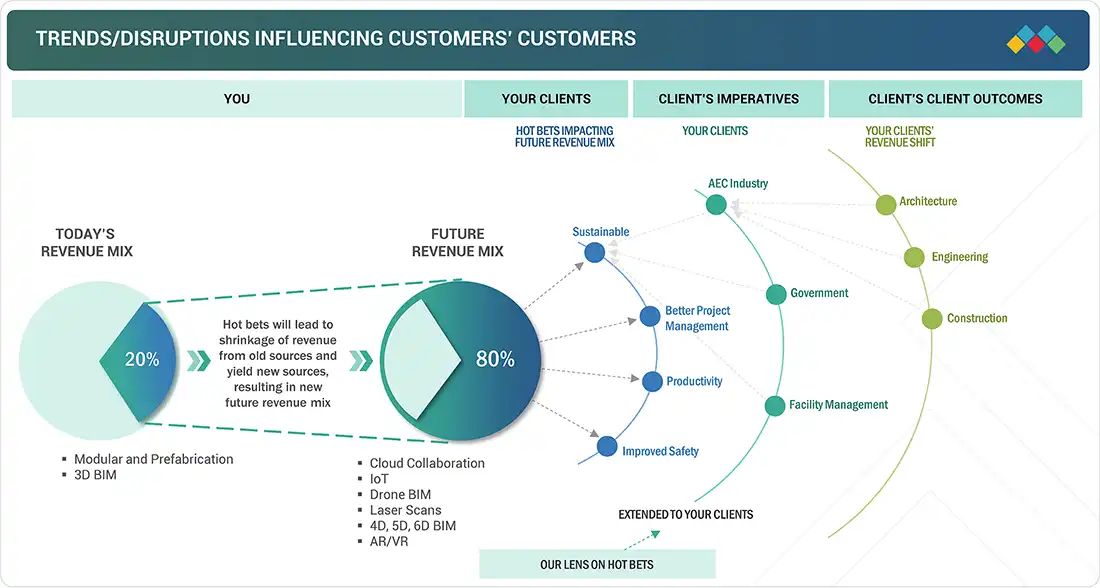
TRENDS & DISRUPTIONS IMPACTING CUSTOMERS' CUSTOMERS
Trends and disruptions, such as cloud collaboration, modular construction, AR/VR integration, drones, and laser scanning, are reshaping customer business in the building information modeling market, driving improved project efficiency, safety, and facility management while shifting revenue from traditional design services to digital and technology-enabled solutions.
Source: Secondary Research, Interviews with Experts, MarketsandMarkets Analysis
BUILDING INFORMATION MODELING MARKET SHARE DYNAMICS
Level
-
Rise in global urbanization and infrastructure development

-
Need for real-time collaboration, improved efficiency, and project visualization across stakeholders

Level
-
High initial implementation costs

-
Lack of skilled BIM professionals

Level
-
Convergence of AR/VR technologies with BIM workflows

-
Deployment of IoT to enhance BIM functionality in modern construction

Level
-
Hardware and infrastructure limitations in emerging markets

-
Lack of universal BIM standards across countries

Source: Secondary Research, Interviews with Experts, MarketsandMarkets Analysis
Driver: Need for real-time collaboration, improved efficiency, and project visualization across stakeholders
Successful implementation of contemporary, multidisciplinary building, and infrastructure projects relies heavily on good project visualization and stakeholder coordination. With numerous stakeholders, including architects, engineers, contractors, consultants, and customers, who may be working in different organizations and locations, projects are exposed to increased risk of miscommunication, misaligned decisions, and delays at a high cost. Conventional approaches such as 2D drawings and dispersed documentation cannot provide the transparency and real-time collaboration necessary to coordinate intricate, multi-phase developments. BIM overcomes these issues by offering a single, cloud-based platform where all stakeholders can view, edit, and verify a common 3D digital model.
Restraint: High initial implementation costs
One of the main hurdles of implementing building information modeling (BIM) technology is the initial cost of implementing a new process. These expenses typically involve software licensing fees, hardware upgrades, training personnel, cloud storage infrastructure, and consulting services. To traditional 2D drafting or CAD-based organizations, the move to a BIM environment can seem cost-deterrent, particularly when internal stakeholders are not in complete agreement on long-term return on investment.
Opportunity: Digital skill development programs supporting workforce readiness
As the architecture, engineering, and construction (AEC) industry undergoes digital transformation, a critical opportunity for BIM growth lies in the increasing investment in digital skill development and training programs. Academic institutions, private enterprises, and governments are recognizing the urgent need to build a digitally proficient workforce that can efficiently operate BIM platforms and workflows. These upskilling initiatives are designed to reduce implementation resistance, improve productivity, and enable consistent BIM adoption across small and large firms alike. By promoting BIM literacy in fields of design, planning, construction, and facilities management, these programs close the skill gap and build a scalable, future-proof workforce.
Challenge: Delayed digital integration within construction ecosystem
The construction industry remains one of the least digitized sectors globally, and this slow pace of digital adoption continues to hinder the widespread implementation of building information modeling (BIM). Many firms, especially in traditional markets, still rely on outdated methods, such as 2D drawings, paper-based documentation, and siloed project management tools, limiting BIM’s potential for model-based coordination, clash detection, and real-time data integration. This challenge is deeply rooted in legacy workflows, conservative organizational cultures, and a general resistance to change.
BUILDING INFORMATION MODELING MARKET SIZE, SHARE & GROWTH: COMMERCIAL USE CASES ACROSS INDUSTRIES
| COMPANY | USE CASE DESCRIPTION | BENEFITS |
|---|---|---|
 |
BIM software solutions (Revit, AutoCAD, and BIM 360) for architecture, engineering, and construction, enabling design, visualization, and project collaboration across all project phases | Streamlined design workflows, enhanced collaboration, improved project accuracy, and reduced errors across construction lifecycle |
 |
BIM-enabled construction and geospatial solutions, integrating site planning, surveying, and modular construction workflows | Increased field-to-office coordination, higher construction productivity, reduced rework, and better cost management |
 |
BIM tools (Allplan, Vectorworks) targeting architects, engineers, and planners for design, simulation, and project coordination | Improved design efficiency, better interdisciplinary collaboration, optimized resource allocation, and enhanced visualization capabilities |
 |
3DEXPERIENCE platform combining BIM with virtual twin, simulation, and lifecycle management for complex infrastructure projects | Enhanced project visualization, risk mitigation, lifecycle optimization, and support for sustainable and smart building initiatives |
 |
BIM and digital twin solutions for infrastructure projects, including civil engineering, utilities, and transportation | Better asset management, improved project monitoring, reduced operational costs, and accelerated delivery of large-scale infrastructure projects |
Logos and trademarks shown above are the property of their respective owners. Their use here is for informational and illustrative purposes only.
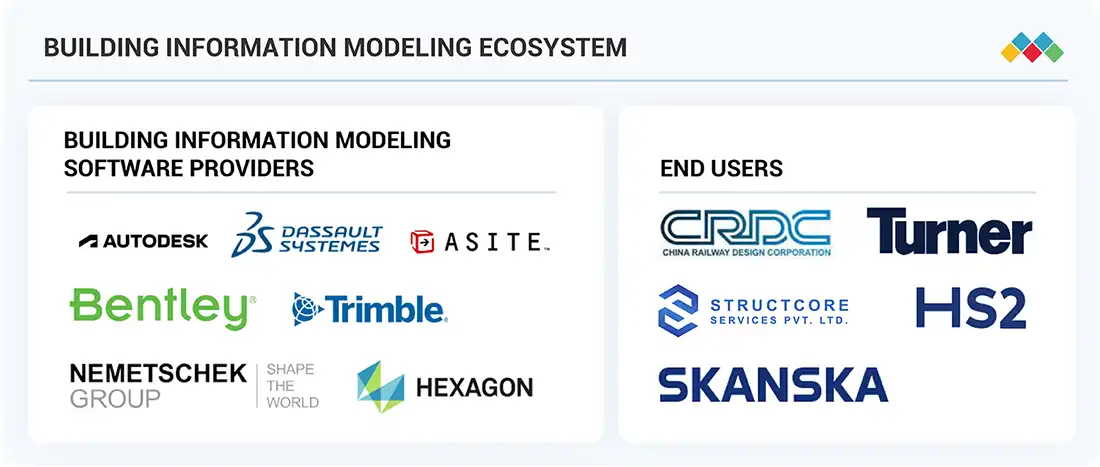
BUILDING INFORMATION MODELING MARKET ECOSYSTEM
The building information modeling ecosystem comprises software and service providers, along with end users, including AEC professionals, consultants, and facility managers. Software and services enable design, visualization, project coordination, and lifecycle management, while end users leverage these tools to enhance collaboration, improve project efficiency, and optimize operational outcomes throughout construction and infrastructure projects. This interconnected ecosystem drives innovation, adoption, and value creation across the entire project lifecycle.
Logos and trademarks shown above are the property of their respective owners. Their use here is for informational and illustrative purposes only.
BUILDING INFORMATION MODELING MARKET SHARE SEGMENTS
Source: Secondary Research, Interviews with Experts, MarketsandMarkets Analysis
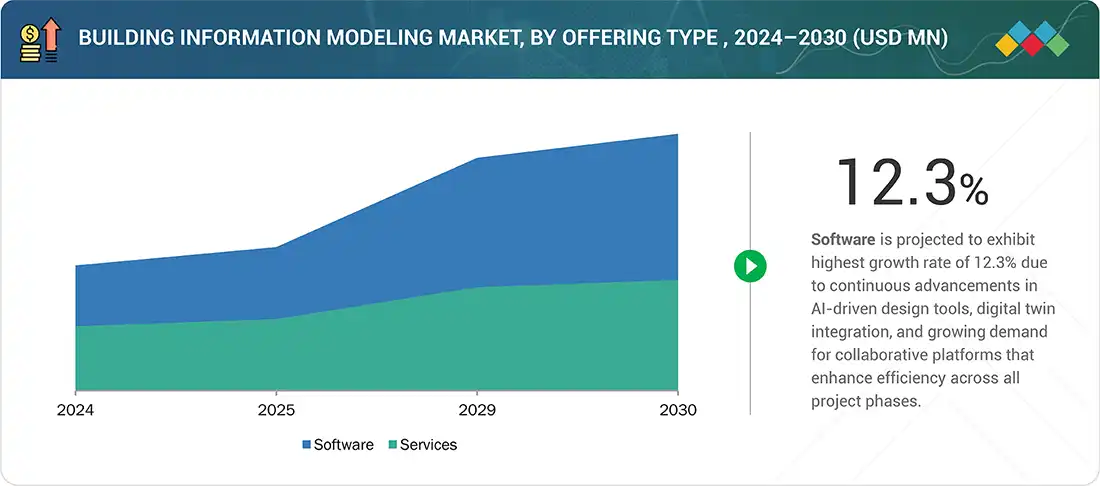
Building Information Modeling Market, by Offering Type
BIM software dominates the market as it forms the core of design, visualization, clash detection, and project coordination, making it indispensable for AEC professionals and driving recurring adoption across project lifecycles. Its integration with emerging technologies, including AI, cloud, and digital twins further strengthens its market position by enabling smarter, data-driven project decisions.
Building Information Modeling Market, by Project Lifecycle
The construction phase is expected to grow fastest due to increased adoption of BIM for real-time coordination, scheduling, cost management, and quality control, which directly improve on-site efficiency and reduce rework. Additionally, the push for faster project delivery and adherence to stringent safety and sustainability standards ccelerate BIM deployment during construction.
Building Information Modeling Market, by Deployment Type
On-premises solutions continue to lead as large enterprises and public projects prioritize data security, compliance with local regulations, and control over sensitive design and project data. Furthermore, many organizations prefer on-premises deployment for seamless integration with existing enterprise IT infrastructure and internal workflows.
Building Information Modeling Market, by End User
AEC professionals are expected to dominate the building information modeling market as they form the core user base—architects, engineers, and contractors rely on BIM for accurate design visualization, clash detection, and efficient project coordination. Their role in decision-making across the entire construction lifecycle drives the highest adoption rates compared to other stakeholders.
Building Information Modeling Market, by Vertical
Civil infrastructure is expected to exhibit the highest CAGR during the forecast period. Civil infrastructure projects are adopting BIM rapidly to manage large-scale, complex projects, such as highways, bridges, and utilities, where digital collaboration, lifecycle management, and risk mitigation significantly enhance project delivery and cost efficiency. The increasing focus on smart cities and sustainable infrastructure also drive the BIM adoption in this vertical.
BUILDING INFORMATION MODELING MARKET REGION
Asia Pacific to exhibit the fastest CAGR in the building information modeling market during the forecast period
Asia Pacific is projected to register the fastest CAGR in the building information modeling industry from 2025 to 2030, fueled by rapid urbanization, expanding infrastructure development, and increasing government mandates across the region. Countries such as China, India, Japan, South Korea, and Southeast Asian nations are witnessing a surge in large-scale construction projects, including smart cities, transportation networks, and energy infrastructure. To manage these complex projects more efficiently and cost-effectively, stakeholders are increasingly turning to BIM for better planning, coordination, and lifecycle management. Additionally, governments in the region are actively promoting digital construction practices. For instance, national BIM mandates and digital procurement frameworks are gaining momentum, especially in China, Singapore, and Australia.
The building information modeling (BIM) market in North America is expected to grow from USD 3.05 billion in 2025 to USD 5.17 billion by 2030, at a CAGR of 11.1% from 2025 to 2030. Rising investment in federal and state infrastructure programs, increasing adoption of digital twin and BIM-enabled lifecycle management, growing focus on sustainable and energy-efficient building practices, and the expanding need for real-time collaboration, productivity enhancement, and advanced project visualization across AEC stakeholders are some of the major drivers propelling the BIM market in North America during the forecast period.
The building information modeling market in Europe is expected to grow from USD 2.44 billion in 2025 to USD 3.78 billion by 2030, at a CAGR of 9.2% from 2025 to 2030. Rising investment in national and regional infrastructure programs, increasing adoption of digital twins and BIM-enabled lifecycle management, growing emphasis on sustainable and energy-efficient building practices, and the expanding need for real-time collaboration, standardized project delivery, and advanced model-based visualization across AEC stakeholders are some of the major drivers propelling the European BIM market during the forecast period.
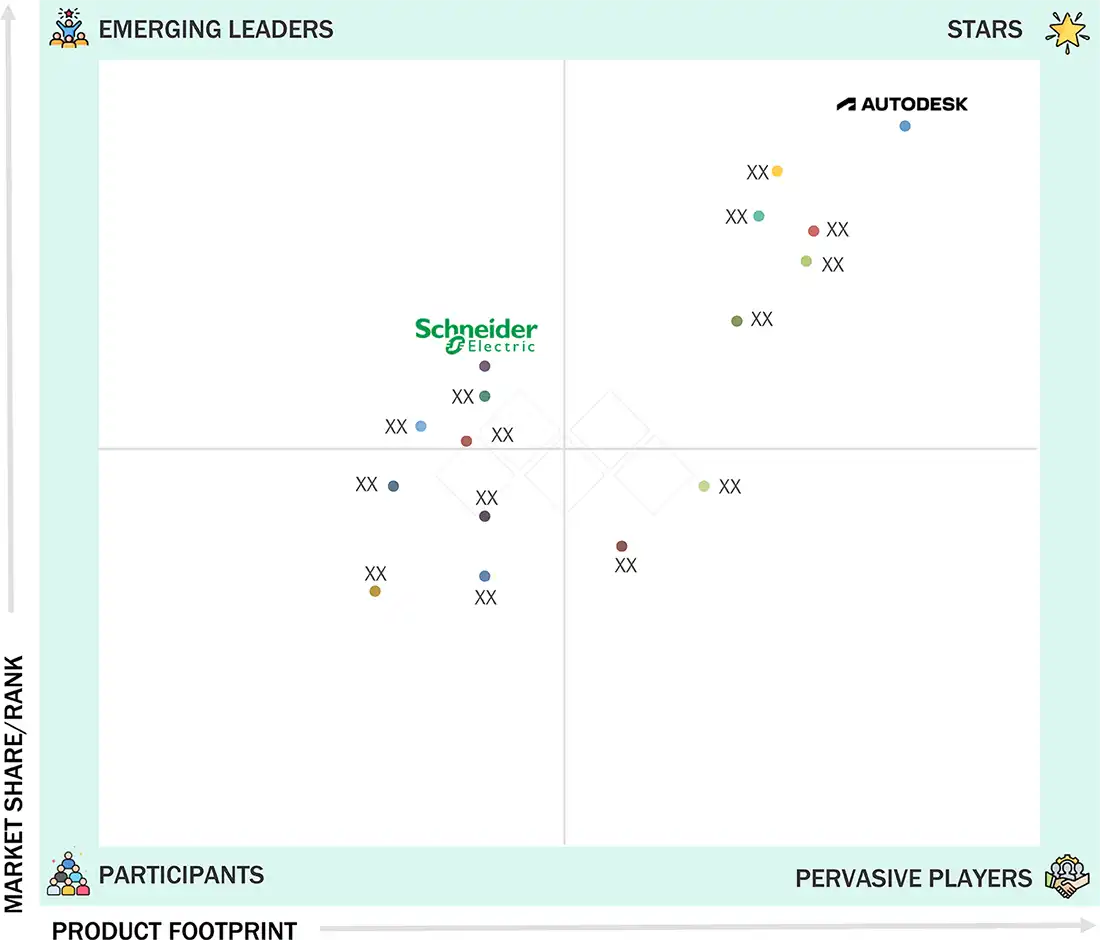
BUILDING INFORMATION MODELING MARKET SIZE, SHARE & GROWTH: COMPANY EVALUATION MATRIX
In the building information modeling companies, Autodesk is a star player with high market share and a broad product footprint, driving widespread adoption across AEC workflows, while Schneider Electric is an emerging leader with a relatively lower share than Autodesk but still significant, with focused offerings in building lifecycle and smart infrastructure, steadily expanding its presence.
Source: Secondary Research, Interviews with Experts, MarketsandMarkets Analysis
BUILDING INFORMATION MODELING MARKET KEY PLAYERS
WHAT IS IN IT FOR YOU: Building Information Modeling Market REPORT CONTENT GUIDE
DELIVERED CUSTOMIZATIONS
We have successfully delivered the following deep-dive customizations:
| CLIENT REQUEST | CUSTOMIZATION DELIVERED | VALUE ADDS |
|---|---|---|
| European Construction Firm | Competitive benchmarking of leading BIM software providers across architecture, engineering, and construction workflows | • Helped refine software selection strategy for large-scale projects • Identified differentiation in collaboration and lifecycle features |
| Global Engineering Consultant | Cost-benefit trade-off analysis between on-premises and cloud-based BIM deployments | • Optimized deployment strategy • Identified opportunities to reduce IT overhead and improve collaboration efficiency |
| Asia Pacific Contractor | Evaluation of BIM integration with modular and prefabricated construction processes | • Optimized sourcing strategy • Identified opportunities for localization and reduced supply chain risks |
| North American Government Agency | Assessment of BIM adoption roadmap in public infrastructure projects, including compliance mandates and digital twin integration | • Reduced implementation risks with clear adoption timelines • Supported strategic planning for smart city and infrastructure initiatives |
| Middle East Utility Company | Analysis of BIM-enabled asset management and facility maintenance for large-scale infrastructure | • Enhanced lifecycle management • Reduced downtime and operational costs while supporting sustainability goals |
RECENT DEVELOPMENTS
- June 2025 : Nemetschek Group partnered with Iowa State University’s Iowa Innovative Housing Project (also known as the 3D Affordable Innovative Technologies Housing Project) to help tackle the affordable housing shortage in Iowa. The initiative leverages 3D construction printing and other advanced methods to minimize construction risks, reduce material usage and waste, and provide resilient, sustainable, and cost-effective housing solutions. Iowa State University (US) leads the project.
- June 2025 : Dassault Systèmes entered a five-year partnership with BoConcept, a global leader in affordable premium furniture, to deliver advanced 3D room design and product configuration experiences to BoConcept customers across 65 countries.
- April 2025 : Trimble integrated its B2W Track and Trimble Siteworks software to streamline and automate progress quantity tracking for earthwork and civil contractors. This advanced field-to-office integration enables more accurate and efficient comparisons between planned and actual material production quantities. By continuously assessing field progress, civil contractors can make timely operational adjustments to safeguard profitability and ensure accurate billing as work is completed.
- January 2025 : Autodesk introduced customized design technology solutions tailored for the public sector in India. As part of this initiative, the company launched the ‘BIM Package for Viksit Bharat’, a specialized, ready-to-deploy Building Information Modelling (BIM) suite developed to support Indian engineers, architects, and policymakers, in alignment with the nation’s Viksit Bharat vision.
- December 2024 : Asite introduced a connector with Autodesk Construction Cloud, a suite of software and services that integrates advanced technology, a builder's network, and predictive insights for construction teams. This integration strengthens collaboration across project teams by allowing seamless, bi-directional exchange of construction documents between Asite and Autodesk Build or Autodesk Docs.
Table of Contents
 Exclusive indicates content/data unique to MarketsandMarkets and not available with any competitors.
Methodology
The study involved major activities in estimating the current market size for the building information modeling market. Exhaustive secondary research was done to collect information on the building information modeling industry. The next step was to validate these findings, assumptions, and sizing with industry experts across the value chain using primary research. Different approaches, such as top-down and bottom-up, were employed to estimate the total market size. After that, the market breakdown and data triangulation procedures were used to estimate the market size of the segments and subsegments of the building information modeling market.
Secondary Research
The secondary research for this study involved gathering information from a wide range of credible sources. These included company annual reports, investor presentations, press releases, whitepapers, certified publications, and articles from reputable associations and government publications. Additional data was obtained from corporate filings, professional and trade associations, journals, and industry-recognized authors. Research from consortia, councils, and gold- and silver-standard websites, directories, and databases also contributed to the qualitative framework. Key global sources such as the International Trade Centre (ITC) and the International Monetary Fund (IMF) were consulted to support and validate the market analysis.
Primary Research
Extensive primary research was conducted after understanding and analyzing the building information modeling market scenario through secondary research. Several primary interviews were conducted with key opinion leaders from demand- and supply-side vendors across four major regions—North America, Europe, Asia Pacific, and RoW. Approximately 20% of the primary interviews were conducted with the demand side and 80% with the supply side. Primary data was collected through questionnaires, e-mails, and telephonic interviews. Various departments within organizations, such as sales, operations, and administration, were contacted to provide a holistic viewpoint in the report.

To know about the assumptions considered for the study, download the pdf brochure
Market Size Estimation
Both top-down and bottom-up approaches were used to estimate and validate the total size of the building information modeling market. These methods were also used extensively to estimate the size of various subsegments in the market. The research methodology used to estimate the market size includes the following:
Building Information Modeling Market : Top-Down and Bottom-Up Approach

Data Triangulation
After arriving at the overall size of the building information modeling market through the process explained above, the overall market has been split into several segments. Data triangulation procedures have been employed to complete the overall market engineering process and arrive at the exact statistics for all the segments, wherever applicable. The data has been triangulated by studying various factors and trends from the demand and supply sides. The market has also been validated using top-down and bottom-up approaches.
Market Definition
Building information modeling (BIM) is a digital process that involves creating and managing intelligent 3D models to support the planning, design, construction, and operation of buildings and infrastructure. It integrates data-rich models with real-time collaboration, allowing AEC (architecture, engineering, and construction) professionals to make more informed decisions throughout the project lifecycle, enhancing efficiency, reducing rework, and improving cost and time outcomes.
Key Stakeholders
- Raw material suppliers
- Original equipment manufacturers (OEMs)
- Original design manufacturers (ODM)
- Research institutes
- Building information modeling solution providers
- Forums, alliances, and associations
- Governments and financial institutions
- Analysts and strategic business planners
- AEC Professionals
- Distributors
- End users
Report Objectives
- To describe and forecast the size of the building information modeling (BIM) market, in terms of offering type, deployment type, project lifecycle, vertical, and end user, in terms of value
- To describe and forecast the market size of various segments across four key regions—North America, Europe, Asia Pacific, and Rest of the World (RoW), in terms of value
- To provide detailed information regarding the drivers, restraints, opportunities, and challenges influencing the growth of the building information modeling market
- To provide an overview of the value chain pertaining to the building information modeling ecosystem and the average subscription prices of building information modeling solutions
- To provide a detailed overview of the impact of AI/Gen AI and the impact of the US 2025 tariff on the building information modeling market
- To provide information about the key technological trends, trade analysis, and patents related to the building information modeling market
- To benchmark the market players using the proprietary company evaluation matrix framework, which analyzes them on various parameters within the broad categories of market ranking/share and product portfolio
- To analyze competitive developments, such as partnerships, acquisitions, agreements, collaborations, and product launches
- To strategically profile key players and analyze their market share, ranking, and core competencies
Available customizations:
With the market data given, MarketsandMarkets offers customizations according to the company’s specific needs. The following customization options are available for the report:
Company Information
- Detailed analysis and profiling of additional market players (up to 7)
Key Questions Addressed by the Report
What is the current size of the global Building Information Modeling (BIM) market?
The global BIM market is valued at USD 9.03 billion in 2025 and is projected to reach USD 15.42 billion by 2030. (MarketsandMarkets)
What is the expected growth rate of the BIM market?
The BIM market is expected to grow at a CAGR of 11.3% from 2025 to 2030, driven by digital transformation across the construction industry. (MarketsandMarkets)
What are the major growth drivers for the BIM market?
Key growth drivers include rising urbanization, infrastructure development projects, adoption of digital twin technology, demand for sustainable buildings, and the need for real-time collaboration among architecture, engineering, and construction (AEC) stakeholders. (MarketsandMarkets)
Which offering segment holds the largest share of the BIM market?
BIM software holds the largest market share due to growing demand for design, visualization, simulation, and project planning solutions across construction projects. (MarketsandMarkets)
Which service segment is expected to grow the fastest?
Consulting & advisory services are projected to register the highest CAGR during the forecast period as organizations seek expertise for BIM implementation, compliance, training, and digital transformation initiatives. (MarketsandMarkets)
Which region leads the Building Information Modeling market?
North America is expected to hold the largest market share in 2025, supported by strong government mandates, advanced construction practices, and the presence of major BIM software providers. (MarketsandMarkets)
Which region is expected to witness the fastest growth?
Asia Pacific is forecast to register the highest CAGR through 2030 due to rapid urbanization, smart city projects, infrastructure investments, and increasing BIM mandates across countries such as China, India, Singapore, and Australia. (MarketsandMarkets)
What are the key trends shaping the BIM industry?
Major trends include cloud-based BIM adoption, integration with digital twins, artificial intelligence (AI), IoT-enabled construction management, sustainability-focused design, and lifecycle asset management solutions. (MarketsandMarkets)
Who are the leading companies in the BIM market?
Key players include Autodesk Inc., Nemetschek Group, Bentley Systems, Procore Technologies, Trimble Inc., Dassault Systèmes, and Schneider Electric. (MarketsandMarkets)
What is the future outlook for the Building Information Modeling industry?
The BIM industry is expected to experience robust growth through 2030 as governments promote digital construction, infrastructure investments increase, and organizations adopt AI-powered, cloud-enabled, and digital twin-integrated construction workflows. (MarketsandMarkets)
Need a Tailored Report?
Customize this report to your needs
Get 10% FREE Customization
Customize This ReportPersonalize This Research
- Triangulate with your Own Data
- Get Data as per your Format and Definition
- Gain a Deeper Dive on a Specific Application, Geography, Customer or Competitor
- Any level of Personalization
Let Us Help You
- What are the Known and Unknown Adjacencies Impacting the Building Information Modeling Market
- What will your New Revenue Sources be?
- Who will be your Top Customer; what will make them switch?
- Defend your Market Share or Win Competitors
- Get a Scorecard for Target Partners

Custom Market Research Services
We Will Customise The Research For You, In Case The Report Listed Above Does Not Meet With Your Requirements
Get 10% Free CustomisationTESTIMONIALS

Tetsuya Ohhira
Business Development Manager-Technology Business
Nikon Corporation,
Leading Japanese MNC specializing in optics and imaging productswww.nikon.com
MarketsandMarkets™ response
is quick. Their attitude is flexible and positive. Analyst Insights are globally considered and
significant. Client Services quickly respond to our inquiry and demand. Their wide range of global
surveys help us make our strategic plan.
We hope Knowledge Store will be easier to search
for a report.
VP - Marketing & Business Development
Leading Provider of Process Control Solutions
We engaged with MarketsandMarkets on a study to perform an analysis and recommend a Go-To-Market strategy for metrology and process control in the semiconductor market. The study was tailored to our targets and needs with well-defined milestones. Our overall experience with the MarketsandMarkets team was very good throughout the project in all aspects including the analysis methodologies used, the quality and depth of primary and secondary data sets, the professionalism and flexibility of the team and the ability to meet the target schedule and milestones. We want to thank MarketsandMarkets team for a job well done.
- North America Building Information Modeling Market
- Europe Building Information Modeling Market
- Asia Pacific Building Information Modeling Market
- Rest of World Building Information Modeling Market
- Software Building Information Modeling Market
- Services Building Information Modeling Market
- Middle East Building Information Modeling Market
- US Building Information Modeling Market
- Canada Building Information Modeling Market
- Mexico Building Information Modeling Market
- UK Building Information Modeling Market
- Germany Building Information Modeling Market
- France Building Information Modeling Market
- Italy Building Information Modeling Market
- Spain Building Information Modeling Market
- Poland Building Information Modeling Market
- China Building Information Modeling Market
- Japan Building Information Modeling Market
- India Building Information Modeling Market
- South Korea Building Information Modeling Market
- Australia Building Information Modeling Market
- Indonesia Building Information Modeling Market
- Malaysia Building Information Modeling Market
- Thailand Building Information Modeling Market
- Vietnam Building Information Modeling Market
- Nordics Building Information Modeling Market
- Rest Of Europe Building Information Modeling Market
- Rest Of Asia Pacific Building Information Modeling Market
- Bahrain Building Information Modeling Market
- Kuwait Building Information Modeling Market
- Oman Building Information Modeling Market
- Qatar Building Information Modeling Market
- Rest Of Middle East Building Information Modeling Market
Growth opportunities and latent adjacency in Building Information Modeling Market


Salim
Jul, 2019
Hi, we need a sample brochure of this study and eagerly interested to have key insight discussion with your team..
Soumen
Jun, 2019
We provides BIM services globally. we need some of clients so, we are looking for someone who will marketing our services in USA..
Chris
Apr, 2026
What are the key drivers accelerating the adoption of BIM in global infrastructure and urban development?.
Jacob
Apr, 2026
How does Digital Twin technology enhance BIM for lifecycle management and smart buildings?.
Edward
Apr, 2026
What are the different types of BIM software and deployment models (cloud vs on-premises)?.
Olga
Feb, 2019
To understand the level of BIM development in the world and receive the real numbers of use in the market..
Paolo
Sep, 2017
Software market valuations for construction commercial real estate, with a specific focus on warehouses, flex space, and offices..
Nishi
Sep, 2019
In a construction project completed in 2025, multiple stake folders are considering using a common platform. We need an investigation for that..
Miikka
Apr, 2015
What EMEA Emerging countries are included? Please respond including price to email, and methods to buy..
Purushothaman
Feb, 2015
I am looking forward for developing a BIM based service provider company. I hope this brochure useful for me..
Elise
Aug, 2019
Good day! I am looking into figures on global acceptance and usage of BIM, forecasted global growth, percentage of growth it has brought to users and hindrances on adoption from consumers' perspective, all under the global area of focus..
Kyoko
Jun, 2018
I am seeking Data on the market size of Japan. Analysis regarding Japan is included on the Appendix, can you send me the sample data to confirm..
karina
Mar, 2019
I am student from Brazil, doing a Master Degree in Project Management. As I am researching about BIM for my conclusion these, this study is very important to my work. Please, send me a free PDF, in order to support my research project..
Rui
Sep, 2019
I am participating as an invited speaker in a Master in BIM. During my speak, I will point to some BIM software in the market. It could be interesting to give pupils an insight of the market share of each software..
Richard
May, 2017
Interested in the global growth in key markets. Also, I Would like to see what the report contains on UK..
Michael
Jun, 2018
Hi, Does this report contain market share of Revit vs. other programs for Architects + AECs generally in the United States?.
Shwan
Nov, 2015
Role of BIM in improving and re-culturing the construction industry and the positive economics rewards and ROI's..
Eduardo
Jul, 2019
Learning more about the latest trends about BIM and how its making a big impact on todays modern world and what are the upcoming industry trends, which will drive this market?.
Robin
Dec, 2019
I am requesting to get brochure for the BIM market..
Robin
Dec, 2019
Just trying to get a sense of the size of the BIM market.
Robin
Dec, 2019
Which are the top players involved in this ecosystem..
Robin
Dec, 2019
What are the new upcoming trends for the growth of this market..
Robin
Dec, 2019
Which region along with country is dominating the BIM market and what are the major trends for the growth?.
Robin
Dec, 2019
Please send us the sample brochure for the report..
Robin
Dec, 2019
Which application are will dominate the Bim market by 2024 or 2025, and what the driving factors for the same?.
Robin
Dec, 2019
Total revenue share from BIM-software companies can generate revenue by targeting which customers?.
Tanishq
Dec, 2024
I need the name of Architecture consultants from North America who are using BIM and outsourcing BIM Services .
zhaoxing
Oct, 2018
Integration issue of BIM industry is the very important facts, we want to discuss many things related to Bim market and also will give me more information for the same. Before this, please send us the summary and scope of the report. .
Chittepelly
Oct, 2022
To track down the overview of BIM industry globally and find opportunities for it in india .
Mizuho
Sep, 2018
I would like to know how much detailed information it contains for Building Information Modeling Market by Geography..
Ketan
Aug, 2019
We are searching for the future market in BIM. We want to know that which are the dominant players present in this market and share captured by them in this market..
Josh
Jul, 2019
I am seeking access to this report as I am currently writing my thesis and would greatly benefit from the access to this report..
Lucas
Jul, 2015
I'm developing a website to boost BIM negotiations around the world and I need the information of this article to measure the market that I'm getting into..
Dhruv
May, 2019
We are planning for a startup specializing in providing AEC services in the Asian Countries. Thus, we are interested in this report to have a better understanding of the market which would eventually help us in preparing an efficient business plan. .
Zdenka
May, 2015
Hi, I would like to know what type of info is available for UK and also split for all industry/user types. Would you be able to provide some older data on UK as % of global and UK user group / industry split? Can the updated actuals + forecasts be purchased separately?.
Richard
Mar, 2015
The geographic analysis is most important to me. I'm putting together an EU funding application and it would be good to be able to state what size the different markets were..
Heather
Feb, 2019
I would like to schedule a briefing with analysts of Building Information Modeling (BIM) report regarding ViZZ (https://www.vizz3d.com/), a transformative virtualization platform that brings to life data from various sources, creating immersive, experiential models that allow contractors, developers, prospective buyers, and investors to interact and walk-through them..