Textile Dyes Market by Dye Type (Direct, Reactive, VAT, Basic, Acid, Disperse), Type (Cellulose, Protein, Synthetic), Fiber Type (Wool, Nylon, Cotton, Viscose, Polyester, Acrylic) and Region (APAC, North America, Europe) - Global Forecast to 2027
Updated on : September 02, 2025
Textile Dyes Market
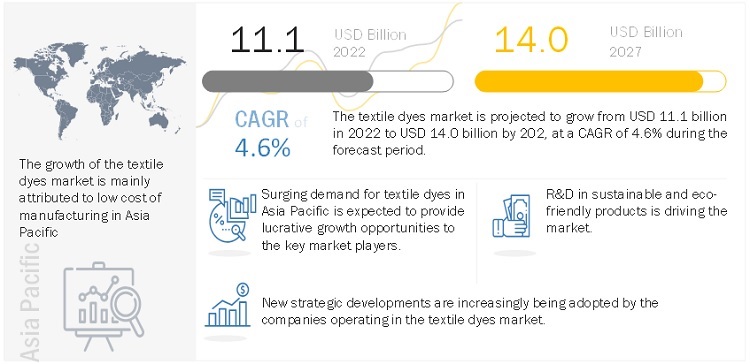
The global textile dyes market was valued at USD 11.1 billion in 2022 and is projected to reach USD 14.0 billion by 2027, growing at 4.6% cagr from 2022 to 2027. Growing use of textile dyes in diverse industries, rising urbanized population, and increased demand in garment industry are driving the demand for textile dyes. The market for textile dyes is experiencing phenomenal growth owing to various factors that are interrelated with each other. The rapid growth in fashion and apparels sector is one of the largest consumers of textiles that requires different and new colors and designs in a very short time due to fluctuations in fashion trends and customer preferences. It also helps this trend that methods of dye application have been improved over recent years by developments in technology such as digital printing and innovative approaches to dyeing. As well, fast urbanization, and constant improvements in the disposable income in developing countries in the Asia-Pacific and Latin America regions drive demand for textiles. This economic growth helps the middle class to look for various and quality textiles products which in return enhances the demand for textile dyes. Moreover, the demand for curtains, uphosery and bedding has increased due to which people have an inclination towards having a number of options and varieties in dyes which also provide propulsion to the market. These often make the market for textile dyes quite responsive to change, a feature attributed to consumers’ behaviors, advancements in technology and general economic progress.
Attractive Opportunities in the Textile Dyes Market
Note: e – estimated, p - projected
Source: Expert Interviews, Secondary Sources, and MarketsandMarkets Analysis
To know about the assumptions considered for the study, Request for Free Sample Report
Textile Dyes Market Dynamics
Driver: Low cost of manufacturing in Asia Pacific countries
The manufacturing sector is considered to be central to a country’s economic development. Low-cost manufacturing played a huge role in making China the second-largest economy in the world. Since then, China’s transition from low-cost manufacturer to high-tech product manufacturer is encouraging other countries to move into low-cost production.
Textile is one of the most important industries in terms of the manufacturing of end-products. Any changes in external factors, such as production cost, in this industry will directly impact the textile dyes market. There has been a trend of shifting of production units from the western region to Asia Pacific to achieve lower cost of production. It is expected to drive the market for textile dyes in Asia Pacific countries
Restraint: Stringent environmental regulations regarding disposal of textile effluents
Chemical processing accounts for around 70% of the pollution produced by the textile industry's numerous activities. Cotton mills are well recognised for using a lot of water for various operations like size, desizing, scouring, bleaching, mercerization, dyeing, printing, finishing, and finally washing. Large amounts of waste water containing numerous contaminants are discharged due to the nature of diverse chemical textile manufacturing. Because these streams of water have a variety of effects on the aquatic eco-system, such as lowering dissolved oxygen levels or settling suspended particles in anaerobic conditions, they require specific attention. These stringent regulations are making companies focus on developing products that restrict their market operations and necessitate more R&D spending on new products/better technology which are environmentally-friendly and sustainable.
Opportunity: Growing adoption of biodegradable materials for textile manufacturing
Under the strict pressure of governments, non-governmental organizations, and end-users, textile dye manufacturers and suppliers are increasingly being forced to supply dyestuff that are sustainably produced and are free of hazardous chemicals. The growing concerns regarding the environmental impact of textile dye industry is pushing towards biodegradable materials.
Challenge: Overcapacity of dyestuffs
The dyestuff industry is highly dependent on the textile industry as 60 to 65% of the dyes are directly used in textiles. The downturn in the textile industry has affected the growth of the dyestuff industry. In addition, the global production of dyestuffs has surpassed the demand, thus creating a demand-supply imbalance. The decrease in demand for dyestuffs has increased the pressure on the dyestuff industry as it has become difficult to acquire the required profit margins. The dyes industry is slowly shifting from developed countries to developing countries such as India and China. Thus, the production of dyes is increasing in these countries. However, there is a supply and demand gap, which is a major challenge affecting the growth of the market.
“Reactive dye segment is projected to grow at the highest CAGR during the forecast period.”
Reactive dyes are versatile, more technically advanced and reduce usage of water for the dyeing process. Reactive dyes are high in demand and are the fastest growing segment. The demand is pushed due to their low price as well.
“Viscose is projected to grow at the highest CAGR during the forecast period.”
Sustainability has become a hot topic in the fashion business in recent years. Consumers are also becoming more concerned of the environment when making purchases.
Due to increased desire for natural fibers and affordable clothes, clothing manufactured from man-made cellulosic fibres suh as viscosehas lately regained popularity. Along with the growing desire for natural fibers, there is a push for materials that are responsibly sourced and produced.
Forest certificates are becoming more common among man-made cellulosic fibre companies around the world, ensuring consumers that the cellulose used in viscose production comes from sustainably managed forests.
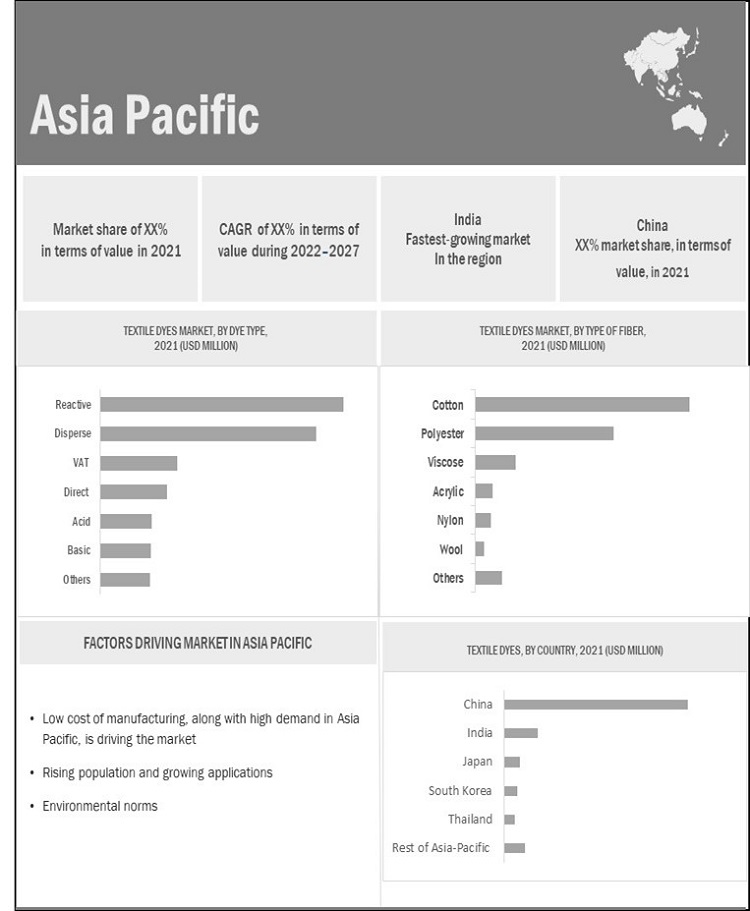
Asia Pacific is projected to be the largest and the fastest-growing textile dyes market.
The Asia Pacific is the largest and fastest growing market. The growth is driven by less stringent regulations, cheap labour, high population and urbanization.
To know about the assumptions considered for the study, download the pdf brochure
Textile Dyes Market Players
The key players of textile dyes as Atul Ltd. (India), Kiri industries (India), Huntsman Corporation (US), LANXESS AG (Germany), Zhejiang Longsheng Group Co. Ltd (China), Zhejiang Jihua Group (China), Zhejiang Runtu Co. Ltd. (China), Jay Chemicals (India). Huntsman Corporation is one of the largest textile dyes companies. The company has a strong worldwide presence. It has a diversified product portfolio to cater to number of end-use industries. To sustain its dominating position, the company may enter into new industries and target new markets.
Textile Dyes Market Report Scope
|
Report Metric |
Details |
|
Market Size Value in 2021 |
USD 10.7 billion |
|
Revenue Forecast in 2027 |
USD 14.0 billion |
|
CAGR |
4.6% |
|
Years considered for the study |
2017–2027 |
|
Base year |
2021 |
|
Forecast period |
2022–2027 |
|
Units considered |
Value (USD) and Volume (Kiloton) |
|
Segments |
Fiber Type, dye type, and Region |
|
Regions |
APAC, North America, Europe, South America, and Middle East & Africa |
|
Companies |
Huntsman Corporation (US), Atul Ltd. (India), Kiri Industries (India), Lanxess AG (Germany), Zhejiang Longsheng Group Co. Ltd. (China), Zhejiang Jihua Group (China), Zhejiang Runtu Co. Ltd. (China). |
This research report categorizes the textile dyes market based on Fiber Type, Dye Type, and Region.
On the basis of fiber type, the textile dyes market is segmented as follows:
- Wool
- Nylon
- Cotton
- Viscose
- Polyester
- Acrylic
- Others
On the basis of dye type, the textile dyes market is segmented as follows:
- Direct
- Reactive
- VAT
- Basic
- Acid
- Disperse
- Others
On the basis of region, the textile dyes market is segmented as follows:
- APAC
- North America
- Europe
- South America
- Middle East & Africa
Recent Developments
- In January 2022, Atul Ltd. launched NOVATIC Classic Dark Green Pdr VAT dyes and NOVATIC Classic Dark Navy Pdr VAT dyes for institutional wear, leisure wear, and furnishings.
- In October 2020, Huntsman Textile Effects and Phong Phu International (PPJ) entered in a strategic partnership agreement that aims to promote PPJ’s growth in Vietnam as a leading manufacturer of sustainable, high-performance textiles and garments for many of the world’s leading brands and retailers.
- In January 2021, Kiri Industries has started the first phase of commercial production of Specialty Intermediates at its plant located in Vadodara
Frequently Asked Questions (FAQ):
What are the factors influencing the growth of textile dyes?
The global textile dyes market is driven by the low cost of manufacturing in Asia Pacific countries.
What are the major applications for textile dyes?
The major applications of textile dyes are in dying fibres such as Nylon, silk, wool, viscose, cotton.
Who are the major manufacturers?
Huntsman Corporation (US), Zhejiang Longsheng Group (China), Archroma Management (Switzerland), Kiri Industries (India), Lanxess AG (Germany) are some of the leading players operating in the global textile dyes market.
Why textile dyes are gaining market share?
The growth of the textile dyes market is mainly attributed to the increasing investments made by global textile dyes companies across all regions. .
To speak to our analyst for a discussion on the above findings, click Speak to Analyst

TABLE OF CONTENTS
1 INTRODUCTION (Page No. - 28)
1.1 OBJECTIVES OF THE STUDY
1.2 MARKET DEFINITION
1.3 MARKET INCLUSIONS AND EXCLUSIONS
1.4 MARKET SCOPE
1.4.1 REGIONAL SCOPE
1.4.2 YEARS CONSIDERED FOR THE STUDY
1.5 CURRENCY
1.6 UNIT CONSIDERED
1.7 STAKEHOLDERS
1.8 SUMMARY OF CHANGES
2 RESEARCH METHODOLOGY (Page No. - 33)
2.1 RESEARCH DATA
FIGURE 2 TEXTILE DYES MARKET: RESEARCH DESIGN
2.1.1 SECONDARY DATA
2.1.1.1 Key data from secondary sources
2.1.2 PRIMARY DATA
2.1.2.1 Key primary data sources
2.1.2.2 Key data from primary sources
2.1.2.3 Key industry insights
2.1.2.4 Breakdown of primary interviews
2.2 MARKET SIZE ESTIMATION
2.2.1 TOP-DOWN APPROACH
FIGURE 3 TEXTILE DYES MARKET SIZE ESTIMATION: TOP-DOWN APPROACH
FIGURE 4 MARKET SIZE ESTIMATION: SUPPLY-SIDE
FIGURE 5 MARKET SIZE ESTIMATION: TEXTILE DYES MARKET
FIGURE 6 TEXTILE DYES MARKET BY REGION
FIGURE 7 TEXTILE DYE MARKET BY FIBER TYPE
FIGURE 8 TEXTILE DYES MARKET BY TYPE
2.3 MARKET FORECAST APPROACH
2.3.1 SUPPLY-SIDE FORECAST
2.3.2 DEMAND-SIDE FORECAST PROJECTION
2.4 FACTOR ANALYSIS
2.5 DATA TRIANGULATION
FIGURE 9 TEXTILE DYES MARKET: DATA TRIANGULATION
2.6 ASSUMPTIONS
2.7 RISK ANALYSIS ASSESSMENT
2.8 LIMITATIONS
2.9 GROWTH RATE ASSUMPTIONS/GROWTH FORECAST
3 EXECUTIVE SUMMARY (Page No. - 45)
TABLE 1 TEXTILE DYES MARKET SNAPSHOT, 2022 VS. 2027
FIGURE 10 ASIA PACIFIC TO DOMINATE TEXTILE DYES MARKET BETWEEN 2022 AND 2027
FIGURE 11 DISPERSE DYES TO BE LARGEST SEGMENT OF TEXTILE DYES MARKET BETWEEN 2022 AND 2027
FIGURE 12 COTTON FIBER TO BE LARGEST SEGMENT OF TEXTILE DYES MARKET BETWEEN 2022 AND 2027
FIGURE 13 ASIA PACIFIC ACCOUNTED FOR LARGEST MARKET SHARE IN 2021
TABLE 2 KEY PLAYERS PROFILED IN THE REPORT
4 PREMIUM INSIGHTS (Page No. - 50)
4.1 ATTRACTIVE OPPORTUNITIES IN TEXTILE DYES MARKET
FIGURE 14 TEXTILE DYES MARKET TO WITNESS MODERATE GROWTH BETWEEN 2022 AND 2027
4.2 TEXTILE DYES MARKET, BY DYE TYPE
FIGURE 15 REACTIVE DYES TO BE FASTEST-GROWING SEGMENT OF TEXTILE DYES MARKET
4.3 ASIA PACIFIC TEXTILE DYE MARKET, BY DYE TYPE AND COUNTRY
FIGURE 16 DISPERSE DYE TYPE AND CHINA ACCOUNTED FOR LARGEST SHARE IN ASIA PACIFIC TEXTILE DYES MARKET IN 2021
4.4 OVERVIEW OF GLOBAL TEXTILE DYES MARKET
FIGURE 17 INDIA TO EMERGE AS LUCRATIVE MARKET FOR TEXTILE DYES DURING FORECAST PERIOD
4.5 TEXTILE DYE MARKET: DEVELOPED VS. DEVELOPING COUNTRIES
FIGURE 18 DEVELOPING ECONOMIES TO GROW FASTER THAN DEVELOPED ECONOMIES
4.6 TEXTILE DYES MARKET: GROWING DEMAND FROM ASIA PACIFIC
FIGURE 19 CHINA TO ACCOUNT FOR LARGEST MARKET SHARE DURING FORECAST PERIOD
5 MARKET OVERVIEW (Page No. - 53)
5.1 INTRODUCTION
5.2 MARKET DYNAMICS
FIGURE 20 DRIVERS, RESTRAINTS, OPPORTUNITIES, AND CHALLENGES IN THE TEXTILE DYES MARKET
5.2.1 DRIVERS
5.2.1.1 Low cost of manufacturing in Asia Pacific countries
5.2.1.2 High demand for textile dyes in Asia Pacific
5.2.1.3 Rising demand in growing textiles & apparel industry
5.2.1.4 Increasing trend towards better home furnishing and aesthetics
5.2.2 RESTRAINTS
5.2.2.1 Stringent environmental regulations regarding disposal of textile effluents
5.2.2.2 Unstable geopolitical situations
5.2.3 OPPORTUNITIES
5.2.3.1 Renewed interest in low-VOC and eco-friendly products
5.2.3.2 Growing adoption of biodegradable materials for textile manufacturing
5.2.4 CHALLENGES
5.2.4.1 Overcapacity of dyestuffs
5.3 PORTER’S FIVE FORCES ANALYSIS
FIGURE 21 PORTER’S FIVE FORCES ANALYSIS: TEXTILE DYES MARKET
TABLE 3 TEXTILE DYES MARKET: PORTER’S FIVE FORCES ANALYSIS
5.3.1 THREAT OF NEW ENTRANTS
5.3.2 THREAT OF SUBSTITUTES
5.3.3 BARGAINING POWER OF SUPPLIERS
5.3.4 BARGAINING POWER OF BUYERS
5.3.5 INTENSITY OF COMPETITIVE RIVALRY
5.4 KEY STAKEHOLDERS & BUYING CRITERIA
5.4.1 KEY STAKEHOLDERS IN BUYING PROCESS
FIGURE 22 INFLUENCE OF STAKEHOLDERS IN BUYING PROCESS FOR TOP 3 FIBER TYPES
TABLE 4 INFLUENCE OF STAKEHOLDERS IN BUYING PROCESS FOR TOP 3 FIBER TYPES (%)
5.4.2 BUYING CRITERIA
FIGURE 23 KEY BUYING CRITERIA FOR TOP 3 FIBER TYPES
TABLE 5 KEY BUYING CRITERIA FOR TOP 3 FIBER TYPES
5.5 VALUE CHAIN ANALYSIS
FIGURE 24 TEXTILE DYES: VALUE CHAIN ANALYSIS
TABLE 6 TEXTILE DYES MARKET: SUPPLY CHAIN ECOSYSTEM
5.5.1 IMPACT OF COVID-19 ON VALUE CHAIN
5.5.1.1 Action plan against current vulnerability
5.6 MACROECONOMIC INDICATORS
5.6.1 INTRODUCTION
5.6.2 GDP TRENDS AND FORECAST
TABLE 7 GDP TRENDS AND FORECAST, PERCENTAGE CHANGE
5.6.3 MARKET TRENDS IN THE TEXTILE INDUSTRY
FIGURE 25 WORLD’S TOP FIVE EXPORTERS OF TEXTILES, 2020
FIGURE 26 WORLD’S TOP FIVE IMPORTERS OF TEXTILES, 2020
5.7 AVERAGE PRICING ANALYSIS
FIGURE 27 AVERAGE PRICE COMPETITIVENESS IN TEXTILE DYES MARKET, BY REGION IN 2021
5.7.1 AVERAGE SELLING PRICE, BY DYE TYPE
FIGURE 28 AVERAGE SELLING PRICE, DYE TYPE
5.8 SUPPLY CHAIN CRISES SINCE PANDEMIC
5.9 GLOBAL SCENARIOS
5.9.1 CHINA
5.9.1.1 China’s debt problem
5.9.1.2 Australia-China trade war
5.9.1.3 Environmental commitments
5.9.2 EUROPE
5.9.2.1 Political instability in Germany
5.9.2.2 Energy crisis in Europe
5.9.2.3 Manpower issues in the UK
5.10 TEXTILE DYES ECOSYSTEM
FIGURE 29 TEXTILE DYES ECOSYSTEM
5.11 FUTURE MARKET TRENDS FOR TEXTILE DYES
FIGURE 30 SHIFT IN TEXTILE INDUSTRY: YC & YCC SHIFT
5.12 EXPORT-IMPORT TRADE STATISTICS
TABLE 8 TOP EXPORTERS (2017–2021)
TABLE 9 TOP IMPORTERS (2017–2021)
5.13 PATENT ANALYSIS
5.13.1 METHODOLOGY
5.13.2 PUBLICATION TRENDS
FIGURE 31 NUMBER OF PATENTS PUBLISHED, 2018–2022
5.13.3 PATENT ANALYSIS BY JURISDICTION
FIGURE 32 PATENTS PUBLISHED BY EACH JURISDICTION, 2018–2022
5.13.4 TOP APPLICANTS
FIGURE 33 PATENTS PUBLISHED BY MAJOR APPLICANTS, 2018–2022
5.14 COVID-19 IMPACT ANALYSIS
FIGURE 34 LATEST WORLD ECONOMIC OUTLOOK GROWTH PROJECTIONS
5.14.1 ECONOMIC IMPACT OF COVID-19 – SCENARIO ASSESSMENT
FIGURE 35 FACTORS IMPACTED ECONOMIES OF SELECT G20 COUNTRIES IN 2020
5.15 GLOBAL REGULATORY FRAMEWORK AND ITS IMPACT ON TEXTILE DYES MARKET
5.15.1 REGULATORY BODIES, GOVERNMENT AGENCIES, AND OTHER ORGANIZATIONS
TABLE 10 NORTH AMERICA: LIST OF REGULATORY BODIES, GOVERNMENT AGENCIES, AND OTHER ORGANIZATIONS
TABLE 11 EUROPE: LIST OF REGULATORY BODIES, GOVERNMENT AGENCIES, AND OTHER ORGANIZATIONS
5.15.2 ENVIRONMENTAL REGULATIONS & ROLE OF GOVERNMENT
TABLE 12 ENVIRONMENTAL REGULATIONS
5.16 TECHNOLOGY ANALYSIS
5.17 CASE STUDY
5.18 KEY CONFERENCES & EVENTS IN 2022–2023
TABLE 13 TEXTILE DYES MARKET: DETAILED LIST OF CONFERENCES & EVENTS
6 TEXTILE DYES MARKET, BY DYE-TYPE (Page No. - 80)
6.1 INTRODUCTION
TABLE 14 DIFFERENT DYES AND THEIR APPLICATIONS
FIGURE 36 CELLULOSE SEGMENT TO LEAD TEXTILE DYES MARKET
TABLE 15 TEXTILE DYES MARKET SIZE, BY TYPE, 2017–2021 (USD MILLION)
TABLE 16 TEXTILE DYE MARKET SIZE, BY TYPE, 2022–2027 (USD MILLION)
TABLE 17 TEXTILE DYES MARKET SIZE, BY TYPE, 2017–2021 (KILOTON)
TABLE 18 TEXTILE DYE MARKET SIZE, BY TYPE, 2022–2027 (KILOTON)
TABLE 19 TEXTILE DYES MARKET SIZE, BY DYE TYPE, 2017–2021 (USD MILLION)
TABLE 20 TEXTILE DYE MARKET SIZE, BY DYE TYPE, 2022–2027 (USD MILLION)
TABLE 21 TEXTILE DYES MARKET SIZE, BY DYE TYPE, 2017–2021 (KILOTON)
TABLE 22 TEXTILE DYE MARKET SIZE, BY DYE TYPE, 2022–2027 (KILOTON)
6.2 CELLULOSE
TABLE 23 CELLULOSE MARKET SIZE, BY REGION, 2017–2021 (USD MILLION)
TABLE 24 CELLULOSE MARKET SIZE, BY REGION, 2022–2027 (USD MILLION)
TABLE 25 CELLULOSE MARKET SIZE, BY REGION, 2017–2021 (KILOTON)
TABLE 26 CELLULOSE MARKET SIZE, BY REGION, 2022–2027 (KILOTON)
6.2.1 DIRECT
6.2.1.1 Demand for direct dyes is reduced in developed regions due to environmental concerns
TABLE 27 DIRECT DYES MARKET SIZE, BY REGION, 2017–2021 (USD MILLION)
TABLE 28 DIRECT DYES MARKET SIZE, BY REGION, 2022–2027 (USD MILLION)
TABLE 29 DIRECT DYES MARKET SIZE, BY REGION, 2017–2021 (KILOTON)
TABLE 30 DIRECT DYES MARKET SIZE, BY REGION, 2022–2027 (KILOTON)
6.2.2 REACTIVE
6.2.2.1 Sustainable solution for dyeing industry; fastest-growing dye segment
TABLE 31 REACTIVE DYES MARKET SIZE, BY REGION, 2017–2021 (USD MILLION)
TABLE 32 REACTIVE DYES MARKET SIZE, BY REGION, 2022–2027 (USD MILLION)
TABLE 33 REACTIVE DYES MARKET SIZE, BY REGION, 2017–2021 (KILOTON)
TABLE 34 REACTIVE DYES MARKET SIZE, BY REGION, 2022–2027 (KILOTON)
6.2.3 VAT
6.2.3.1 VAT dyes have superior fastness properties and produce stable colors which support their growth
TABLE 35 VAT DYES MARKET SIZE, BY REGION, 2017–2021 (USD MILLION)
TABLE 36 VAT DYES MARKET SIZE, BY REGION, 2022–2027 (USD MILLION)
TABLE 37 VAT DYES MARKET SIZE, BY REGION, 2017–2021 (KILOTON)
TABLE 38 VAT DYES MARKET SIZE, BY REGION, 2022–2027 (KILOTON)
6.2.4 BASIC
6.2.4.1 Growth in jute dyeing and acrylic fibers dyeing to influence basic dyes segment positively
TABLE 39 BASIC DYES MARKET SIZE, BY REGION, 2017–2021 (USD MILLION)
TABLE 40 BASIC DYES MARKET SIZE, BY REGION, 2022–2027 (USD MILLION)
TABLE 41 BASIC DYES MARKET SIZE, BY REGION, 2017–2021 (KILOTON)
TABLE 42 BASIC DYES MARKET SIZE, BY REGION, 2022–2027 (KILOTON)
6.3 PROTEIN
6.3.1 ACID
6.3.1.1 Asia Pacific is biggest market for acid dyes
TABLE 43 ACID DYES MARKET SIZE, BY REGION, 2017–2021 (USD MILLION)
TABLE 44 ACID DYES MARKET SIZE, BY REGION, 2022–2027 (USD MILLION)
TABLE 45 ACID DYES MARKET SIZE, BY REGION, 2017–2021 (KILOTON)
TABLE 46 ACID DYES MARKET SIZE, BY REGION, 2022–2027 (KILOTON)
6.4 SYNTHETIC
6.4.1 DISPERSE
6.4.1.1 High demand for polyester fibers likely to boost disperse dyes segment
TABLE 47 DISPERSE DYES MARKET SIZE, BY REGION, 2017–2021 (USD MILLION)
TABLE 48 DISPERSE DYES MARKET SIZE, BY REGION, 2022–2027 (USD MILLION)
TABLE 49 DISPERSE DYES MARKET SIZE, BY REGION, 2017–2021 (KILOTON)
TABLE 50 DISPERSE DYES MARKET SIZE, BY REGION, 2022–2027 (KILOTON)
6.5 OTHERS
TABLE 51 OTHER DYES MARKET SIZE, BY REGION, 2017–2021 (USD MILLION)
TABLE 52 OTHER DYES MARKET SIZE, BY REGION, 2022–2027 (USD MILLION)
TABLE 53 OTHER DYES MARKET SIZE, BY REGION, 2017–2021 (KILOTON)
TABLE 54 OTHER DYES MARKET SIZE, BY REGION, 2022–2027 (KILOTON)
7 TEXTILE DYES MARKET, BY FIBER TYPE (Page No. - 98)
7.1 INTRODUCTION
FIGURE 37 VISCOSE TO GROW AT HIGHEST CAGR DURING FORECAST PERIOD
TABLE 55 TEXTILE DYES MARKET SIZE, BY FIBER TYPE, 2017–2021 (USD MILLION)
TABLE 56 TEXTILE DYE MARKET SIZE, BY FIBER TYPE, 2022–2027 (USD MILLION)
TABLE 57 TEXTILE DYES MARKET SIZE, BY FIBER TYPE, 2017–2021 (KILOTON)
TABLE 58 TEXTILE DYE MARKET SIZE, BY FIBER TYPE, 2022–2027 (KILOTON)
7.2 WOOL
7.2.1 DEMAND FOR WOOLEN TEXTILE BEING REPLACED BY SYNTHETIC TEXTILE
TABLE 59 WOOL FIBER: TEXTILE DYES MARKET SIZE, BY REGION, 2017–2021 (USD MILLION)
TABLE 60 WOOL FIBER: TEXTILE DYE MARKET SIZE, BY REGION, 2022–2027 (USD MILLION)
TABLE 61 WOOL FIBER: TEXTILE DYES MARKET SIZE, BY REGION, 2017–2021 (KILOTON)
TABLE 62 WOOL FIBER: TEXTILE DYE MARKET SIZE, BY REGION, 2022–2027 (KILOTON)
7.3 NYLON
7.3.1 REDUCED DEMAND FOR NYLON DUE TO SUSTAINABILITY CONCERNS
TABLE 63 NYLON FIBER: TEXTILE DYES MARKET SIZE, BY REGION, 2017–2021 (USD MILLION)
TABLE 64 NYLON FIBER: TEXTILE DYE MARKET SIZE, BY REGION, 2022–2027 (USD MILLION)
TABLE 65 NYLON FIBER: TEXTILE DYES MARKET SIZE, BY REGION, 2017–2021 (KILOTON)
TABLE 66 NYLON FIBER: TEXTILE DYE MARKET SIZE, BY REGION, 2022–2027 (KILOTON)
7.4 COTTON
7.4.1 GROWTH OF COTTON DUE TO ITS SUPERIOR QUALITIES AND AFFORDABILITY
TABLE 67 COTTON FIBER: TEXTILE DYES MARKET SIZE, BY REGION, 2017–2021 (USD MILLION)
TABLE 68 COTTON FIBER: TEXTILE DYE MARKET SIZE, BY REGION, 2022–2027 (USD MILLION)
TABLE 69 COTTON FIBER: TEXTILE DYES MARKET SIZE, BY REGION, 2017–2021 (KILOTON)
TABLE 70 COTTON FIBER: TEXTILE DYE MARKET SIZE, BY REGION, 2022–2027 (KILOTON)
7.5 VISCOSE
7.5.1 VISCOSE IS VERSATILE AND CAN BE DYED USING VARIOUS KINDS OF DYES
TABLE 71 VISCOSE FIBER: TEXTILE DYES MARKET SIZE, BY REGION, 2017–2021 (USD MILLION)
TABLE 72 VISCOSE FIBER: TEXTILE DYE MARKET SIZE, BY REGION, 2022–2027 (USD MILLION)
TABLE 73 VISCOSE FIBER: TEXTILE DYES MARKET SIZE, BY REGION, 2017–2021 (KILOTON)
TABLE 74 VISCOSE FIBER: TEXTILE DYE MARKET SIZE, BY REGION, 2022–2027 (KILOTON)
7.6 POLYESTER
7.6.1 WATER- AND FIRE-RESISTANT PROPERTIES OF POLYESTER RESULT IN INCREASED DEMAND
TABLE 75 POLYESTER FIBER: TEXTILE DYES MARKET SIZE, BY REGION, 2017–2021 (USD MILLION)
TABLE 76 POLYESTER FIBER: TEXTILE DYE MARKET SIZE, BY REGION, 2022–2027 (USD MILLION)
TABLE 77 POLYESTER FIBER: TEXTILE DYES MARKET SIZE, BY REGION, 2017–2021 (KILOTON)
TABLE 78 POLYESTER FIBER: TEXTILE DYE MARKET SIZE, BY REGION, 2022–2027 (KILOTON)
7.7 ACRYLIC
7.7.1 DEMAND FOR ACRYLIC IS REDUCING, RESULTING IN LOW TEXTILE DYES DEMAND
TABLE 79 ACRYLIC FIBER: TEXTILE DYES MARKET SIZE, BY REGION, 2017–2021 (USD MILLION)
TABLE 80 ACRYLIC FIBER: TEXTILE DYE MARKET SIZE, BY REGION, 2022–2027 (USD MILLION)
TABLE 81 ACRYLIC FIBER: TEXTILE DYES MARKET SIZE, BY REGION, 2017–2021 (KILOTON)
TABLE 82 ACRYLIC FIBER: TEXTILE DYE MARKET SIZE, BY REGION, 2022–2027 (KILOTON)
7.8 OTHERS
TABLE 83 OTHER FIBERS: TEXTILE DYES MARKET SIZE, BY REGION, 2017–2021 (USD MILLION)
TABLE 84 OTHER FIBERS: TEXTILE DYE MARKET SIZE, BY REGION, 2022–2027 (USD MILLION)
TABLE 85 OTHER FIBERS: TEXTILE DYES MARKET SIZE, BY REGION, 2017–2021 (KILOTON)
TABLE 86 OTHER FIBERS: TEXTILE DYE MARKET SIZE, BY REGION, 2022–2027 (KILOTON)
8 TEXTILE DYES MARKET, BY REGION (Page No. - 113)
8.1 INTRODUCTION
FIGURE 38 ASIA PACIFIC TO GROW AT HIGHEST CAGR DURING FORECAST PERIOD
TABLE 87 TEXTILE DYES MARKET SIZE, BY REGION, 2017–2021 (USD MILLION)
TABLE 88 TEXTILE DYE MARKET SIZE, BY REGION, 2022–2027 (USD MILLION)
TABLE 89 TEXTILE DYES MARKET SIZE, BY REGION, 2017–2021 (KILOTON)
TABLE 90 TEXTILE DYE MARKET SIZE, BY REGION, 2022–2027 (KILOTON)
8.2 ASIA PACIFIC
FIGURE 39 ASIA PACIFIC: TEXTILE DYES MARKET SNAPSHOT
8.2.1 IMPACT OF COVID-19 ON ASIA PACIFIC
TABLE 91 ASIA PACIFIC: TEXTILE DYES MARKET SIZE, BY COUNTRY, 2017–2021 (USD MILLION)
TABLE 92 ASIA PACIFIC: TEXTILES DYE MARKET SIZE, BY COUNTRY, 2022–2027 (USD MILLION)
TABLE 93 ASIA PACIFIC: MARKET SIZE, BY COUNTRY, 2017–2021 (KILOTON)
TABLE 94 ASIA PACIFIC: MARKET SIZE, BY COUNTRY, 2022–2027 (KILOTON)
TABLE 95 ASIA PACIFIC: MARKET SIZE, BY DYE TYPE, 2017–2021 (USD MILLION)
TABLE 96 ASIA PACIFIC: MARKET SIZE, BY DYE TYPE, 2022–2027 (USD MILLION)
TABLE 97 ASIA PACIFIC: MARKET SIZE, BY DYE TYPE, 2017–2021 (KILOTON)
TABLE 98 ASIA PACIFIC: MARKET SIZE, BY DYE TYPE, 2022–2027 (KILOTON)
TABLE 99 ASIA PACIFIC: MARKET SIZE, BY TYPE, 2017–2021 (USD MILLION)
TABLE 100 ASIA PACIFIC: MARKET SIZE, BY TYPE, 2022–2027 (USD MILLION)
TABLE 101 ASIA PACIFIC: MARKET SIZE, BY TYPE, 2017–2021 (KILOTON)
TABLE 102 ASIA PACIFIC: MARKET SIZE, BY TYPE, 2022–2027 (KILOTON)
TABLE 103 ASIA PACIFIC: MARKET SIZE, BY FIBER TYPE, 2017–2021 (USD MILLION)
TABLE 104 ASIA PACIFIC: MARKET SIZE, BY FIBER TYPE, 2022–2027 (USD MILLION)
TABLE 105 ASIA PACIFIC: MARKET SIZE, BY FIBER TYPE, 2017–2021 (KILOTON)
TABLE 106 ASIA PACIFIC: MARKET SIZE, BY FIBER TYPE, 2022–2027 (KILOTON)
8.2.2 CHINA
8.2.2.1 High population and growth of fast fashion leading to market growth
8.2.3 INDIA
8.2.3.1 Make in India initiative promotes growth of textile dyes industry
8.2.4 JAPAN
8.2.4.1 Japan, being a mature market, to grow at slow rate
8.2.5 SOUTH KOREA
8.2.5.1 Export is leading force for growth in textile dyes industry
8.2.6 THAILAND
8.2.6.1 Cheap labor and less stringent regulations related to production drive market growth
8.2.7 REST OF ASIA PACIFIC
8.3 NORTH AMERICA
8.3.1 IMPACT OF COVID-19 ON NORTH AMERICA
FIGURE 40 NORTH AMERICA: TEXTILE DYES MARKET SNAPSHOT
TABLE 107 NORTH AMERICA: TEXTILE DYE MARKET SIZE, BY COUNTRY, 2017–2021 (USD MILLION)
TABLE 108 NORTH AMERICA: MARKET SIZE, BY COUNTRY, 2022–2027 (USD MILLION)
TABLE 109 NORTH AMERICA: MARKET SIZE, BY COUNTRY, 2017–2021 (KILOTON)
TABLE 110 NORTH AMERICA: MARKET SIZE, BY COUNTRY, 2022–2027 (KILOTON)
TABLE 111 NORTH AMERICA: MARKET SIZE, BY DYE TYPE, 2017–2021 (USD MILLION)
TABLE 112 NORTH AMERICA: MARKET SIZE, BY DYE TYPE, 2022–2027 (USD MILLION)
TABLE 113 NORTH AMERICA: MARKET SIZE, BY DYE TYPE, 2017–2021 (KILOTON)
TABLE 114 NORTH AMERICA: MARKET SIZE, BY DYE TYPE, 2022–2027 (KILOTON)
TABLE 115 NORTH AMERICA: MARKET SIZE, BY TYPE, 2017–2021 (USD MILLION)
TABLE 116 NORTH AMERICA: MARKET SIZE, BY TYPE, 2022–2027 (USD MILLION)
TABLE 117 NORTH AMERICA: MARKET SIZE, BY TYPE, 2017–2021 (KILOTON)
TABLE 118 NORTH AMERICA: MARKET SIZE, BY TYPE, 2022–2027 (KILOTON)
TABLE 119 NORTH AMERICA: MARKET SIZE, BY FIBER TYPE, 2017–2021 (USD MILLION)
TABLE 120 NORTH AMERICA: MARKET SIZE, BY FIBER TYPE, 2022–2027 (USD MILLION)
TABLE 121 NORTH AMERICA: MARKET SIZE, BY FIBER TYPE, 2017–2021 (KILOTON)
TABLE 122 NORTH AMERICA: MARKET SIZE, BY FIBER TYPE, 2022–2027 (KILOTON)
8.3.2 US
8.3.2.1 High investments expected in R&D for production of high quality and sustainable dye options
8.3.3 CANADA
8.3.3.1 Focus on innovation and technological advancements to drive market
8.3.4 MEXICO
8.3.4.1 Mexico emerging as a global leader due to skilled labor and low labor cost
8.4 EUROPE
8.4.1 IMPACT OF COVID-19 ON EUROPE
FIGURE 41 EUROPE: TEXTILE DYES MARKET SNAPSHOT
TABLE 123 EUROPE: TEXTILE DYE MARKET SIZE, BY COUNTRY, 2017–2021 (USD MILLION)
TABLE 124 EUROPE: MARKET SIZE, BY COUNTRY, 2022–2027 (USD MILLION)
TABLE 125 EUROPE: MARKET SIZE, BY COUNTRY, 2017–2021 (KILOTON)
TABLE 126 EUROPE: MARKET SIZE, BY COUNTRY, 2022–2027 (KILOTON)
TABLE 127 EUROPE: MARKET SIZE, BY DYE TYPE, 2017–2021 (USD MILLION)
TABLE 128 EUROPE: MARKET SIZE, BY DYE TYPE, 2022–2027 (USD MILLION)
TABLE 129 EUROPE: MARKET SIZE, BY DYE TYPE, 2017–2021 (KILOTON)
TABLE 130 EUROPE: MARKET SIZE, BY DYE TYPE, 2022–2027 (KILOTON)
TABLE 131 EUROPE: MARKET SIZE, BY TYPE, 2017–2021 (USD MILLION)
TABLE 132 EUROPE: MARKET SIZE, BY TYPE, 2022–2027 (USD MILLION)
TABLE 133 EUROPE: MARKET SIZE, BY TYPE, 2017–2021 (KILOTON)
TABLE 134 EUROPE: MARKET SIZE, BY TYPE, 2022–2027 (KILOTON)
TABLE 135 EUROPE: MARKET SIZE, BY FIBER TYPE, 2017–2021 (USD MILLION)
TABLE 136 EUROPE: MARKET SIZE, BY FIBER TYPE, 2022–2027 (USD MILLION)
TABLE 137 EUROPE: MARKET SIZE, BY FIBER TYPE, 2017–2021 (KILOTON)
TABLE 138 EUROPE: MARKET SIZE, BY FIBER TYPE, 2022–2027 (KILOTON)
8.4.2 GERMANY
8.4.2.1 Market driven by technical textiles segment and innovations
8.4.3 FRANCE
8.4.3.1 Technical textile segment leading textile dyes market in France
8.4.4 UK
8.4.4.1 Growth of textile industry to lead by luxury products
8.4.5 ITALY
8.4.5.1 High quality products’ import will lead to market growth
8.4.6 SPAIN
8.4.6.1 Economic development will lead to growth in textile dyes market
8.4.7 RUSSIA
8.4.7.1 Innovation to boost textile dyes market
8.4.8 REST OF EUROPE
8.5 SOUTH AMERICA
8.5.1 IMPACT OF COVID-19 ON SOUTH AMERICA
FIGURE 42 COTTON TO CAPTURE LARGEST MARKET SIZE DURING PROJECTED YEARS
TABLE 139 SOUTH AMERICA: TEXTILE DYES MARKET SIZE, BY COUNTRY, 2017–2021 (USD MILLION)
TABLE 140 SOUTH AMERICA: TEXTILE DYE MARKET SIZE, BY COUNTRY, 2022–2027 (USD MILLION)
TABLE 141 SOUTH AMERICA: MARKET SIZE, BY COUNTRY, 2017–2021 (KILOTON)
TABLE 142 SOUTH AMERICA: MARKET SIZE, BY COUNTRY, 2022–2027 (KILOTON)
TABLE 143 SOUTH AMERICA: MARKET SIZE, BY DYE TYPE, 2017–2021 (USD MILLION)
TABLE 144 SOUTH AMERICA: MARKET SIZE, BY DYE TYPE, 2022–2027 (USD MILLION)
TABLE 145 SOUTH AMERICA: MARKET SIZE, BY DYE TYPE, 2017–2021 (KILOTON)
TABLE 146 SOUTH AMERICA: MARKET SIZE, BY DYE TYPE, 2022–2027 (KILOTON)
TABLE 147 SOUTH AMERICA: MARKET SIZE, BY TYPE, 2017–2021 (USD MILLION)
TABLE 148 SOUTH AMERICA: MARKET SIZE, BY TYPE, 2022–2027 (USD MILLION)
TABLE 149 SOUTH AMERICA: MARKET SIZE, BY TYPE, 2017–2021 (KILOTON)
TABLE 150 SOUTH AMERICA: MARKET SIZE, BY TYPE, 2022–2027 (KILOTON)
TABLE 151 SOUTH AMERICA: MARKET SIZE, BY FIBER TYPE, 2017–2021 (USD MILLION)
TABLE 152 SOUTH AMERICA: MARKET SIZE, BY FIBER TYPE, 2022–2027 (USD MILLION)
TABLE 153 SOUTH AMERICA: MARKET SIZE, BY FIBER TYPE, 2017–2021 (KILOTON)
TABLE 154 SOUTH AMERICA: MARKET SIZE, BY FIBER TYPE, 2022–2027 (KILOTON)
8.5.2 BRAZIL
8.5.2.1 Economic growth will lead to growth in textile dyes market
8.5.3 ARGENTINA
8.5.3.1 Improved economic conditions lead to high demand for textile dyes
8.5.4 REST OF SOUTH AMERICA
8.6 MIDDLE EAST & AFRICA
8.6.1 IMPACT OF COVID-19 ON MIDDLE EAST & AFRICA
FIGURE 43 VISCOSE TO BE FASTEST-GROWING SEGMENT IN TEXTILE DYES MARKET
TABLE 155 MIDDLE EAST & AFRICA: TEXTILE DYES MARKET SIZE, BY COUNTRY, 2017–2021 (USD MILLION)
TABLE 156 MIDDLE EAST & AFRICA: TEXTILE DYE MARKET SIZE, BY COUNTRY, 2022–2027 (USD MILLION)
TABLE 157 MIDDLE EAST & AFRICA: MARKET SIZE, BY COUNTRY, 2017–2021 (KILOTON)
TABLE 158 MIDDLE EAST & AFRICA: MARKET SIZE, BY COUNTRY, 2022–2027 (KILOTON)
TABLE 159 MIDDLE EAST & AFRICA: MARKET SIZE, BY DYE TYPE, 2017–2021 (USD MILLION)
TABLE 160 MIDDLE EAST & AFRICA: MARKET SIZE, BY DYE TYPE, 2022–2027 (USD MILLION)
TABLE 161 MIDDLE EAST & AFRICA: MARKET SIZE, BY DYE TYPE, 2017–2021 (KILOTON)
TABLE 162 MIDDLE EAST & AFRICA: MARKET SIZE, BY DYE TYPE, 2022–2027 (KILOTON)
TABLE 163 MIDDLE EAST & AFRICA: MARKET SIZE, BY TYPE, 2017–2021 (USD MILLION)
TABLE 164 MIDDLE EAST & AFRICA: MARKET SIZE, BY TYPE, 2022–2027 (USD MILLION)
TABLE 165 MIDDLE EAST & AFRICA: MARKET SIZE, BY TYPE, 2017–2021 (KILOTON)
TABLE 166 MIDDLE EAST & AFRICA: MARKET SIZE, BY TYPE, 2022–2027 (KILOTON)
TABLE 167 MIDDLE EAST & AFRICA: MARKET SIZE, BY FIBER TYPE, 2017–2021 (USD MILLION)
TABLE 168 MIDDLE EAST & AFRICA: MARKET SIZE, BY FIBER TYPE, 2022–2027 (USD MILLION)
TABLE 169 MIDDLE EAST & AFRICA: MARKET SIZE, BY FIBER TYPE, 2017–2021 (KILOTON)
TABLE 170 MIDDLE EAST & AFRICA: MARKET SIZE, BY FIBER TYPE, 2022–2027 (KILOTON)
8.6.2 SAUDI ARABIA
8.6.2.1 Expected to witness low growth rate due to lack of competitive environment in industry
8.6.3 UAE
8.6.3.1 High potential for profitable investment in country
8.6.4 EGYPT
8.6.4.1 Favorable environment for growth of textile dyes industry
8.6.5 REST OF MIDDLE EAST & AFRICA
9 COMPETITIVE LANDSCAPE (Page No. - 159)
9.1 INTRODUCTION
9.2 KEY PLAYER STRATEGIES
TABLE 171 OVERVIEW OF STRATEGIES ADOPTED BY KEY TEXTILE DYE MANUFACTURERS
9.3 REVENUE ANALYSIS OF KEY PLAYERS
9.3.1 TEXTILE DYES MARKET REVENUE ANALYSIS OF TOP MARKET PLAYERS
FIGURE 44 TOP PLAYERS DOMINATED MARKET IN LAST 5 YEARS
9.4 TOP 5 PLAYERS RANKING
9.5 MARKET SHARE ANALYSIS
TABLE 172 TEXTILE DYES MARKET: DEGREE OF COMPETITION
FIGURE 45 TEXTILE DYES: MARKET SHARE ANALYSIS FOR 2021
9.6 COMPANY EVALUATION QUADRANT, 2021
9.6.1 STARS
9.6.2 EMERGING LEADERS
9.6.3 PERVASIVE
9.6.4 PARTICIPANTS
FIGURE 46 TEXTILE DYES MARKET: COMPETITIVE LEADERSHIP MAPPING, 2021
9.7 SME MATRIX, 2021
9.7.1 PROGRESSIVE COMPANIES
9.7.2 DYNAMIC COMPANIES
9.7.3 STARTING BLOCKS
9.7.4 RESPONSIVE COMPANIES
FIGURE 47 TEXTILE DYES MARKET: EMERGING COMPANIES COMPETITIVE LEADERSHIP MAPPING, 2021
9.8 COMPETITIVE BENCHMARKING
TABLE 173 TEXTILE DYE MARKET: DETAILED LIST OF KEY STARTUPS
TABLE 174 TEXTILE DYES MARKET: COMPETITIVE BENCHMARKING OF KEY STARTUPS/SMES
9.9 STRENGTH OF PRODUCT PORTFOLIO
FIGURE 48 PRODUCT PORTFOLIO ANALYSIS OF TOP PLAYERS IN TEXTILE DYES MARKET
9.10 BUSINESS STRATEGY EXCELLENCE
FIGURE 49 BUSINESS STRATEGY EXCELLENCE OF TOP PLAYERS IN TEXTILE DYES MARKET
9.11 COMPETITIVE SCENARIO
9.11.1 MARKET EVALUATION FRAMEWORK
TABLE 175 STRATEGIC DEVELOPMENTS, BY COMPANY
TABLE 176 MOST FOLLOWED STRATEGY
TABLE 177 GROWTH STRATEGIES ADOPTED BY KEY COMPANIES
9.11.2 MARKET EVALUATION MATRIX
TABLE 178 COMPANY PRODUCT FOOTPRINT
TABLE 179 COMPANY REGION FOOTPRINT
TABLE 180 COMPANY INDUSTRY FOOTPRINT
9.12 STRATEGIC DEVELOPMENTS
TABLE 181 NEW PRODUCT LAUNCHES/DEVELOPMENTS, 2017–2022
TABLE 182 DEALS, 2017–2022
TABLE 183 OTHERS, 2017–2022
10 COMPANY PROFILES (Page No. - 175)
(Business Overview, Products Offered, Recent Developments, MnM View Right to win, Strategic choices made, Weaknesses and competitive threats) *
10.1 KEY COMPANIES
10.1.1 HUNTSMAN CORPORATION
TABLE 184 HUNTSMAN CORPORATION: COMPANY OVERVIEW
FIGURE 50 HUNTSMAN CORPORATION: COMPANY SNAPSHOT
TABLE 185 HUNTSMAN CORPORATION: PRODUCTS OFFERED
TABLE 186 HUNTSMAN CORPORATION: DEALS
10.1.2 KIRI INDUSTRIES
TABLE 187 KIRI INDUSTRIES: COMPANY OVERVIEW
FIGURE 51 KIRI INDUSTRIES: COMPANY SNAPSHOT
TABLE 188 KIRI INDUSTRIES: PRODUCTS OFFERED
TABLE 189 KIRI INDUSTRIES: OTHER DEVELOPMENTS
10.1.3 ATUL LTD.
TABLE 190 ATUL LTD.: COMPANY OVERVIEW
FIGURE 52 ATUL LTD.: COMPANY SNAPSHOT
TABLE 191 ATUL LTD.: PRODUCTS OFFERED
TABLE 192 ATUL LTD.: PRODUCT LAUNCHES
10.1.4 LANXESS AG
TABLE 193 LANXESS AG: COMPANY OVERVIEW
FIGURE 53 LANXESS AG: COMPANY SNAPSHOT
TABLE 194 LANXESS AG: PRODUCTS OFFERED
10.1.5 ZHEJIANG LONGSHENG GROUP CO. LTD
TABLE 195 ZHEJIANG LONGSHENG GROUP CO. LTD.: COMPANY OVERVIEW
FIGURE 54 ZHEJIANG LONGSHENG GROUP CO. LTD.: COMPANY SNAPSHOT
TABLE 196 ZHEJIANG LONGSHENG GROUP CO. LTD: PRODUCTS OFFERED
10.1.6 ZHEJIANG JIHUA GROUP
TABLE 197 ZHEJIANG JIHUA GROUP: COMPANY OVERVIEW
FIGURE 55 ZHEJIANG JIHUA GROUP : COMPANY SNAPSHOT
TABLE 198 ZHEJIANG JIHUA GROUP: PRODUCTS OFFERED
10.1.7 ZHEJIANG RUNTU CO. LTD
TABLE 199 ZHEJIANG RUNTU CO. LTD: COMPANY OVERVIEW
TABLE 200 ZHEJIANG RUNTU CO. LTD: PRODUCTS OFFERED
10.1.8 ARCHROMA MANAGEMENT LLC
TABLE 201 ARCHROMA MANAGEMENT LLC: COMPANY OVERVIEW
TABLE 202 ARCHROMA MANAGEMENT LLC: PRODUCTS OFFERED
TABLE 203 ARCHROMA MANAGEMENT LLC: DEALS
10.1.9 JAY CHEMICALS
TABLE 204 JAY CHEMICALS: COMPANY OVERVIEW
TABLE 205 JAY CHEMICALS: PRODUCTS OFFERED
10.1.10 EKSOY KIMYA SANAYI VE TICARET ANONIM SIRKETI
TABLE 206 EKSOY KIMYA SANAYI VE TICARET ANONIM SIRKETI: COMPANY OVERVIEW
TABLE 207 EKSOY KIMYA SANAYI VE TICARET ANONIM SIRKETI: PRODUCTS OFFERED
10.2 OTHER PLAYERS
10.2.1 PENTACHEM INDUSTRIES
TABLE 208 PENTACHEM INDUSTRIES: COMPANY OVERVIEW
10.2.2 YABANG DYESTUFF
TABLE 209 YABANG DYESTUFF: COMPANY OVERVIEW
10.2.3 SHANGHAI ANOKY GROUP CO., LTD
TABLE 210 SHANGHAI ANOKY GROUP CO., LTD: COMPANY OVERVIEW
10.2.4 SHANDONG QING SHUN CHEMICAL CO., LTD
TABLE 211 SHANDONG QING SHUN CHEMICAL CO., LTD: COMPANY OVERVIEW
10.2.5 JIANGSU ZHIJIANG CHEMICAL CO.
TABLE 212 JIANGSU ZHIJIANG CHEMICAL CO: COMPANY OVERVIEW
10.2.6 ORGANIC DYES AND PIGMENTS LLC
TABLE 213 ORGANIC DYES AND PIGMENTS LLC: COMPANY OVERVIEW
10.2.7 ITALIA INCORPORATION
TABLE 214 ITALIA INCORPORATION: COMPANY OVERVIEW
10.2.8 SYNTHESIA, A.S
TABLE 215 SYNTHESIA, A.S: COMPANY OVERVIEW
10.2.9 HOLLINDIA INTERNATIONAL B.V.
TABLE 216 HOLLINDIA INTERNATIONAL B.V.: COMPANY OVERVIEW
10.2.10 CHROMATECH
TABLE 217 CHROMATECH: COMPANY OVERVIEW
10.2.11 AKIK DYE CHEM
TABLE 218 AKIK DYE CHEM: COMPANY OVERVIEW
10.2.12 KESHAV CHEMICALS
TABLE 219 KESHAV CHEMICALS: COMPANY OVERVIEW
10.2.13 DUPONT
TABLE 220 DUPONT: COMPANY OVERVIEW
10.2.14 AMTEX DYE-CHEM INDUSTRIES
TABLE 221 AMTEX DYE-CHEM INDUSTRIES: COMPANY OVERVIEW
10.2.15 THE BOZZETTO GROUP
TABLE 222 THE BOZZETTO GROUP: COMPANY OVERVIEW
*Details on Business Overview, Products Offered, Recent Developments, MnM View, Right to win, Strategic choices made, Weaknesses and competitive threats might not be captured in case of unlisted companies.
11 ADJACENT/RELATED MARKETS (Page No. - 209)
11.1 INTRODUCTION
11.2 LIMITATION
11.3 TEXTILE CHEMICALS
11.3.1 MARKET DEFINITION
11.3.2 MARKET OVERVIEW
11.3.3 TEXTILE CHEMICALS MARKET, BY FIBER TYPE
TABLE 223 TEXTILE CHEMICALS MARKET SIZE, BY FIBER TYPE, 2019–2026 (USD MILLION)
11.3.3.1 Natural fiber
11.3.3.2 Synthetic fiber
11.3.4 TEXTILE CHEMICALS MARKET, BY PRODUCT TYPE
TABLE 224 TEXTILE CHEMICALS MARKET SIZE, BY PRODUCT TYPE, 2019–2026 (USD BILLION)
11.3.4.1 Coating & sizing agents
11.3.4.2 Colorant & auxiliaries
11.3.4.3 Finishing agents
11.3.4.4 Surfactants
11.3.4.5 Desizing agents
11.3.4.6 Bleaching agents
11.3.4.7 Others
11.3.5 TEXTILE CHEMICALS MARKET, BY APPLICATION
TABLE 225 TEXTILE CHEMICALS MARKET SIZE, BY APPLICATION, 2019–2026 (USD MILLION)
11.3.5.1 Apparel
11.3.5.2 Home Textiles
11.3.5.3 Technical Textiles
11.3.5.4 Others
11.3.6 TEXTILE CHEMICALS MARKET, BY REGION
TABLE 226 TEXTILE CHEMICALS MARKET SIZE, BY REGION, 2019–2026 (USD MILLION)
11.3.6.1 Asia Pacific
11.3.6.2 North America
11.3.6.3 Europe
11.3.6.4 Middle East & Africa
11.3.6.5 South America
12 APPENDIX (Page No. - 216)
12.1 DISCUSSION GUIDE
12.2 KNOWLEDGE STORE: MARKETSANDMARKETS SUBSCRIPTION PORTAL
12.3 AVAILABLE CUSTOMIZATIONS
12.4 RELATED REPORTS
12.5 AUTHOR DETAILS
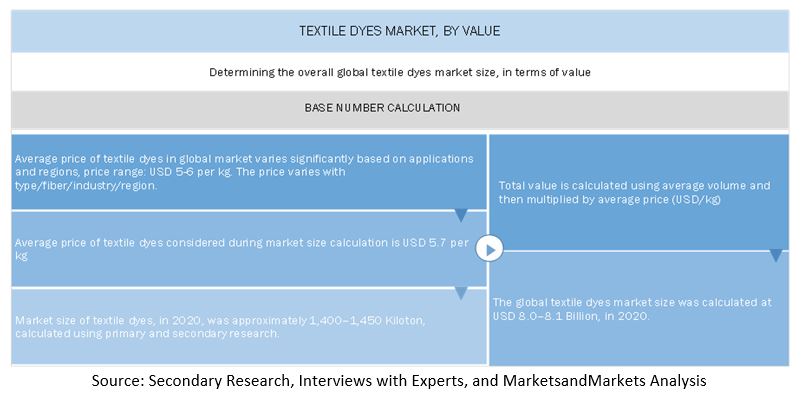
The study involved four major activities in estimating the current market size of textile dyes. Exhaustive secondary research was done to collect information on the market, the peer market, and the parent market. The next step was to validate these findings, assumptions, and sizing with industry experts across the value chain through primary research. Both top-down and bottom-up approaches were employed to estimate the complete market size. Thereafter, market breakdown and data triangulation methods were used to estimate the market size of the segments and the sub-segments.
Secondary Research
In the secondary research process, various secondary sources such as Hoovers, Bloomberg, and BusinessWeek were referred to for identifying and collecting information for this study. These secondary sources included annual reports, press releases & investor presentations of companies; white papers; certified publications; articles by recognized authors; gold standard & silver standard websites; regulatory bodies; trade directories; and databases.
Primary Research
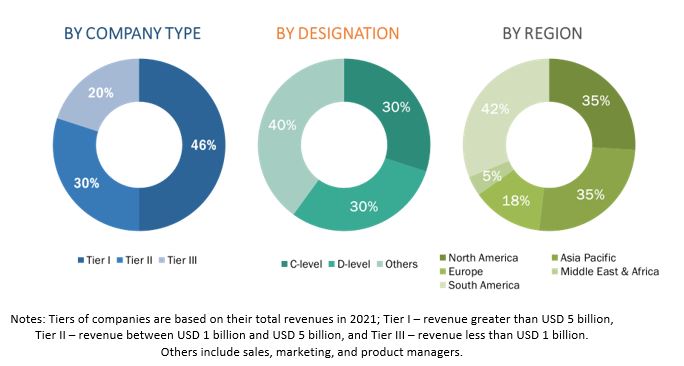
The textile dyes market comprises several stakeholders such as raw material suppliers, processors, end-product manufacturers, and regulatory organizations. The demand side for this market is characterized by the development of end-use products and applications such as fashion, healthcare, automotive, building & construction, retail, and others. Various primary sources from both the supply and demand sides of the market were interviewed to obtain qualitative and quantitative information. Following is the breakdown of the primary respondents:
To know about the assumptions considered for the study, download the pdf brochure
Market Size Estimation
Both the top-down and bottom-up approaches were used to estimate and validate the overall size of the adhesive tapes market. These methods were also used to estimate the size of various sub-segments of the market. The research methodology used to estimate the market size includes the following:
- The key players in the industry were identified through extensive secondary research.
- The industry’s supply chain and market size, in terms of value, were determined through primary and secondary research processes.
- All percentage shares, splits, and breakdowns were determined using secondary sources and verified through primary sources.
Top-down approach
The top-down approach used to estimate the market size included the following steps:
- During the course of the study, we have collected information from various secondary as well as primary sources. We collectively analyzed all the sources both, from the demand and supply side and evaluated the market for adhesive tapes.
- The textile dyes market study is analyzed in terms of both, value and volume (by dye type industry, by region, and other segments). Several secondary sources (companies’ annual reports, investor presentations, Huntsman corporation, Arul Ltd. Kiri Industries, and others) were considered to gain knowledge about the market size in terms of value and volume. Extracting data from all the sources, we have drafted the market estimation and projection. Regional association articles and papers were also considered to identify the regional market size such as Europe (Afera), North America (PSTC), and Asia Pacific (JATMA, and CATIA).
- After estimating the market size/share and growth rate through secondary sources, we validated and authenticated the market estimation and projection through our industry experts from suppliers’ side and also validated the information with global associations across different regions and countries to share their suggestions and verification of the estimated market size.
- Accordingly, we have finalized the market size estimation and growth projections for all the regional segments and finally arrived at the global market size/share, in terms of both, value and volume.
- Similarly, the market sizes for all other segments were derived and verified.
Textile Dyes Market: Market Size Estimation
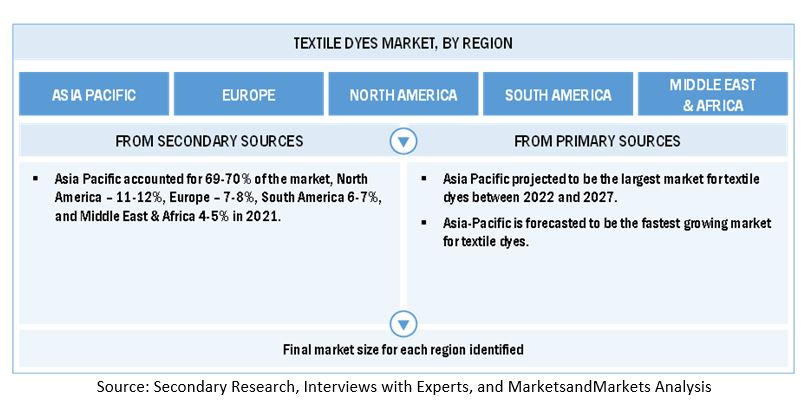
Textile Dyes Market Size Estimation, By Region
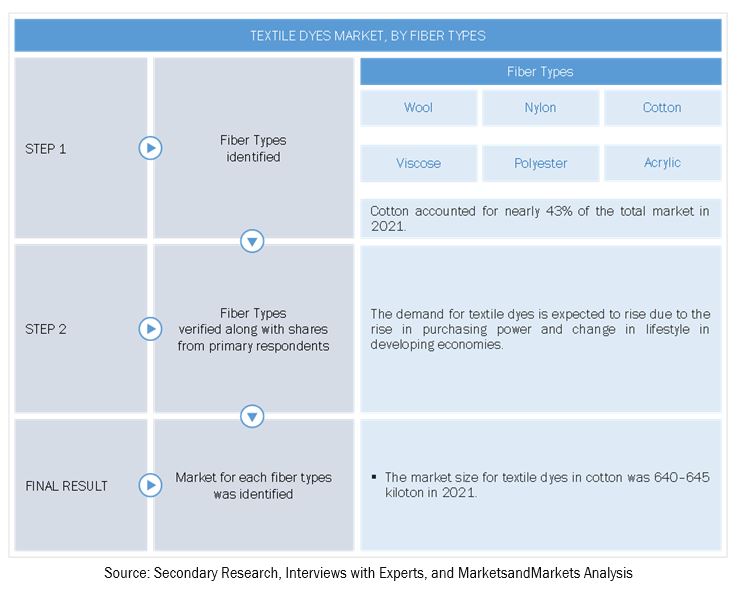
Textile Dyes Market Size Estimation, By Fiber Type
Bottom-Up Approach
The bottom-up approach has been employed to arrive at the overall size of the adhesive tapes market from the revenues of the key players and their shares in the market. Calculations based on the revenues of the leading players identified in the market have led to the overall market size.
The overall market size has been used in the top-down approach to estimate the sizes of other individual markets (mentioned in the market segmentation) through percentage splits from secondary and primary research.
The most appropriate immediate parent market size has been used for implementing the bottom-up approach and calculating the shares of each specific market segment. The bottom-up approach has also been implemented for data extracted from secondary research to validate the market sizes of various market segments.
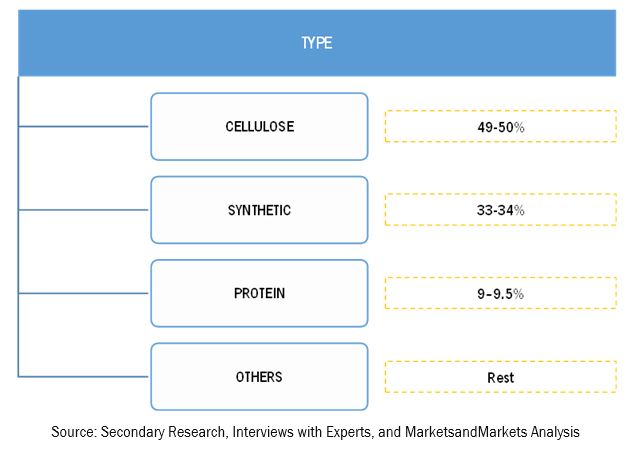
Market Size Estimation: Bottom-Up Approach, By Type
Data Triangulation
After arriving at the overall market size-using the market size estimation processes as explained above-the market was split into several segments and sub-segments. In order to complete the overall market engineering process and arrive at the exact statistics of each market segment and sub-segment, the data triangulation and market breakdown procedures were employed, wherever applicable. The data was triangulated by studying various factors and trends from both the demand and supply sides.
Report Objectives
- To define, describe, and forecast the adhesive tapes market, in terms of value and volume
- To provide information about the factors (drivers, restraints, opportunities, and industry-specific challenges) influencing the growth of the market
- To forecast and analyze the market based on resin type, technology, backing material, category, and end-use industry
- To analyze and forecast the market size, with respect to five main regions, namely, Asia Pacific (APAC), North America, Europe, the Middle East & Africa, and South America along with their respective key countries
- To strategically analyze the micromarkets with respect to individual growth trends, prospects, and their contribution to the overall market
- To analyze competitive developments such as new product launch, merger & acquisition, and investment & expansion in the market
- To analyze opportunities in the market for stakeholders and provide a detailed competitive landscape of the market leaders
- To strategically profile the key players in the market and comprehensively analyze their core competencies
Available Customizations
MarketsandMarkets offers customizations according to the specific needs of the companies with the given market data.
The following customization options are available for the report:
Product Analysis
- Product matrix, which gives a detailed comparison of the product portfolio of each company
Regional Analysis
- A further breakdown of the metallized film market, by country
Company Information
- Detailed analysis and profiling of additional market players (up to five)


 Generating Response ...


Growth opportunities and latent adjacency in Textile Dyes Market
Information on sales price of all dyestuffs
Need data on market size, growth projections, and key players in the Tie-dye market.
General information required on textile dyes