
Textile Recycling Market

Textile Recycling Market by Material (Cotton, Polyester & Polyester Fibers, Wool, Nylon & Nylon Fibers), Textile Waste, Process, Distribution Channel, End-Use (Apparel, Home Furnishing, Industrial & Institutional), and Region - Global Forecast to 2030


OVERVIEW
Source: Secondary Research, Interviews with Experts, MarketsandMarkets Analysis
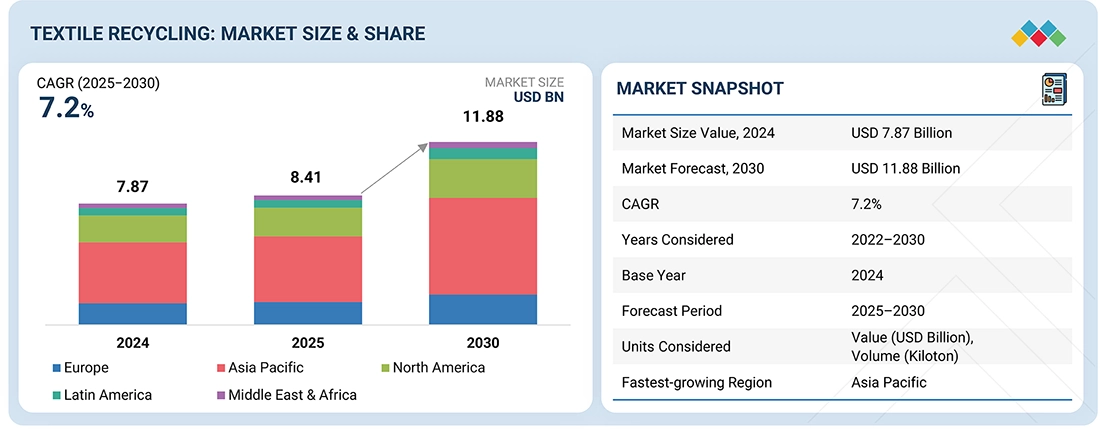
The textile recycling market is projected to reach USD 11.88 billion by 2030 from USD 8.41 billion in 2025, at a CAGR of 7.2%. The market is poised for strong growth, supported by advancements in recycling technologies and the rising demand for sustainable materials. Industries are increasingly adopting textile recycling technologies as decreased garment life leads to increasing textile waste.
KEY TAKEAWAYS
-
BY MATERIALThe textile recycling market includes cotton, polyester & polyester fibers, wool, nylon & nylon fibers, and other materials. Cotton is reused for making wiping cloths, insulation, and regenerated fibers for new textiles. Polyester and polyester fibers are recycled for making fibers for clothing, carpets, or filling materials like pillows. Wool is re-spun into yarn or used in blankets and industrial insulation. Nylon and its fibers are recycled into products such as sportswear, ropes, or carpets.
-
BY PROCESSMechanical and chemical processes are studied in this report. Mechanical recycling is the physical shredding, tearing, and cutting of textiles into smaller fibers. These fibers are then cleaned and re-spun into new yarns or used in products such as insulation or stuffing, or cleaning cloths. This form of recycling is present everywhere but results in shorter, lower-quality fibers. Chemical recycling utilizes solvents or chemical treatment to break down fibers at the molecular level and recover pure polymers, such as cellulose from cotton, or monomers from polyester and nylon.
-
BY DISTRIBUTION CHANNELOnline channel, retail & departmental stores are different distribution channels in the textile recycling market. Each offering different methods to reach out to consumers. Online channels are expanding rapidly due to rising awareness of sustainable fashion, ease of access to recycled products, and growing eCommerce penetration. Retail stores benefit from increasing consumer demand for eco-friendly apparel and visible labeling that builds trust and brand loyalty. Meanwhile, departmental stores are gaining traction by offering a wider range of recycled textile products under one roof, supported by rising middle-class purchasing power and collaborations with sustainable brands.
-
BY END-USE INDUSTRYTextile recycling products are increasingly used in apparel, industrial & institutional, home furnishing, and other end-use industries. In apparel, recycled fibers are incorporated into garments like t-shirts, jackets, and activewear. In industrial and institutional applications, they are used for insulation, cleaning cloths, and uniforms. Home furnishings benefit from recycled textiles in carpets, upholstery, and bedding, while other end-use industries utilize them for automotive interiors, packaging materials, and geotextiles, reducing waste and supporting circular economy practices.
-
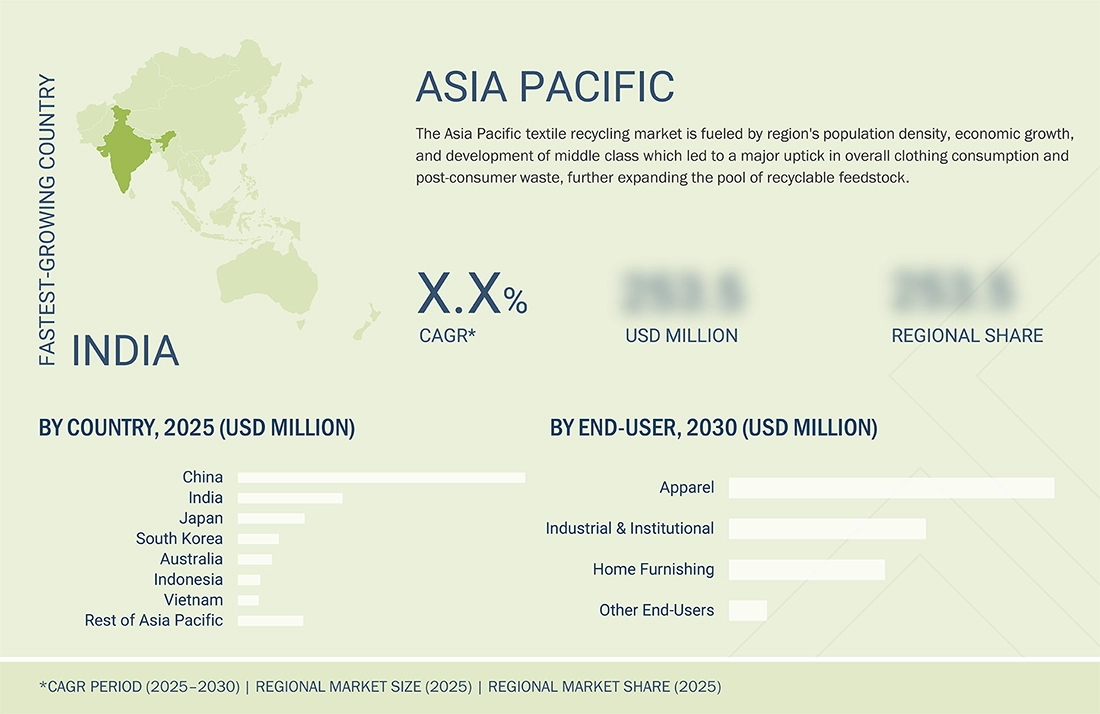
BY REGIONAsia Pacific is estimated to grow the fastest, at a CAGR of 8.1%, driven by the high volume of textile waste from manufacturing hubs and rising government and corporate sustainability initiatives.
-
COMPETITIVE LANDSCAPEThe market is driven by strategic collaborations, capacity expansions, and technological innovations from leading players such as Lenzing AG, Birla Cellulose, HYOSUNG TNC, Unifi, Inc., and Renewcell. These companies are advancing recycling technologies and broadening end-use adoption, reflecting the growing demand for sustainable and cost-effective alternatives to virgin carbon fiber.
The textile recycling market is projected to reach USD 11.88 billion by 2030 from USD 8.41 billion in 2025, at a CAGR of 7.2%. Textile recycling is the reclamation of fiber, yarn, or fabric from worn clothing, factory leftovers, or other fabric waste and re-manufacturing them into new goods or materials. Textile recycling can be done by shredding through a mechanical process, chemical breakdown, or heat processing, depending on the fiber type. The purpose is to decrease waste that goes to the landfill, save resources, and facilitate circularity of fashion and textiles by recycling wasteful textiles into usable raw materials to produce fresh clothes, insulation, and upholstery.
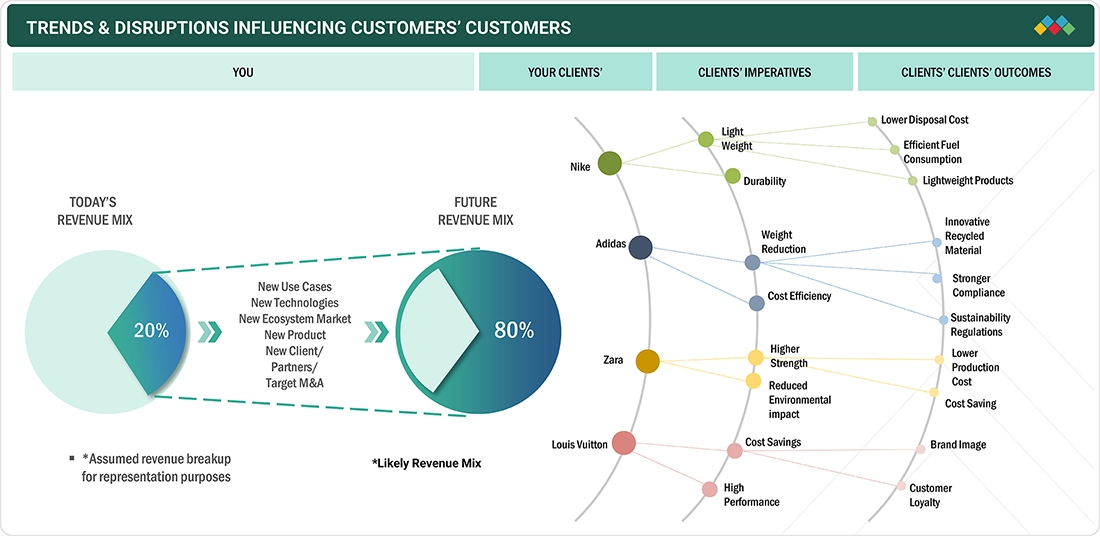
TRENDS & DISRUPTIONS IMPACTING CUSTOMERS' CUSTOMERS
Changes in customer trends or disruptions impact consumers’ businesses. These shifts impact the revenues of end users. Consequently, the revenue impact on end users is expected to affect the revenues of textile recycling suppliers, which, in turn, impacts the revenues of textile recycling manufacturers. Textile recycling is used in various applications such as apparel, industrial & institutional, and home furnishings. There is an increasing demand for a circular textile economy. Companies like Lenzing AG and Renewcell have already taken steps toward a circular textile economy in their product lines. This development will soon expand the market for textile recycling across all applications.
Source: Secondary Research, Interviews with Experts, MarketsandMarkets Analysis
MARKET DYNAMICS
Level
-
Increasing textile waste due to decreased garment life

-
High emission of greenhouse gases

Level
-
Usage of harmful chemicals

-
High processing cost & poor return on investment

Level
-
Expansion in emerging markets

-
Growing adoption of circular industries

Level
-
Lack of global textile waste traceability systems

-
Fast fashion

Source: Secondary Research, Interviews with Experts, MarketsandMarkets Analysis
Driver: Increasing textile waste due to decreased garment life
The increasing amount of textile waste, which is a result of the declining life of the garments, is among the largest drivers of the growth of the textile recycling industry. The quick production cycle of fast fashion and affordable garments has made consumers purchase additional apparel, but wear each item fewer times before throwing it. In response, millions of tons of textile waste annually are being put into landfills and this in return is developing environmental concerns. This expansion in disposable apparel is a challenge and an opportunity alike, although contributing to unnecessary waste, it also represents a constant, accessible supply for textile recycling mills.
Restraint: Usage of harmful chemicals
The large-scale use of hazardous chemicals in textile production limits the market for textile recycling. Many textiles, particularly those made from synthetic and/or mixed-fiber garments, are treated with dyes, flame retardants, water repellents, and other chemical finishes that are likely either hazardous or non-biodegradable.
Opportunity: Expansion in emerging markets
The emergence of growing markets represents a great opportunity for the textile recycling market because of rapid industrialization, urban population growth, and awareness and interest in sustainability initiatives in the environment. Countries in Asia, Africa, and Latin America are experiencing a rapid growth of textile consumption with growing middle-class populations and increasing demand for fast fashion, which goes together with increases in textile waste.
Challenge: Lack of global textile waste traceability systems
There are currently no global systems for traceability for textile waste. This poses a challenge to the textile recycling market by limiting an effective sorting process and recovery of materials. Ultimately, this complicates closed-loop or circularity in the supply chain. When textiles are discarded, there is no standard format of tracking that would indicate the textile's origin, fiber makeup, chemical treatments, and even usage history. A lack of transparency means recyclers have trouble even determining whether, and what to recycle, especially if they are dealing with blended/ chemically treated fabrics that need to be processed differently to be reused.
Textile Recycling Market: COMMERCIAL USE CASES ACROSS INDUSTRIES
| COMPANY | USE CASE DESCRIPTION | BENEFITS |
|---|---|---|
 |
H&M collects post-consumer garments through in-store take-back programs and invests in chemical recycling technologies like Renewcell to produce Circulose. | Reduces textile waste, secures a sustainable raw material source, enhances brand reputation, and supports closed-loop fashion systems |
 |
Adidas collaborates with partners (e.g., Parley for the Oceans) to create apparel and footwear from recycled polyester and ocean plastic waste. | Limits virgin plastic use, promotes sustainable sportswear, reduces environmental footprint, and engages eco-conscious consumers |
 |
Levi’s incorporates recycled cotton and polyester into denim, while promoting take-back programs for old jeans. | Conserves water and energy, lowers raw cotton dependency, reduces landfill waste, and strengthens sustainability-driven brand value |
 |
Patagonia uses recycled polyester from PET bottles and old garments in outdoor clothing. It also encourages consumers to return old gear for repair or recycling. | Extends product life cycle, builds customer loyalty, reduces environmental harm, and sets industry benchmarks for circular apparel |
Logos and trademarks shown above are the property of their respective owners. Their use here is for informational and illustrative purposes only.
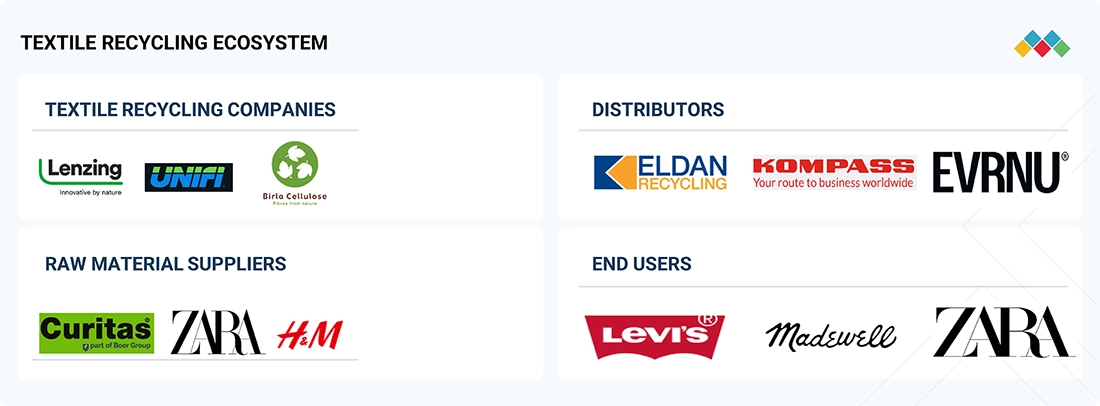
MARKET ECOSYSTEM
The textile recycling ecosystem analysis involves identifying and analyzing interconnected relationships among various stakeholders, including raw material suppliers, manufacturers, distributors, and end users. The raw material is textile waste collected from the environment and the companies, textile waste collection companies include Fashion to Fiber, Curitas BE, H&M, KK Cotton Waste Company, and many others, which is used by the textile recycling manufacturers like Lenzing AG, Worn Again Technologies, Hyosung TNC, and Patagonia Inc. The distributors and suppliers establish contact between the manufacturing companies and end users to streamline the supply chain, increasing operational efficiency and profitability. Major end users include brands such as Zara, H&M, The North Face, and Levi’s.
Logos and trademarks shown above are the property of their respective owners. Their use here is for informational and illustrative purposes only.
MARKET SEGMENTS
Source: Secondary Research, Interviews with Experts, MarketsandMarkets Analysis
Textile Recycling Market, by Material
Polyester and its fiber make up the largest share of the materials segment of the textile recycling market due to their global prevalence, capability for reuse, and substantial compatibility with industrial and commercial reuse operations. As the most widely produced synthetic fiber and accounting for more than half the textile input worldwide, polyester exists in fast fashion, sportswear, and home furnishings, resulting in a large quantity of polyester-based textile waste and a controllable and scalable feedstock for recycling operations.
Textile Recycling Market, by Textile Waste
Post-consumer textile waste represented the largest share of textile waste in the global textile recycling market due to rapidly rising levels of fast fashion, increasing population-wide consumptive behavioral patterns of clothing, and overarching awareness toward environmental sustainability across the global population. As consumers purchase more new (and used) clothing while discarding old ones, proportionately, the post-consumer waste stream is growing significantly.
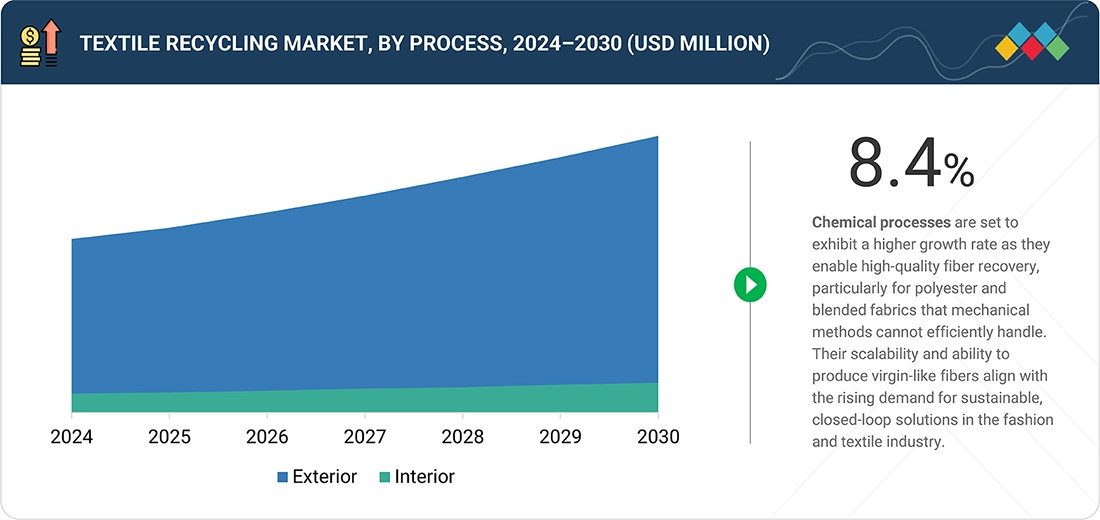
Textile Recycling Market, by Process
The chemical recycling process is set to dominate the textile recycling market segment due to its ability to regenerate high-quality fibers from challenging and complicated textile waste, which represents a significant part of textile waste globally. Chemical recycling can handle more complicated fiber blends—in contrast to mechanical recycling, which on the whole can only use mono-materials, such as cotton or wool, as well as producing lower-grade fibers, chemical recycling will break down the textiles at a molecular level, offering regenerated virgin-quality fibers, such as polyester, nylon, and regenerated cellulose (such as lyocell or viscose). This is especially important for blended fabrics such as cotton-polyester, which cannot be readily recycled when using traditional mechanical recycling.
Textile Recycling Market, by Distribution Channel
Retailers and departmental stores are estimated to account for the largest market share in the distribution channel segment of the textile recycling market due to the presence of physical stores, access to consumers, and the expansion of take-back and circular fashion programs. These stores are often collection points for post-consumer textile waste disposal (assessed by the number of in-store drop-off bins) through various initiatives like recycling initiatives, brand-led take-back initiatives, or incentive programs to encourage recycling. Major apparel and lifestyle retail corporations (retailers), especially retailers with many brick-and-mortar stores, have partnered with recycling firms to create a garment collection program.
Textile Recycling Market, by End-use Industry
Apparel is estimated to account for the largest market share; it produces a significant quantity of textile waste as a global industry, and demand for sustainable clothing continues to grow as consumers transition to more sustainable clothing options. Fast fashion consumptive cycles amount to numerous designs in uncertain quantities of clothing, which is an industry, as disposable fashion apparel, will have a higher post-consumer textile waste contribution, generating a constant and abundant supply of recyclable materials, with the identified purpose of being used as input to produce new clothing.
REGION
Asia Pacific to be fastest-growing region in global textile recycling market during forecast period
The textile recycling market in Asia Pacific is projected to register the highest CAGR during the forecast period, because of its position as the world’s center for textile manufacturing, increasing environmental literacy, and the ability to access both cheap labor and raw material. Countries such as China, Bangladesh, India, and Vietnam are key garment and textile production locations that produce sizeable amounts of pre-consumer textile waste in the form of cutting scraps and defective fabric, which can easily lend themselves to recycling.
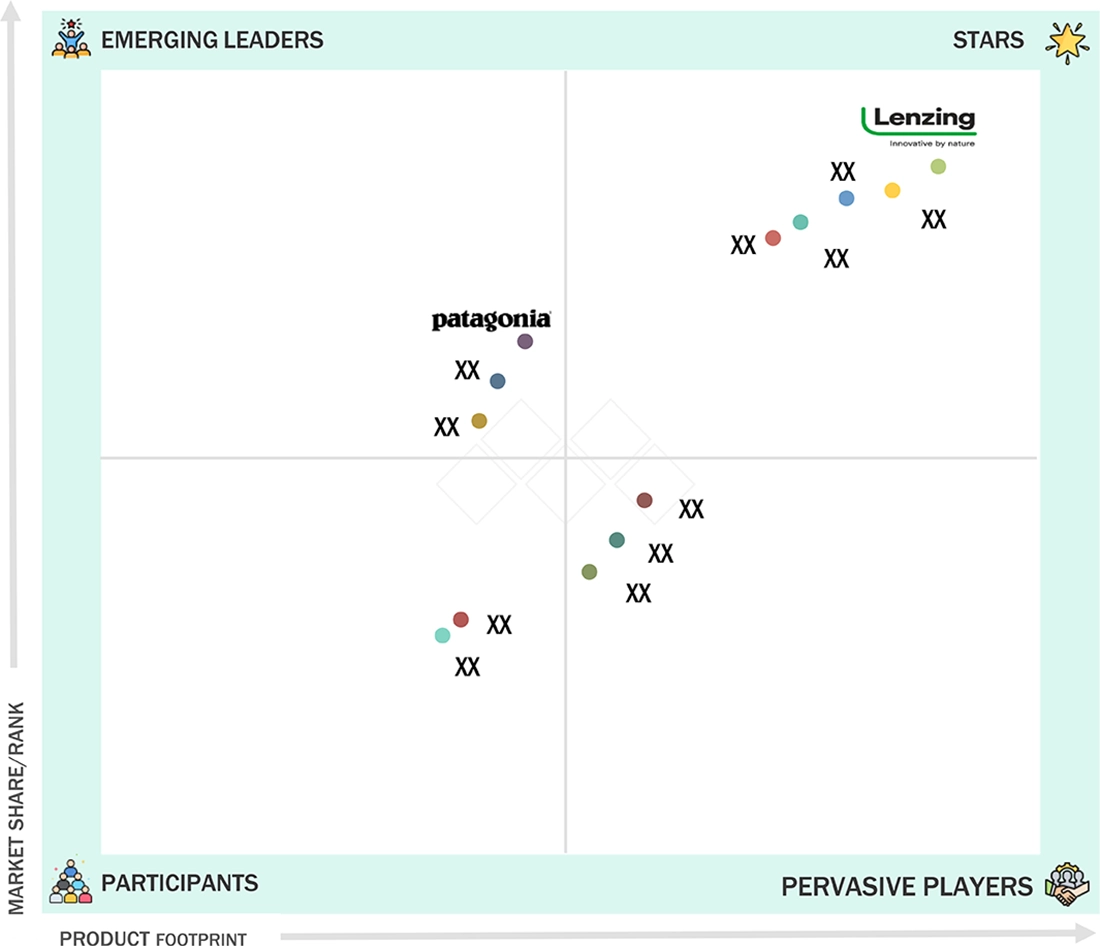
Textile Recycling Market: COMPANY EVALUATION MATRIX
In the textile recycling market matrix, Lenzing AG (Star), an Austrian company, leads the market through its manufacturing and distribution of textiles, nonwovens, and industrial fiber, which find extensive applications in apparel, industrial & institutional, home furnishing, and other end-use industries. Patagonia, Inc. (Emerging Leader) is gaining traction with its technological advancements in recycling. While Lenzing AG dominates with scale, Patagonia shows strong growth potential to advance toward the leaders’ quadrant.
Source: Secondary Research, Interviews with Experts, MarketsandMarkets Analysis
KEY MARKET PLAYERS
MARKET SCOPE
| REPORT METRIC | DETAILS |
|---|---|
| Market Size, 2024 (Value) | USD 7.87 Billion |
| Market Forecast, 2030 (Value) | USD 11.88 Billion |
| Growth Rate | CAGR of 7.2% from 2025 to 2030 |
| Years Considered | 2022–2030 |
| Base Year | 2024 |
| Forecast Period | 2025–2030 |
| Units Considered | Value (USD Million/Billion), Volume (Kiloton) |
| Report Coverage | Revenue forecast, company ranking, competitive landscape, growth factors, and trends |
| Segments Covered | • By Material: Cotton, Polyester & Polyester Fibers, Wool, Nylon & Nylon Fibers, and Other Materials • By Textile Waste: Pre-consumer and Post-consumer • By Process: Mechanical and Chemical • By Distribution Channel: Online Channels and Retail & Departmental Stores • By End-use Industry: Apparel, Industrial & Institutional, Home Furnishings, and Other End-use Industries |
| Regions Covered | North America, Asia Pacific, Europe, South America, Middle East & Africa |
WHAT IS IN IT FOR YOU: Textile Recycling Market REPORT CONTENT GUIDE
DELIVERED CUSTOMIZATIONS
We have successfully delivered the following deep-dive customizations:
| CLIENT REQUEST | CUSTOMIZATION DELIVERED | VALUE ADDS |
|---|---|---|
| Asia Pacific-based textile recycling manufacturers | • Detailed company profiles of textile recycling competitors (financials, product portfolio) • Customer landscape mapping by end-use sector • Assessment of collection, recycling, and government policy ecosystem | • Identified & profiled 20+ textile recycling companies • Track adoption trends in high-growth Asia Pacific industries • Highlight new customer clusters driven by sustainability mandates |
| Benchmarking of textile recycling technologies (mechanical vs. chemical recycling) | • Comparative analysis of technology providers, process efficiency, cost structure, and scalability | • Supported clients in selecting the most cost-effective and sustainable recycling technology |
| US-based textile recycling raw material suppliers | •Detailed profiling of US textile recycling raw material suppliers, including sourcing models (post-consumer waste, industrial scraps, blended fabrics) • Mapping of domestic supply chain ecosystems, covering collectors, processors, recyclers, and end-use industries (apparel, automotive, construction, institutional) | • Identified growth opportunities for raw material suppliers through partnerships with leading US apparel and industrial brands • Competitive positioning support by showcasing supplier strengths in traceability, quality standards, and ESG alignment |
| Apparel-based textile recycling products | • Detailed profiling of apparel brands using recycled textiles (fast fashion, luxury, sportswear, outdoor) • Consumer trend analysis on the adoption of recycled apparel in the US, EU, and Asia Pacific markets • Supply chain assessment of apparel-focused recycling (collection, sorting, processing, and closed-loop systems) | • Identified new growth opportunities in high-demand segments like sportswear and sustainable luxury apparel • Enhanced brand positioning strategies by linking recycled apparel products with eco-labels, certifications, and consumer sustainability demands |
RECENT DEVELOPMENTS
- June 2024 : Lenzing AG and Diane von Fürstenberg collaborated, integrating TENCEL Lyocell and LENZING ECOVERO fibers (both produced from sustainably sourced wood), with a minimum 50% reduction in carbon emissions and water usage into DVF’s fashion collections.
- July 2023 : Birla Cellulose partnered with Renewcell to expand its circular fiber offering, Liva Reviva. Through this collaboration, the company aimed to scale up the textile recycling production to 100,000 tons per annum by 2024 and strengthened its presence in the Swedish market.
- March 2022 : Lenzing AG established its Lyocell plant in Thailand, with a capacity of 100,000 tons per year, investing around USD 414.34 million. With this, Lenzing targeted a carbon dioxide emission reduction (per ton) of product by 50% by 2030 and to be climate neutral by 2050.
Table of Contents
 Exclusive indicates content/data unique to MarketsandMarkets and not available with any competitors.
Methodology
The study involves two major activities in estimating the current market size for the textile recycling market. Exhaustive secondary research was done to collect information on the market, peer, and parent markets. The next step was to validate these findings, assumptions, and sizing with industry experts across the value chain through primary research. Both top-down and bottom-up approaches were employed to estimate the complete market size. After that, market breakdown and data triangulation were used to estimate the market size of segments and subsegments.
Secondary Research
Secondary sources for this research study include financial statements of companies offering textile recycling and information from various trade, business, and professional associations. Secondary research has been used to obtain critical information about the industry’s value chain, the pool of key players, market classification, and segmentation according to industry trends to the bottom-most level and regional markets. The secondary data was collected and analyzed to arrive at the overall size of the textile recycling market, which was validated by primary respondents.
Primary Research
Extensive primary research was conducted after obtaining information regarding the textile recycling market scenario through secondary research. Several primary interviews were conducted with market experts from both the demand and supply sides across major countries of North America, Europe, Asia Pacific, the Middle East & Africa, and South America. Primary data was collected through questionnaires, emails, and telephonic interviews. The primary sources from the supply side included various industry experts, such as Chief X Officers (CXOs), Vice Presidents (VPs), Directors from business development, marketing, product development/innovation teams, and related key executives from textile recycling industry vendors; material providers; distributors; and key opinion leaders. Primary interviews were conducted to gather insights such as market statistics, data on revenue collected from the products and services, market breakdowns, market size estimations, market forecasting, and data triangulation. Primary research also helped in understanding the various trends related to material, textile waste, process, distribution channel, end-use industry, and region. Stakeholders from the demand side, such as CIOs, CTOs, CSOs, and installation teams of the customer/end users who are seeking textile recycling services, were interviewed to understand the buyer’s perspective on the suppliers, products, component providers, and their current usage of textile recycling and future outlook of their business which will affect the overall market.
The Breakup of Primary Research:

To know about the assumptions considered for the study, download the pdf brochure
Market Size Estimation
The research methodology used to estimate the size of the textile recycling market includes the following details. The market sizing was undertaken from the demand side. The market was upsized based on the demand for textile recycling in different end-use industries at a regional level. Such procurements provide information on the demand aspects of the textile recycling industry for each end-use industry. For each end-use industry, all possible segments of the textile recycling market were integrated and mapped.

Data Triangulation
After determining the overall size from the market size estimation process outlined above, the total market was divided into several segments and subsegments. The data triangulation and market breakdown methods described below were used, where applicable, to complete the overall market analysis and determine precise statistics for various market segments and subsegments. The data was triangulated by examining various factors and trends from both the demand and supply sides. Additionally, the market size was validated using both top-down and bottom-up approaches.
Market Definition
Textile recycling is the process of recovering fibers, fabrics, and finished garments from post-industrial or post-consumer textile waste and reprocessing them into usable raw materials for new products. This includes mechanical recycling (e.g., shredding into fibers), chemical recycling (breaking down fibers at the molecular level), and reuse of textiles in their original form. The primary goal is to reduce landfill waste, minimize environmental impact, and promote a circular economy by extending the life cycle of textile materials through sustainable recovery and reintegration into the production chain.
Stakeholders
- Textile Recycling Manufacturers
- Textile Recycling Distributors and Suppliers
- End-use Industries
- Universities, Governments, and Research Organizations
- Associations and Industrial Bodies
- R&D Institutes
- Environmental Support Agencies
- Investment Banks and Private Equity Firms
- Research and Consulting Firms
Report Objectives
- To define, describe, and forecast the textile recycling market size in terms of volume and value
- To provide detailed information regarding the key factors, such as drivers, restraints, opportunities, and challenges influencing market growth
- To analyze and project the global textile recycling market, by material, textile waste, process, distribution channel, end-use industry, and region
- To forecast the market size in five main regions (along with country-level data), namely, North America, Europe, Asia Pacific, Middle East & Africa, and South America, and analyze the significant region-specific trends
- To strategically analyze micromarkets with respect to individual growth trends, prospects, and contributions of the submarkets to the overall market
- To analyze the market opportunities and the competitive landscape for stakeholders and market leaders
- To assess recent market developments and competitive strategies, such as agreements, contracts, acquisitions, and new product developments/new product launches, to draw the competitive landscape
- To strategically profile the key market players and comprehensively analyze their core competencies
Key Questions Addressed by the Report
Who are the major companies in the textile recycling market? What key strategies have market players adopted to strengthen their market presence?
Key players include Lenzing AG (Austria), Birla Cellulose (India), HYOSUNG TNC (South Korea), Unifi, Inc (US), Renewcell (Sweden), Patagonia, Inc (US), Leigh Fibers (US), Martex Fiber (US), The Woolmark Company (Australia), Textile Recycling International (UK), and Boer Group (Netherlands).
What are the drivers and opportunities for the textile recycling market?
Rising textile waste from shorter garment lifespans, environmental concerns like greenhouse gas emissions and water usage, and increasing adoption of circular industries—especially in emerging markets.
Which region is expected to hold the largest market share?
Asia Pacific is expected to lead the market, driven by its strong industrial base, strict regulations, and major textile-producing economies.
What is the projected growth rate of the textile recycling market over the next five years?
The market is projected to register a CAGR of 7.2% during the forecast period.
How is the textile recycling market aligned for future growth?
The market is growing steadily, with numerous regional players expanding their production capacities and implementing business strategies to support industry demand.
Need a Tailored Report?
Customize this report to your needs
Get 10% FREE Customization
Customize This ReportPersonalize This Research
- Triangulate with your Own Data
- Get Data as per your Format and Definition
- Gain a Deeper Dive on a Specific Application, Geography, Customer or Competitor
- Any level of Personalization
Let Us Help You
- What are the Known and Unknown Adjacencies Impacting the Textile Recycling Market
- What will your New Revenue Sources be?
- Who will be your Top Customer; what will make them switch?
- Defend your Market Share or Win Competitors
- Get a Scorecard for Target Partners

Custom Market Research Services
We Will Customise The Research For You, In Case The Report Listed Above Does Not Meet With Your Requirements
Get 10% Free CustomisationTESTIMONIALS

We at Nissan Chemicals Corporation have been clients of MarketsandMarkets for more than a year now. We recently consulted MarketsandMarkets for a study, the team at MarketsandMarkets was extremely professional and organized. The business insights were very detailed and aligned well with our expectations that really helped us formulate the Business Plans and device new strategies for development themes. MarketsandMarkets offers a unique combination of expertise and dedicated engagement model. Their research findings have helped us in designing our Pricing Strategy which will make it easier for us to predict the future sales and profits for the next ten years. We look forward to working with MarketsandMarkets in the future.
VP of Strategy & New Business Development
Leading Specialty Chemical Company
The MarketsandMarkets Engagement Model, composed of both the Knowledge Store and advisory custom research, has greatly helped us in understanding our markets and making strategic decisions. The Knowledge Store is a fast way to allow everyone in our organization to understand more about most any market they are interested in. The ability to then get custom research done and get answers to specific strategic questions and market insight has been spectacular. The Markets and Markets team feel more like colleagues than vendors and their services have helped us change our culture where statements of things like growth opportunities and competitive position are always backed by industry research.

Rich Gibson,
Director, Corporate Strategy
Milliken & Company,
Leading Industrial Manufacturer of specialty chemical, floor covering, performance and protective textile materials, and healthcaremilliken.com
MarketsandMarkets is a trusted resource that helps us to better understand markets that are near-adjacencies-whether its technology, value chain or geography. Their Knowledge Store platform provides a dashboard of markets and their characteristics which is easy to use and saves us time.
Adam Shaw,
Market Development and Strategy Manager
AdvanSix Inc. USA,
An American Leader in Chemicalswww.advansix.com
The Knowledge Store from MarketsandMarkets is a valuable tool which has helped my team acquire greater insight in to the end markets that our business serves. This has enabled us to help our company build stronger strategies throughout our planning process.
TOSHIO KINOSHITA
Senior Chif Consultion Research & Consulting Division
Mitsubishi Chemical Research Corporation,
Leading Manufacturer of Chemical Productswww.mitsubishichem-res.co.jp/en/

We recently engaged with MarketsandMarkets for a study, the team not only clearly understood our business objectives but was also extremely professional in the way they handled the entire project. The study was efficiently conducted in a phase-wise manner, and the engagement model furnished us with high-quality business insights that far exceeded our expectations at each phase. We were especially happy that MarketsandMarkets could provide us with both, an English as well as a Japanese version of the study. A special thanks to the Analyst Team and Client Services Team, whose fluency in Japanese enhanced our comfort level, as we could converse with them in our preferred language.
Independent entrepreneurs
Arrow Precision
We approached MarketsandMarkets for study on Proppants Market, and their work exceeded our expectations. The study conducted was comprehensive and enabled us to view the market through the various dimensions. In addition, the team was extraordinarily responsive throughout the process and resolved our queries on time. I strongly recommend MarketsandMarkets and will certainly consider them for additional market assessments we will need in the future.
Global engineering company, Japan
Deputy Manager,
Strategic Planning OfficeThe high-quality insights shared by the MarketsandMarkets team helped us understand the pharmaceutical plant designers in a specific geography. It also captured the risks that we may likely face in communicating with our potential partners. The study would enable us identify partners, which would impact our future growth.


Growth opportunities and latent adjacency in Textile Recycling Market