Top 10 High Growth Composite Material Market by Resin Type (Thermosetting Resin, Thermoplastic Resin), Fiber Type (Carbon, Glass, Aramid), Application (Aerospace & Defense, Wind Energy, Transportation, Sporting Goods), and Region - Global Forecasts to 2021


[213 Pages Report] The Top 10 High Growth Composite Material Market is estimated to grow from USD 69.50 Billion in 2015 to USD 105.26 Billion by 2021, at a CAGR of 7.04% between 2016 and 2021. The base year considered for the study is 2015 and the market size is projected from 2016 to 2021. The report estimates the market size and future growth potential of the top 10 high growth composite materials market across different segments such as fiber type, resin type, manufacturing process, application, and region. A shift in the trend from traditional materials towards composites is witnessed, due to their excellent performance properties, such as high thermal conductivity, corrosion resistance, and high strength, among others. Aerospace & defense is a major application segment and is projected to drive the market during the forecast period.
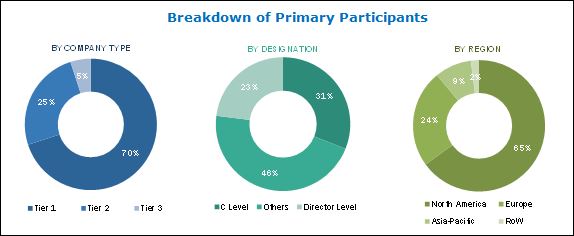
The research methodology used to estimate and forecast the top 10 composite material market began with capturing data on key company revenues and raw material costs through secondary research. The product offerings were taken into consideration to determine the market segmentation. The bottom-up procedure was employed to arrive at the overall market size of top 10 composite material from the revenue of key players in the market. After arriving at the overall market size, the total market was split into several segments and sub-segments, which were then verified through primary research by conducting extensive interviews with key officials such as CEOs, VPs, directors, and other executives. Data triangulation and market breakdown procedures were employed to complete the overall market engineering process and arrive at the exact statistics for all segments and sub-segments. The breakdown of profiles of primary discussion participants is depicted in the below figure:
To know about the assumptions considered for the study, download the pdf brochure
The top 10 composite material value chain comprises manufacturers, such as Hexcel Corporation (U.S.), Huntsman Corporation (U.S.), Toray Industries (Japan), Teijin Limited (Japan), Owens Corning (U.S.), and so on. The target end users for these companies can be categorized as automotive, aerospace, construction, and wind energy related companies, such as BMW (Germany), Ford (U.S.), Bell Helicopter (U.S.), Boeing (U.S.), Mercedes-Benz (Germany), and Vestas (Denmark) among others.
Target Audience
- Composites Manufacturers
- Raw Material Suppliers
- Distributors & Suppliers
- End-use Industries
- Industry Associations
- Investment Research Firms
�This study answers several questions for stakeholders, primarily which market segments to focus on in the next two to five years for prioritizing their efforts and investments.�
Scope of the Report
The research report segments the composites market into the following segments:
By Material Type:
- Carbon Fiber Reinforced Plastics (CFRP)
- Core Materials
- Ceramic Matrix Composites
- Prepreg
- High Temperature Composites Materials
- Pultrusion
- LFT Composites
- Natural Fiber Composites
- SMS and BMC
- Composite Resin
Available Customizations
Along with the given market data, MarketsandMarkets offers customizations according to the company�s specific needs. The following customization options are available for the report:
The market for top 10 high growth composite materials is estimated to grow from USD 69.50 Billion in 2015 to USD 105.26 Billion by 2021, at a CAGR of 7.04% during the forecast period. The top 10 composite materials market is expected to witness growth, due to high demand from the wind energy & other emerging application industries, such as electrical & electronics and transportation, as the use of composites leads to reduced overall weight and increased component strength.
The major applications of top 10 composite material include aerospace & defense, transportation, wind energy, construction & infrastructure, pipes & tanks, marine, and electricals & electronics. Wind energy is the fastest-growing application segment of the top 10 composite materials market during the forecast period. The properties of composites, such as shape stability, strength, damage resistance, and longitudinal stiffness, have resulted in their increased use in the wind energy application. The aerospace & defense segment led the top 10 high growth composite materials market, as various components in aircraft such as radomes, flooring, and so on require high-performance composite materials.
This market has also been segmented on the basis of fiber type, resin type, manufacturing process, application, and region.
The carbon fiber reinforced plastics type segment has been further into two types, namely, thermoset CFRP and thermoplastic CFRP composites. Thermosetting and thermoplastic resins are used as matrix to produce carbon composites. The thermosetting CFRP segment is expected to lead the carbon fiber reinforced plastics segment, due to the high resistance to heat and temperature of thermosetting CFRP.
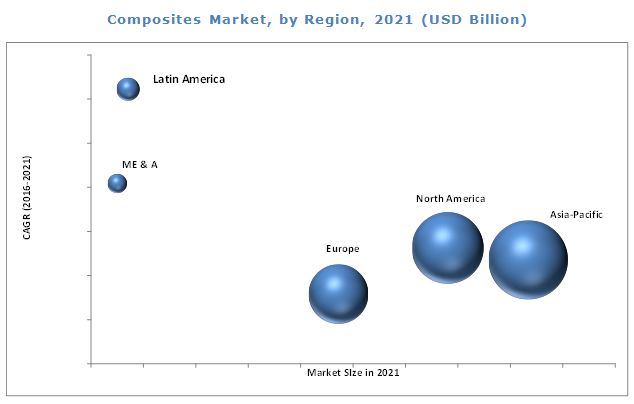
Asia-Pacific is estimated to be the largest consumer of composites. The growth of the electricals & electronics and construction & infrastructure industries and improved transportation facilities in the region have led to an increase in the demand for composites. China, India, Sweden, the U.K., the U.S., Brazil, and Malaysia are among the major markets of composites.
The composites market is capital intensive and hence the entry barriers are high in this market. The existing players have a strong foothold in the market.
Hexcel Corporation (U.S.), Hexion Inc. (U.S.), Owens Corning (U.S.), Strongwell Corporation (U.S.), Toray Industries Inc. (Japan), and Teijin Limited (Japan) are some of the leading players in the composites market. Owens Corning (U.S.) is one of the key manufacturers of composites that offers SMC/BMC rovings, panel roving, roving for chopping, rovings for filament winding, chopped strand mat, high performance glass fibers, Cem-FIL alkali-resistant glass fibers, and so on. The company has increased investments year-on-year in R&D to develop new products, new production capabilities, and processes. As a part of its growth strategy, the company is focused on expansion of its capacity to cater to the increasing demand of composites.
To speak to our analyst for a discussion on the above findings, click Speak to Analyst
 Exclusive indicates content/data unique to MarketsandMarkets and not available with any competitors.
Table of Contents
1 Introduction: Composites Material (Page No. - 18)
2 Research Methodology: Composites Material (Page No. - 19)
2.1 Research Data
2.1.1 Key Industry Insights
2.1.2 Breakdown of Primary Interviews
2.2 Market Size Estimation
2.2.1 Bottom-Up Approach
2.2.2 Top-Down Approach
2.3 Data Triangulation
3 Carbon Fiber Reinforced Plastics (CFRP) Market (Page No. - 24)
3.1 Introduction of CFRP
3.1.1 Market Definition
3.1.2 Markets Scope
3.2 Executive Summary
3.2.1 CFRP Market Size, in Terms of Value, 2021
3.3 Market Overview
3.3.1 Market Dynamics (DROC)
3.3.2 Porter�s Five Forces Analysis
3.4 CFRP Market, By Resin Type
3.5 CFRP Market By Application
3.6 CFRP Market By Region
3.7 CFRP Competitive Landscape
(Overview, Financial*, Products & Services, Strategy, and Developments)
3.8 CFRP Company Profile: Toray Industries Inc.
3.9 CFRP Company Profile: Teijin Limited
*Details Might Not Be Captured in Case of Unlisted Companies.
4 Core Materials Market (Page No. - 43)
4.1 Introduction of Core Material
4.1.1 Market Definition
4.1.2 Markets Scope
4.2 Executive Summary
4.3 Market Overview
4.3.1 Market Dynamics(DROC)
4.3.2 Porter�s Five Forces Analysis
4.4 Core Material Market By Type
4.5 Core Materials Market, By End-Use Industry
4.6 Core Materials Market, By Region
4.7 Competitive Landscape
(Overview, Financial*, Products & Services, Strategy, and Developments)
4.8 Company Profile: Diab Group (RATOS)
4.9 Company Profile: Hexcel Corporation
*Details Might Not Be Captured in Case of Unlisted Companies.
5 Ceramic Matrix Composites Market (Page No. - 64)
5.1 Introduction of Ceramic Matrix Composites
5.1.1 Market Definition
5.1.2 Markets Scope
5.2 Executive Summary
5.2.1 Ceramic Matrix Composites Market Size, By Value
5.3 Market Overview
5.3.1 Market Dynamics (DROC)
5.3.2 Porter�s Five Forces Analysis
5.4 Ceramic Matrix Composites Market, By Matrix Type
5.5 Ceramic Matrix Composites Market Size, By Application
5.6 Regional Analysis
5.7 Competitive Landscape
*Details Might Not Be Captured in Case of Unlisted Companies.
5.8 Company Profile: General Electric Company
5.9 Company Profile: Rolls-Royce PLC.
*Details Might Not Be Captured in Case of Unlisted Companies.
6 Prepreg Market (Page No. - 81)
6.1 Introduction of Prepreg
6.1.1 Market Definition
6.1.2 Market Scope
6.2 Executive Summary
6.3 Market Overview
6.3.1 Market Dynamics (DROC)
6.3.2 Porter�s Five Forces Analysis
6.4 Prepreg Market, By Type of Fiber Reinforcement
6.5 Prepreg Market, By Resin Type
6.6 Prepreg Market, By Application
6.7 Prepreg Market By Region
6.8 Competitive Landscape
(Overview, Financial*, Products & Services, Strategy, and Developments)
6.9 Company Profile: Solvay Group (Cytec Industries, Inc.)
6.10 Company Profile: Hexcel Corporation
*Details Might Not Be Captured in Case of Unlisted Companies.
7 High Temperature Composite Materials Market (Page No. - 103)
7.1 Introduction of High Temperature Composite Materials
7.1.1 Market Definition
7.1.2 Market Scope
7.2 Executive Summary
7.3 Market Overview
7.3.1 Market Dynamics (DROC)
7.3.2 Porter�s Five Forces Analysis
7.4 High-Temperature Composites Market, By Temperature Range
7.5 High-Temperature Composite Materials Market, By Matrix System
7.6 High-Temperature Composite Materials Market, By Application
7.7 High-Temperature Composirte Materials Market, By Region
7.8 Competitive Landscape
(Overview, Financial*, Products & Services, Strategy, and Developments)
7.9 Company Profile: Hexion Inc.
7.10 Company Profile: Renegade Materials Corporation
*Details Might Not Be Captured in Case of Unlisted Companies.
8 Pultrusion Market (Page No. - 121)
8.1 Introduction of Pultrusion
8.1.1 Market Definition
8.1.2 Markets Scope
8.2 Executive Summary
8.3 Market Overview
8.3.1 Market Dynamics (DROC)
8.3.2 Porter�s Five Forces Analysis
8.4 Pultrusion Market By Fiber Type
8.5 Pultrusion Market, By Resin Type
8.6 Pultrusion Marekt, By Application
8.7 Pultrusion Marekt, By Region
8.8 Competitive Landscape
(Overview, Financial*, Products & Services, Strategy, and Developments)
8.9 Company Profile: Strongwell Corporation
8.10 Company Profile: Exel Composites
*Details Might Not Be Captured in Case of Unlisted Companies.
9 LFT Composites Market (Page No. - 140)
9.1 Introduction to LFT Composites
9.1.1 Market Definition
9.1.2 Market Scope
9.2 Executive Summary
9.3 Market Overview
9.3.1 Market Dynamics
9.3.2 Porter�s Five Forces Analysis
9.4 LFT Composites Market Size, By Resin Type
9.5 LFT Composites Market, By Fiber Type
9.6 LFT Composites Market Size, By Application
9.7 LFT Composites Market Size, By Region
9.8 Competitive Landscape
(Overview, Financial*, Products & Services, Strategy, and Developments)
9.9 Company Profile: Celanese Corporation
9.10 Company Profile: Polyone
*Details Might Not Be Captured in Case of Unlisted Companies.
10 Natural Fiber Composites Market (Page No. - 157)
10.1 Introduction of Natural Fiber Composites
10.1.1 Market Definition
10.1.2 Markets Scope
10.2 Executive Summary
10.3 Market Overview
10.3.1 Market Dynamics
10.3.2 Porter�s Five Forces Analysis
10.4 Natural Fiber Composites Market Size, By Type
10.5 Natural Fiber Composites Market Size, By Application
10.6 Natural Fiber Composites Market Size, By Region
10.7 Competitive Landscape
(Overview, Financial*, Products & Services, Strategy, and Developments)
10.8 Company Profile: Upm Biocomposites
10.9 Company Profile: Weyerhaeuser Company
*Details Might Not Be Captured in Case of Unlisted Companies.
11 SMC and BMC Market (Page No. - 174)
11.1 Introduction to SMC and BMC
11.1.1 Market Definition
11.1.2 Markets Scope
11.2 Executive Summary
11.3 Market Overview
11.3.1 Market Dynamics (DROC)
11.3.2 Porter�s Five Forces Analysis
11.4 SMC and BMC Market, By Fiber Type
11.5 SMC and BMC Market Size, By Resin Type
11.6 SMC and BMC Market Size, By Application
11.7 SMC and BMC Market, By Region
11.8 Competitive Landscape
(Overview, Financial*, Products & Services, Strategy, and Developments)
11.9 Company Profile: Idi Composites International
11.10 Company Profile: Citadel Plastics Holdings Inc.
*Details Might Not Be Captured in Case of Unlisted Companies.
12 Composite Resin Market (Page No. - 193)
12.1 Intruduction to Composite Resin
12.1.1 Market Defination
12.1.2 Markets Scope
12.2 Executive Summary
12.3 Composite Resin Market Size (Value)
12.4 Market Overviwew
12.4.1 Market Dynamics(DROC)
12.4.2 Porter�s Five Forces Analysis
12.5 Composites Resin Market, By Resin Type
12.6 Thermoset Composites Resin Market, By Application
12.7 Thermoset Composites Resin Market, By Region
12.8 Competitive Landscape
(Overview, Financial*, Products & Services, Strategy, and Developments)
12.9 Composite Resin Company Profiles: Huntsman Corporation
12.10 Hexion Inc.
*Details Might Not Be Captured in Case of Unlisted Companies.
13 Appendix (Page No. - 211)
13.1 Knowledge Store: Marketsandmarkets Subscription Portal
13.2 Author Details
List of Tables (80 Tables)
Table 1 CFRP Market Size (Volume & Value), 2014�2021
Table 2 CFRP Market Size, By Type, 2014�2021 (USD Million)
Table 3 CFRP Market Size, By Type, 2014�2021 (Kiloton)
Table 4 CFRP Market Size ,By Application Industry, 2014�2021 (USD Million)
Table 5 CFRP Market Size, By Application Industry, 2016�2021 (Kiloton)
Table 6 CFRP Market Size, By Region, 2014�2021 (USD Million)
Table 7 CFRP Market Size, By Region, 2014�2021 (Kiloton)
Table 8 Toray Industries Inc.: Product and Their Applications
Table 9 Teijin Limited: Product and Their Applications:
Table 10 Core Materials Market Size, 2014�2021
Table 11 Core Materials Market Size, By Type, 2014�2021 (USD Million)
Table 12 Core Materials Market Size, By Type, 2014�2021 (Kiloton)
Table 13 Core Materials Market Size, By End-Use Industry, 2014�2021 (USD Million)
Table 14 Core Materials Market Size, By End-Use Industry, 2014�2021 (Kiloton)
Table 15 Core Materials Market Size, By Region, 2014�2021 (USD Million)
Table 16 Core Materials Market Size, By Region, 2014�2021 (Kiloton)
Table 17 Global Ceramic Matrix Composites Market Size, 2014�2021 (USD Million and Kiloton)
Table 18 Ceramic Matrix Composites Market Size, By Matrix Type, 2014�2021 (USD Million)
Table 19 Ceramic Matrix Composites Market Size, By Matrix Type, 2014�2021 (Kiloton)
Table 20 Ceramic Matrix Composites Market Size, By Application, 2014�2021 (USD Million)
Table 21 Ceramic Matrix Composites Market Size, By Application, 2014�2021 (Kiloton)
Table 22 Ceramic Matrix Composites Market Size, By Region, 2014�2021 (USD Million)
Table 23 Ceramic Matrix Composites Market Size, By Region, 2014�2021 (Kiloton)
Table 24 Global Prepreg Market Size, (Kiloton) & (USD Million), 2014�2021
Table 25 Prepreg Market Size, By Type of Fiber Reinforcement, 2014�2021 (USD Million)
Table 26 Prepreg Market Size, By Type of Fiber Reinforcement, 2014�2021 (Kiloton)
Table 27 Prepreg Market Size, By Type of Resin, 2014�2021 (USD Million)
Table 28 Prepreg Market Size, By Type of Resin, 2014�2021 (Kiloton)
Table 29 Prepreg Market Size, By Application, 2014�2021 (USD Million)
Table 30 Prepreg Market Size, By Application, 2014�2021 (Kiloton)
Table 31 Prepreg Market Size, By Region, 2014�2021 (USD Million)
Table 32 Prepreg Market Size, By Region, 2014�2021 (Kiloton)
Table 33 High-Temperature Composite Materials Market Size (Volume and Value), 2016-2021
Table 34 High-Temperature Composite Materials Market Size, By Temperature Range, 2014�2021 (USD Million)
Table 35 High-Temperature Composite Materials Market Size, By Temperature Range, 2014�2021 (Kiloton)
Table 36 High-Temperature Composite Materials Market, By Matrix System, 2014�2021 (USD Million)
Table 37 High-Temperature Composite Materials Market, By Matrix System, 2014�2021 (Kiloton)
Table 38 High-Temperature Composite Materials Market Size, By Application, 2014�2021 (USD Million)
Table 39 High-Temperature Composite Materials Market Size, By Application, 2014�2021 (Kiloton)
Table 40 High-Temperature Composite Materials Market Size, By Region, 2014�2021 (USD Million)
Table 41 High-Temperature Composite Materials Market Size, By Region, 2014�2021 (Kiloton)
Table 42 Pultrusion Market Size (Volume & Value), 2014�2021
Table 43 Pultrusion Market Size, By Fiber Type, 2014-2021 (Kiloton)
Table 44 Pultrusion Market Size, By Fiber Type, 2014-2021 (USD Million)
Table 45 Pultrusion Market Size, By Resin Type, 2016-2021 (Kilotons)
Table 46 Pultrusion Market Size, By Application, 2014-2021 (USD Million)
Table 47 Pultrusion Market Size, By Application, 2014-2021 (Kilotons)
Table 48 Pultrusion Market Size, By Application, 2014-2021 (USD Million)
Table 49 Pultrusion Market Size, By Region, 2014-2021 (Kilo Ton)
Table 50 Pultrusion Market Size, By Region, 2014-2021 (USD Million)
Table 51 LFT Composites Market Size, 2014�2021
Table 52 LFT Composites Market Size, By Resin Type, 2014�2021 (USD Million)
Table 53 LFT Composites Market Size, By Resin Type, 2014�2021 (Ton)
Table 54 LFT Composites Market Size, By Fiber Type, 2014�2021 (USD Million)
Table 55 LFT Composites Market Size, By Fiber Type, 2014�2021 (Ton)
Table 56 LFT Composites Market Size, By Application, 2014�2021 (USD Million)
Table 57 LFT Composites Market Size, By Application, 2014�2021 (Ton)
Table 58 LFT Composites Market Size, By Region, 2014�2021 (USD Million)
Table 59 LFT Composites Market Size, By Region, 2014�2021 (Ton)
Table 60 Natural Fiber Composites Market Size, By Type, 2014�2021 (USD Million)
Table 61 Natural Fiber Composites Market Size, By Type, 2014�2021 (USD Million)
Table 62 Natural Fiber Composites Market Size, By Application, 2014�2021 (USD Million)
Table 63 Natural Fiber Composites Market Size, By Region, 2014�2021 (USD Million)
Table 64 SMC and BMC Market Size, By Value (USD Million), 2014-2021
Table 65 SMC and BMC Market Size, By Volume (Kilotons) 2014-2021
Table 66 SMC and BMC Market Size, By Fiber Type,2014-2021 (Kiloton)
Table 67 SMC and BMC Market Size, By Fiber Type, 2014-2021 (USD Million)
Table 68 SMC and BMC Market Size, By Resin Type, 2014-2021 (Kiloton)
Table 69 SMC and BMC Market Size, By Resin Type, 2014-2021 (USD Million)
Table 70 SMC Market Size, By Application, 2014-2021 (Kiloton)
Table 71 SMC Market Size, By Application, 2014-2021 (USD Million)
Table 72 BMC Market Size, By Application, 2014-2021 (Kiloton)
Table 73 BMC Market Size, By Application, 2014-2021 (USD Million)
Table 74 SMC and BMC Market Size, By Region, 2014-2021 (Kiloton)
Table 75 SMC and BMC Market Size, By Region, 2014-2021 (USD Million)
Table 76 Composite Resin Market Size, 2014�2021
Table 77 Composite Resin Market Size, By Resin Type, 2014�2021 (USD Million)
Table 78 Composite Resin Market Size, By Resin Type, 2014�2021 (Kiloton)
Table 79 Composite Resin Market Size, By Application, 2014�2021 (USD Million)
Table 80 Composite Resin Market Size, By Application, 2014�2021 (Kiloton)
List of Figures (129 Figures)
Figure 1 Market Size Estimation Methodology: Bottom-Up Approach
Figure 2 Market Size Estimation Methodology: Top-Down Approach
Figure 3 Data Triangulation Methodology
Figure 4 Cf and CFRP: Market Segmentation
Figure 5 Attractive Opportunities in The CFRP Market, 2016�2021
Figure 6 North America Dominated The CFRP Market, By Volume, 2015
Figure 7 Drivers, Restraints, Opportunities, and Challenges in The Cf and CFRP Market
Figure 8 Porter�s Five Forces: Intensity of Rivalry is High Due to Presence of Few Players
Figure 9 Thermosetting CFRP Dominate The CFRP Market, 2016 vs 2021
Figure 10 Automotive Industry Application to Outpace Other Indutries Application in Growth, 2016 vs 2021
Figure 11 China is Projected to Register The Highest Growth Rate in The CFRP Market, 2016�2021
Figure 12 Companies Adopted Agreements, Joint Ventures & Collaborations, and Expansions as The Key Growth Strategies Between 2011 and 2015
Figure 13 Toray Industries Inc.: Company Snapshot
Figure 14 Toray Industries Inc.: SWOT Analysis
Figure 15 Teijin Limited: Company Snapshot
Figure 16 Teijin Limited: SWOT Analysis
Figure 17 Core Materials: Market Segmentation
Figure 18 Attractive Opportunities in The Core Materials Market
Figure 19 Asia-Pacific to Be The Fastest-Growing Market for Core Materials
Figure 20 Drivers, Restraints, Opportunities, and Challenges of The Core Materials Market
Figure 21 Porter�s Five Forces Analysis of The Core Materials Market
Figure 22 Types of Core Materials
Figure 23 Foam to Be The Fastest-Growing Type in The Core Materials Market
Figure 24 Aerospace to Be The Largest and Wind Energy The Fastest-Growing End-Use Industries
Figure 25 Brazil is Expected to Drive The Core Materials Market (2016�2021)
Figure 26 Agreements, Partnerships & Joint Ventures is The Most Preferred Growth Strategy Adopted By Major Players Between 2011 and 2016
Figure 27 Diab Group: Business Overview
Figure 28 Diab Group: SWOT Analysis
Figure 29 Hexcel Corporation: Business Overview
Figure 30 Hexcel Corporation: SWOT Analysis
Figure 31 Ceramic Matrix Composites Market Segmentation
Figure 32 Attractive Opportunities in The Ceramic Matrix Composites Market
Figure 33 North America to Be The Largest and Fastest-Growing Ceramic Matrix Composites Market
Figure 34 Factors Governing The Ceramic Matrix Composites Market
Figure 35 Porter�s Five Forces Analysis: Ceramic Matrix Composites Market
Figure 36 SIC/SIC Matrix Type to Dominate The Ceramic Matrix Composites Market, By Value
Figure 37 Aerospace & Defense to Outpace Other Applications of Ceramic Matrix Composites
Figure 38 France to Witness The Highest CAGR in The Ceramic Matrix Composites Market
Figure 39 Companies Adopted Investments & Expansions, Acquisitions, and Agreements/Partnerships/Joint Ventures as The Key Growth Strategies Between 2012 and 2016
Figure 40 General Electric Company: Company Snapshot
Figure 41 General Electric Company: SWOT Analysis
Figure 42 Rolls-Royce PLC.: Company Snapshot
Figure 43 Rolls-Royce PLC.: SWOT Analysis
Figure 44 Prepreg Market Segmentation
Figure 45 Double Digit Growth Expected in The Global Prepreg Market Between 2016 and 2021
Figure 46 Prepreg Market Share, By Region
Figure 47 Drivers, Restraints, Opportunities, and Challenges in The Prepreg Market
Figure 48 Porter�s Five Forces Analysis: Intensity of Rivalry is High Due to Presence of Key Players
Figure 49 Carbon Fiber Prepreg to Grow at The Highest CAGR as Compared to Other Fiber Prepregs, 2016 vs 2021
Figure 50 Thermoset Prepreg to Dominate The Prepreg Market During The Forecast Period
Figure 51 Aerospace & Defense Application to Outpace Other Applications, 2016 vs 2021
Figure 52 Asia-Pacific is Expected to Drive The Prepreg Market, 2016�2021
Figure 53 Companies Adopted New Product Developments and Agreements & Partnerships as The Key Growth Strategies Between 2011 and 2015
Figure 54 Solvay Group: Company Snapshot
Figure 55 Solvay Group: SWOT Analysis
Figure 56 Hexcel Corporation: Company Snapshot
Figure 57 Hexcel Corporation: SWOT Analysis
Figure 58 High-Temperature Composite Materials Market Segmentation
Figure 59 Attractive Opportunities in High-Temperature Composite Materials Market
Figure 60 North America Dominated The High-Temperature Composite Materials Market in 2015
Figure 61 Drivers, Restraints, Opportunities, and Challenges in High-Temperature Composite Market
Figure 62 Porter�s Five Forces: Intensity of Rivalry is High Due to Presence of Few Players
Figure 63 CMC Materials to Lead The High-Temperature Composite Materials Market (USD Million)
Figure 64 Aerospace & Defense is Projected to Be The Leading Application in High Temperature Composite Materials Market 2016 vs 2021,
Figure 65 India and U.S.To Drive The High-Temperature Composite Materials High-Temperature Composite Materials Market (2016�2021)
Figure 66 Companies Adopted Agreements and Expansions as The Key Growth Strategies During 2011�2016
Figure 67 Hexion Inc.: Company Snapshot
Figure 68 Pultrusion Market Segmentation
Figure 69 Attractive Market Opportunities in Pultrusion Market, 2016�2021
Figure 70 Asia-Pacific Dominated The Pultrusion Market, By Value (2015)
Figure 71 Drivers, Restraints, Opportunities, and Challenges in Pultrusion Market
Figure 72 Porter�s Five Forces: Intensity of Rivalry is High Due to Presence of Large Number of Players
Figure 73 Glass Fiber Dominates The Pultrusion Market, 2016 vs 2021
Figure 74 Industrial Applications to Dominate During The Forecast Period
Figure 75 Regional Snapshot�India is Expected to Drive The Pultrusion Market During The Forecast Period (2016-2021)
Figure 76 Companies Preferred Inorganic Growth Stratgies Over The Period of 2011-2015
Figure 77 Strongwell Corporation: SWOT Analysis
Figure 78 Exel Composites : Company Snapshot
Figure 79 Exel Composites: SWOT Analysis
Figure 80 LFT Composites: Market Segmentation
Figure 81 LFT Composites Market to Grow Rapidly Between 2016 and 2021
Figure 82 Europe to Be The Largest and Fastest-Growing LFT Composites Market
Figure 83 Drivers, Restraints, Opportunities, and Challenges in LFT Composites Market
Figure 84 Porter�s Five Forces Analysis
Figure 85 Long Glass Fiber Thermoplastic to Dominate LFT Composites Market in The Next Five Years
Figure 86 LFT Composites Market in Automotive Application to Register The Highest CAGR Between 2016 and 2021
Figure 87 Germany to Register The Highest CAGR in LFT Composites Market
Figure 88 Companies Adopted New Product Developments as The Key Growth Strategy Between 2012 and 2016
Figure 89 Company Snapshot: Celanese Corporation
Figure 90 Celanese Corporation: SWOT Analysis
Figure 91 Company Snapshot: Polyone
Figure 92 Polyone: SWOT Analysis
Figure 93 Natural Fiber Composites Market Segmentation
Figure 94 Attractive Opportunities in Natural Fiber Composites Market, 2016�2021
Figure 95 Natural Fiber Composites Market Share and CAGR, By Region, 2015
Figure 96 Drivers, Restraints, Opportunities, and Challenges in Natural Fiber Composites Market
Figure 97 Natural Fiber Composites: Porter�s Five Forces Analysis
Figure 98 Market Drivers for Wood and Non-Wood Fiber Composites, 2016�2021
Figure 99 Building & Construction Segment to Account for The Highest Market Share
Figure 100 Asia-Pacific to Drive The Natural Fiber Composites Market Between 2016 and 2021
Figure 101 Companies Adopted New Product Developments and Agreements & Partnerships as The Key Growth Strategies Between 2011 and 2015
Figure 102 Upm Biocomposites: Company Snapshot
Figure 103 Weyerhaeuser Company: Company Snapshot
Figure 104 SMC and BMC Market Segmentation
Figure 105 Attractive Market Opportunities in SMC and BMC Market, 2016�2021
Figure 106 SMC and BMC Market Share, By Geography, 2015
Figure 107 Lightweight and Superior Mechanical Properties are Expected to Drive The SMC and BMC Market
Figure 108 Porter�s Five Forces: Intensity of Rivalry is High Due to Presence of Large Number of Players
Figure 109 Glass Fiber Dominates The SMC and BMC Market, 2016 vs 2021
Figure 110 Polyester Resin is Expected to Dominate The SMC and BMC Market, 2016 vs 2021
Figure 111 Transportation to Be The Largest Application Segment of SMC Till 2021
Figure 112 SMC and BMC Regional Market Snapshot�Rapidly Growing Markets are Emerging as New Hotspots (2016-2021)
Figure 113 Companies Adopted New Product Developments/Launches as The Key Growth Strategy (2012-2016)
Figure 114 Idi Composites International: SWOT Analysis
Figure 115 Citadel Plastics Holdings Inc.: Company Snapshot
Figure 116 Citadel Plastics Holding Inc. : SWOT Analysis
Figure 117 Composite Resin: Market Segmentation
Figure 118 Attractive Opportunities in Composite Resin Market, 2016�2021
Figure 119 Asia-Pacific Dominated The Composite Resin Market, 2016�2021
Figure 120 Drivers, Restraints, Opportunities, and Challenges in Composites Resin Market
Figure 121 Porter�s Five Forces Analysis
Figure 122 Thermoset Composites Resin Dominated The Market in 2016
Figure 123 Transportation Applications to Outpace Other Applications Markets in Terms of Volume, 2016 vs 2021
Figure 124 India and Brazil are Estimated to Drive The Composite Resin Market Between 2016 and 2021
Figure 125 Asia-Pacific is Projected to Dominate Composite Resin Market Between 2016 and 2021
Figure 126 Companies Adopted Agreement as The Key Growth Strategy, 2011�2015
Figure 127 Huntsman Corporation: Company Snapshot
Figure 128 Hexion Inc.: Company Snapshot
Figure 129 Hexion Inc.: Company Snapshot


Growth opportunities and latent adjacency in Top 10 High Growth Composite Material Market