Transparent Plastics Market by Type (Rigid, Flexible), Polymer Type (PET, PVC, PP, PS, PC, PMMA), Application (Packaging, Building & Construction, Electrical & Electronics, Automotive, Consumer Goods), and Region - Global Forecast to 2022


[230 Pages Report] MarketsandMarkets forecasts the Transparent Plastics market to grow from USD 102.0 billion in 2017 to USD 137.7 billion by 2022, at a Compound Annual Growth Rate (CAGR) of 6.2% during the forecast period. The major factors that are expected to be driving the transparent plastic market are increasing adoption of transparent plastics by end-use industries, improved shelf-life of packaged food products, high demand in emerging regions, and ease of customization. The objective of the report is to define, describe, and forecast the transparent plastics market size in terms of value and volume based on type, polymer type, application, and region.
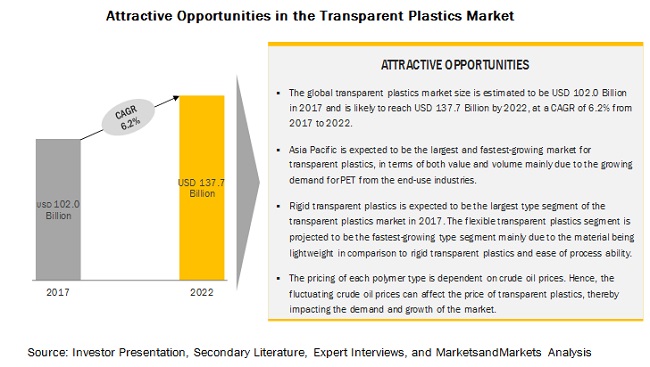
By type, the flexible transparent plastics segment of the transparent plastics market is projected to grow at a higher CAGR during the forecast period.
The flexible transparent plastics type segment of the transparent plastics market is projected to grow at a higher CAGR during the forecast period. Polytetrafluoroethylene (PTFE) is the most preferred material in the flexible transparent plastics segment. Flexible packaging is preferred for its low cost, sustainability, attractiveness, and convenience. Another advantage of this kind of packaging is that it allows written information such as product instructions to be placed on the label.
By polymer types, the Polyethylene Terephthalate (PET) segment of the transparent plastic market is projected to grow at the highest CAGR during the forecast period
The PET polymer type segment of the transparent plastic market is projected to grow at the highest CAGR during the forecast period. Due to PET's unique properties such as good barrier properties, light weight, recyclability, safety, and ease of handling, it is rapidly becoming the preferred packaging material for foods and beverages globally.
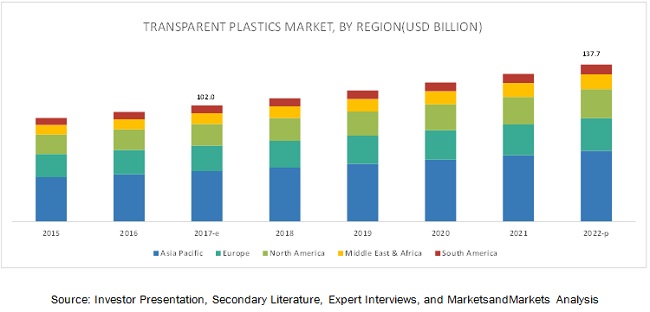
The Asia Pacific transparent plastics market is projected to grow at the highest CAGR during the forecast period.
The Asia Pacific transparent plastics market is projected to grow at the highest CAGR during the forecast period. Due to the increased domestic demand, rising income levels, and easy access to resources, Asia Pacific has emerged to become the leading consumer of transparent plastics.
Market Dynamics
Driver: Increasing adoption of transparent plastics by end-use industries
Plastics have the advantage of lightweight over other materials such as glass and metals. In various end-use industries, plastics are finding increasing acceptance due to durability, aesthetics, high performance, and easy handling. Plastics are replacing traditional materials such as glass in building & construction applications. Plastics are replacing glass in the construction of windows and frames; they provide high energy efficiency, aesthetics, design flexibility, and cost efficiency. For instance, polycarbonate plastics are used in windows. Polycarbonate is shatter-resistant, transparent, and lightweight. Plastics have low thermal conductivity, which in turn reduces the heating and cooling costs though still protecting extreme weather conditions. The light weight of transparent plastics provides additional benefits during transportation, as there is less possibility of breakage and requires less fuel for transportation. In the packaging sector, transparent plastics prove to be more cost-efficient compared to other materials. For example, to package ten gallons of beverages, only two pounds of TP are required as compared to forty pounds of glass for the same task.
Transparent plastics are considered as cost-effective as compared to glass and other materials based on the following facts:
- Increase the product life
- Decrease repair and maintenance costs
- Reduce product, transportation, and installation costs
- Reduces the overall product weight, which, in turn, results in improved efficiency
- Plastics save energy and reduce CO2 emissions.
Restraint: Environmental pollution due to the low biodegradability of plastics
Plastics are durable and do not degrade easily. Inappropriate disposal of plastic materials poses a threat of environmental pollution. Plastic is one of the biggest threats to marine species. For instance, various sea turtles are harmed due to accidental consumption of transparent plastic materials; as transparent plastic materials often look similar to a jellyfish or the larval stage of a crab. Several issues related to plastic packaging material such as biodegradability and recyclability have led to a surge in the number of environmental regulations against the use of plastic packaging materials. These stringent regulations on inappropriate disposal of plastic materials are restraining the growth of the transparent plastics market.
Opportunity: Development of bio-based transparent plastics
Currently, transparent bioplastics are being developed; however, the high-cost and reduced physical properties continue to be a restraint. The most promising developments are in creating commodity resins (PET, PS, and PVC) from bio-based sources.
The demand for biodegradable plastics is rising exponentially. Transparent biodegradable plastics which can directly go to landfill are expected to drive the market in future. Food & beverage packaging is one of the major markets which is expected to offer huge opportunities for bio-based plastics. Significant misinformation and scare tactics are being used to push the anti-plastic agenda. This cripples the industry; however, the development of new materials is estimated to lower the impact of this misinformation and scare tactics in the long-term.
Challenge: Fluctuating raw material prices
Price and availability of raw materials are the major factors that affect the price of end products. Crude oil is among the major raw materials employed in the production of various plastic packaging materials such as polystyrene, polypropylene, PVC, and polycarbonate. The global plastics market, especially transparent plastics has witnessed oscillating price trends of raw materials in recent years, which are fluctuating due to volatile energy prices. Transparent plastics manufacturers are affected by price-sensitive customers. Most raw materials are petroleum-based and are vulnerable to fluctuations in the commodity prices. Oil prices have been highly volatile in the recent times. This is a major challenge for the plastic industry to predict the future price, thus resulting in low investments in transparent plastics-related projects.
Scope of the Report
|
Report Metric |
Details |
|
Market size available for years |
2016�2022 |
|
Base year considered |
2016 |
|
Forecast period |
2017�2022 |
|
Forecast units |
Billion (USD) |
|
Segments covered |
Type (Rigid Transparent Plastics, Flexible Transparent Plastics), Polymer Type (Polyethylene Terephthalate, Polyvinyl Chloride, Polypropylene, Polystyrene, Polycarbonate, Polymethyl Methacrylate, Others), Application (Packaging, Building & Construction, Electrical & Electronics, Automotive, Consumer Goods, Healthcare, Others) and Region |
|
Geographies covered |
North America, Europe, APAC, MEA, and South America |
|
Companies covered |
DuPont (US), Dow Chemical Company (US), LyondellBasell (Netherlands), SABIC (Saudi Arabia), Covestro (Germany), BASF (Germany), INEOS (UK), PPG Industries (US), Evonik Industries (Germany), LANXESS (Germany), Teijin Limited (Japan), LG Chem (South Korea), Denka (Japan), Trinseo (US), Asahi Kasei (Japan), Eastman Chemical Company (US), Chi Mei Corporation (Taiwan), and Arkema (France) |
The research report categorizes the Transparent Plastic Market to forecast the revenues and analyze the trends in each of the following sub-segments:
Transparent Plastics Market, By Type
- Rigid Transparent Plastics
- Flexible Transparent Plastics
Transparent Plastics Market, By Polymer Type
- Polyethylene Terephthalate (PET)
- Polyvinyl Chloride (PVC)
- Polypropylene (PP)
- Polystyrene (PS)
- Polycarbonate (PC)
- Polymethyl Methacrylate (PMMA)
- Others (Polyamide, ABS & SAN, Polyethylene, TPU)
Transparent Plastic Market, By Application
- Packaging
- Building & Construction
- Electrical & Electronics
- Automotive
- Consumer Goods
- Healthcare
- Others (Aerospace, Agriculture)
Transparent Plastics Market, By Region
- Asia Pacific
- North America
- Europe
- Middle East & Africa
- South America
Key Market Players
DuPont (US), Dow Chemical Company (US), LyondellBasell (Netherlands), SABIC (Saudi Arabia), Covestro (Germany), BASF (Germany), INEOS (UK), PPG Industries (US), Evonik Industries (Germany), LANXESS (Germany), Teijin Limited (Japan), LG Chem (South Korea), Denka (Japan), Trinseo (US), Asahi Kasei (Japan), Eastman Chemical Company (US), Chi Mei Corporation (Taiwan), and Arkema (France).
SABIC is amongst the prominent players in the transparent plastics market and has a strong product portfolio. The company has strong R&D capability and has launched several new and competitive products to increase the strength of its product offerings and to develop more customer-centered products.
SABIC is focusing on both organic and inorganic growth strategies to expand its market reach globally. The company is taking measured approaches to expand its geographical reach, e.g., it recently partnered with SINOPEC to build a new polycarbonate plant in Tianjin Province, China. Such approach can help the company to leverage and build upon each other�s technical expertise.
Recent Developments
- In January 2018, SABIC launched LEXAN CXT resin, a new line of high-clarity, high-heat, and injection moldable polycarbonate copolymer resins used in the optical electronics, consumer & industrial, and healthcare industries applications. With this launch, the company has strengthened its portfolio of transparent plastics.
- In October 2017, the company established a joint venture with SINOPEC to build a new polycarbonate plant in Tianjin Province, China. It is a 50-50 joint venture between the two companies and the plant is expected to become operational in 2020.
- In March 2017, The Dow Chemical Company completed the construction of its new USD 6 billion world-scale ethylene production facility in Texas. With this expansion, the company can leverage the advantage of shale gas supply available in the US. This also enables the company to procure raw materials at a low cost.
- In February 2018, LyondellBasell and A. Schulman, Inc. signed a definitive agreement. Under this agreement, LyondellBasell is set to acquire A. Schulman for a total consideration of USD 2.25 billion. With this acquisition, the company will enhance its presence in the advanced polymer solutions business with broad geographic reach, leading technologies, and a diverse product portfolio.
Critical questions the report answers:
- Where will all these developments take the industry in the long term?
- What are the upcoming trends for the Transparent Plastics market?
- Which segment provides the most opportunity for growth?
- Who are the leading vendors operating in this market?
- What are the opportunities for new market entrants?
To speak to our analyst for a discussion on the above findings, click Speak to Analyst
 Exclusive indicates content/data unique to MarketsandMarkets and not available with any competitors.
Table of Contents
1 Introduction (Page No. - 19)
1.1 Objectives of the Study
1.2 Market Definition
1.3 Market Scope
1.3.1 Years Considered for the Study
1.4 Currency
1.5 Stakeholders
1.6 Limitations
2 Research Methodology (Page No. - 22)
2.1 Research Data
2.1.1 Secondary Data
2.1.1.1 Key Data From Secondary Sources
2.1.2 Primary Data
2.1.2.1 Key Data From Primary Sources
2.1.2.2 Key Industry Insights
2.1.2.3 Breakdown of Primary Interviews
2.2 Market Size Estimation
2.3 Data Triangulation
2.4 Assumptions
3 Executive Summary (Page No. - 30)
4 Premium Insights (Page No. - 35)
4.1 Attractive Opportunities in the Transparent Plastics Market
4.2 Transparent Plastic Market, By Type
4.3 Transparent Plastics Market, By Polymer Type
4.4 Transparent Plastic Market, By Application
4.5 Transparent Plastics Market, By Region
5 Market Overview (Page No. - 39)
5.1 Introduction
5.1.1 Manufacturing Processes for Transparent Plastics Industry
5.1.1.1 Extrusion Molding
5.1.1.2 Injection Molding
5.1.1.3 Blow Molding
5.1.1.4 Roto Molding
5.2 Market Dynamics
5.2.1 Drivers
5.2.1.1 Increasing Adoption of Transparent Plastics By End-Use Industries
5.2.1.2 Improved Shelf-Life of Packaged Food Products
5.2.1.3 High Demand in Emerging Regions
5.2.1.4 Ease of Customization
5.2.2 Restraints
5.2.2.1 Environmental Pollution Due to the Low Biodegradability of Plastics
5.2.2.2 Increasing Demand for Eco-Friendly Packaging Materials in Developed Regions
5.2.3 Opportunities
5.2.3.1 Development of Bio-Based Transparent Plastics
5.2.3.2 Rising Standards of Living of End-Use Consumers
5.2.4 Challenges
5.2.4.1 Fluctuating Raw Material Prices
5.3 Porter�s Five Forces Analysis
5.3.1 Bargaining Power of Suppliers
5.3.2 Bargaining Power of Buyers
5.3.3 Threat of Substitutes
5.3.4 Threat of New Entrants
5.3.5 Intensity of Competitive Rivalry
5.4 Economic Indicators
5.4.1 Industry Outlook
5.4.1.1 Packaging
5.4.1.2 Building & Construction
5.4.1.3 Consumer Goods
5.4.1.4 Automotive
5.4.1.5 Healthcare
5.4.1.6 Electrical & Electronics
6 Transparent Plastics Market, By Type (Page No. - 54)
6.1 Introduction
6.2 Rigid Transparent Plastics
6.3 Flexible Transparent Plastics
7 Transparent Plastic Market, By Polymer Type (Page No. - 59)
7.1 Introduction
7.2 Polystyrene
7.3 Polypropylene
7.4 Polycarbonate
7.5 Polyethylene Terephthalate
7.6 Polyvinyl Chloride
7.7 Polymethyl Methacrylate
7.8 Others
7.8.1 San & Abs
7.8.2 thermoplastic Polyurethane
7.8.3 Polyamide
7.8.4 Polyethylene
8 Transparent Plastics Market, By Application (Page No. - 75)
8.1 Introduction
8.2 Packaging
8.3 Building & Construction
8.4 Automotive
8.5 Consumer Goods
8.6 Healthcare
8.7 Electrical & Electronics
8.8 Others
8.8.1 Aerospace
8.8.2 Agriculture
9 Transparent Plastics Market, By Region (Page No. - 89)
9.1 Introduction
9.2 Asia Pacific
9.2.1 China
9.2.2 India
9.2.3 Japan
9.2.4 South Korea
9.2.5 Taiwan
9.2.6 Vietnam
9.2.7 Rest of Asia Pacific
9.3 Europe
9.3.1 Germany
9.3.2 France
9.3.3 Italy
9.3.4 UK
9.3.5 Spain
9.3.6 Poland
9.3.7 Rest of Europe
9.4 North America
9.4.1 Us
9.4.2 Canada
9.4.3 Mexico
9.5 Middle East & Africa
9.5.1 Saudi Arabia
9.5.2 UAE
9.5.3 South Africa
9.5.4 Rest of Middle East & Africa
9.6 South America
9.6.1 Brazil
9.6.2 Argentina
9.6.3 Rest of South America
10 Competitive Landscape (Page No. - 162)
10.1 Overview
10.2 Market Ranking of Key Players
10.3 Competitive Scenario
10.3.1 Agreements
10.3.2 Expansions
10.3.3 Acquisitions
10.3.4 New Product Launches
10.3.5 Contracts
10.3.6 Joint Ventures
11 Company Profiles (Page No. - 173)
11.1 E. I. Du Pont De Nemours and Company
11.2 the Dow Chemical Company
11.3 Lyondellbasell Industries Holdings B.V.
11.4 SABIC
11.5 Covestro
11.6 BASF SE
11.7 INEOS
11.8 PPG Industries
11.9 Evonik Industries AG
11.10 LANXESS AG
11.11 Teijin Limited
11.12 LG Chem
11.13 Denka Company Limited
11.14 Trinseo S.A.
11.15 Asahi Kasei Corporation
11.16 Eastman Chemical Company
11.17 Chi Mei Corporation
11.18 Arkema S.A.
12 Appendix (Page No. - 223)
12.1 Discussion Guide
12.2 Knowledge Store: Marketsandmarkets� Subscription Portal
12.3 Introducing RT: Real-Time Market Intelligence
12.4 Available Customizations
12.5 Related Reports
12.6 Author Details
List of Tables (187 Tables)
Table 1 Transparent Plastics Market Snapshot
Table 2 Plastics Replacing Traditionally Used Materials in the Packaging Industry
Table 3 Country-Wise Car and Commercial Vehicle Production Statistics, 2016
Table 4 Transparent Plastic Market, By Type, 2015�2022 (USD Million)
Table 5 Transparent Plastics Market, By Type, 2015�2022 (Kilotons)
Table 6 Rigid Transparent Plastic Market, By Region, 2015�2022 (USD Million)
Table 7 Rigid Transparent Plastics Market, By Region, 2015�2022 (Kilotons)
Table 8 Flexible Transparent Plastic Market, By Region, 2015�2022 (USD Million)
Table 9 Flexible Transparent Plastics Market, By Region, 2015�2022 (Kilotons)
Table 10 Transparent Plastic Market, By Polymer Type, 2015�2022 (USD Million)
Table 11 Market, By Polymer Type, 2015�2022 (KT)
Table 12 Polystyrene Transparent Plastics Market, By Region, 2015�2022 (USD Million)
Table 13 Polystyrene Market, By Region, 2015�2022 (KT)
Table 14 Polypropylene Transparent Plastics Market, By Region, 2015�2022 (USD Million)
Table 15 Polypropylene Market, By Region, 2015�2022 (KT)
Table 16 Polycarbonate Market, By Region, 2015�2022 (USD Million)
Table 17 Polycarbonate Market, By Region, 2015�2022 (KT)
Table 18 Polyethylene Terephthalate Transparent Plastics Market, By Region, 2015�2022 (USD Million)
Table 19 Polyethylene Terephthalate Market, By Region, 2015�2022 (KT)
Table 20 Polyvinyl Chloride Transparent Plastic Market, By Region, 2015�2022 (USD Million)
Table 21 Polyvinyl Chloride Market, By Region, 2015�2022 (KT)
Table 22 Polymethyl Methacrylate Transparent Plastics Market, By Region, 2015�2022 (USD Million)
Table 23 Polymethyl Methacrylate Market, By Region, 2015�2022 (KT)
Table 24 Other Polymer Types Transparent Plastic Market, By Region, 2015�2022 (USD Million)
Table 25 Other Polymer Types Market, By Region, 2015�2022 (KT)
Table 26 List of Key End-Users of Transparent Palstics
Table 27 Transparent Plastics Market, By Application, 2015�2022 (USD Million)
Table 28 Market, By Application, 2015�2022 (Kilotons)
Table 29 Market in Packaging, By Region, 2015�2022 (USD Million)
Table 30 Market in Packaging, By Region, 2015�2022 (Kilotons)
Table 31 Features of Transparent Plastics and their Benefits in the Building& Construction Industry
Table 32 Transparent Plastics Market in Building & Construction, By Region, 2015�2022 (USD Million)
Table 33 Market in Building & Construction, By Region, 2015�2022 (Kilotons)
Table 34 Market in Automotive, By Region, 2015�2022 (USD Million)
Table 35 Market in Automotive, By Region, 2015�2022 (Kilotons)
Table 36 Market in Consumer Goods, By Region, 2015�2022 (USD Million)
Table 37 Market in Consumer Goods, By Region, 2015�2022 (Kilotons)
Table 38 Market in Healthcare, By Region, 2015�2022 (USD Million)
Table 39 Market in Healthcare, By Region, 2015�2022 (Kilotons)
Table 40 Market in Electrical & Electronics, By Region, 2015�2022 (USD Million)
Table 41 Market in Electrical & Electronics, By Region, 2015�2022 (Kilotons)
Table 42 Market in Other Applications, By Region, 2015�2022 (USD Million)
Table 43 Market in Other Applications, By Region, 2015�2022 (Kilotons)
Table 44 Market, By Region, 2015�2022 (USD Million)
Table 45 Market, By Region, 2015�2022 (Kilotons)
Table 46 Asia Pacific By Market, By Country, 2015�2022 (USD Million)
Table 47 Asia Pacific By Market, By Country, 2015�2022 (Kilotons)
Table 48 Asia Pacific By Market, By Type, 2015�2022 (USD Million)
Table 49 Asia Pacific By Market, By Type, 2015�2022 (Kilotons)
Table 50 Asia Pacific By Market, By Polymer Type, 2015�2022 (USD Million)
Table 51 Asia Pacific By Market, By Polymer Type, 2015�2022 (Kilotons)
Table 52 Asia Pacific By Market, By Application, 2015�2022 (USD Million)
Table 53 Asia Pacific By Market, By Application, 2015�2022 (Kilotons)
Table 54 China Transparent Plastics Market, By Polymer Type, 2015�2022 (USD Million)
Table 55 China Market, By Polymer Type, 2015�2022 (Kilotons)
Table 56 China Market, By Application, 2015�2022 (USD Million)
Table 57 China Market, By Application, 2015�2022 (Kilotons)
Table 58 India By Market, By Polymer Type, 2015�2022 (USD Million)
Table 59 India By Market, By Polymer Type, 2015�2022 (Kilotons)
Table 60 India By Market, By Application, 2015�2022 (USD Million)
Table 61 India By Market, By Application, 2015�2022 (Kilotons)
Table 62 Japan By Market, By Polymer Type, 2015�2022 (USD Million)
Table 63 Japan By Market, By Polymer Type, 2015�2022 (Kilotons)
Table 64 Japan By Market, By Application, 2015�2022 (USD Million)
Table 65 Japan By Market, By Application, 2015�2022 (Kilotons)
Table 66 South Korea Transparent Plastic Market, By Polymer Type, 2015�2022 (USD Million)
Table 67 South Korea Market, By Polymer Type, 2015�2022 (Kilotons)
Table 68 South Korea Market, By Application, 2015�2022 (USD Million)
Table 69 South Korea Market, By Application, 2015�2022 (Kilotons)
Table 70 Taiwan By Market, By Polymer Type, 2015�2022 (USD Million)
Table 71 Taiwan By Market, By Polymer Type, 2015�2022 (Kilotons)
Table 72 Taiwan By Market, By Application, 2015�2022 (USD Million)
Table 73 Taiwan By Market, By Application, 2015�2022 (Kilotons)
Table 74 Vietnam By Market, By Polymer Type, 2015�2022 (USD Million)
Table 75 Vietnam By Market, By Polymer Type, 2015�2022 (Kilotons)
Table 76 Vietnam By Market, By Application, 2015�2022 (USD Million)
Table 77 Vietnam Transparent Plastic Market, By Application, 2015�2022 (Kilotons)
Table 78 Rest of Asia Pacific Transparent Plastics Market, By Polymer Type, 2015�2022 (USD Million)
Table 79 Rest of Asia Pacific Market, By Polymer Type, 2015�2022 (Kilotons)
Table 80 Rest of Asia Pacific Market, By Application, 2015�2022 (USD Million)
Table 81 Rest of Asia Pacific Market, By Application, 2015�2022 (Kilotons)
Table 82 Europe By Market, By Country, 2015�2022 (USD Million)
Table 83 Europe By Market, By Country, 2015�2022 (Kilotons)
Table 84 Europe By Market, By Type, 2015�2022 (USD Million)
Table 85 Europe By Market, By Type, 2015�2022 (Kilotons)
Table 86 Europe By Market, By Polymer Type, 2015�2022 (USD Million)
Table 87 Europe By Market, By Polymer Type, 2015�2022 (Kilotons)
Table 88 Europe By Market, By Application, 2015�2022 (USD Million)
Table 89 Europe By Market, By Application, 2015�2022 (Kilotons)
Table 90 Germany Transparent Plastics Market, By Polymer Type, 2015�2022 (USD Million)
Table 91 Germany Market, By Polymer Type, 2015�2022 (Kilotons)
Table 92 Germany Market, By Application, 2015-2022 (USD Million)
Table 93 Germany Market, By Application, 2015�2022 (Kilotons)
Table 94 France Transparent Plastic Market, By Polymer Type, 2015�2022 (USD Million)
Table 95 France Market, By Polymer Type, 2015�2022 (Kilotons)
Table 96 France Market, By Application, 2015-2022 (USD Million)
Table 97 France Market, By Application, 2015�2022 (Kilotons)
Table 98 Italy Transparent Plastics Market, By Polymer Type, 2015�2022 (USD Million)
Table 99 Italy Market, By Polymer Type, 2015�2022 (Kilotons)
Table 100 Italy Market, By Application, 2015-2022 (USD Million)
Table 101 Italy Market, By Application, 2015�2022 (Kilotons)
Table 102 UK By Market, By Polymer Type, 2015�2022 (USD Million)
Table 103 UK By Market, By Polymer Type, 2015�2022 (Kilotons)
Table 104 UK By Market, By Application, 2015-2022 (USD Million)
Table 105 UK By Market, By Application, 2015�2022 (Kilotons)
Table 106 Spain By Market, By Polymer Type, 2015�2022 (USD Million)
Table 107 Spain By Market, By Polymer Type, 2015�2022 (Kilotons)
Table 108 Spain By Market, By Application, 2015-2022 (USD Million)
Table 109 Spain By Market, By Application, 2015�2022 (Kilotons)
Table 110 Poland By Market, By Polymer Type, 2015�2022 (USD Million)
Table 111 Poland By Market, By Polymer Type, 2015�2022 (Kilotons)
Table 112 Poland By Market, By Application, 2015-2022 (USD Million)
Table 113 Poland By Market, By Application, 2015�2022 (Kilotons)
Table 114 Rest of Europe Transparent Plastic Market, By Polymer Type, 2015�2022 (USD Million)
Table 115 Rest of Europe Market, By Polymer Type, 2015�2022 (Kilotons)
Table 116 Rest of Europe Market, By Application, 2015-2022 (USD Million)
Table 117 Rest of Europe Market, By Application, 2015�2022 (Kilotons)
Table 118 North America By Market, By Country, 2015-2022 (USD Million)
Table 119 North America By Market, By Country, 2015�2022 (Kilotons)
Table 120 North America By Market, By Type, 2015�2022 (USD Million)
Table 121 North America By Market, By Type, 2015�2022 (Kilotons)
Table 122 North America By Market, By Polymer Type, 2015�2022 (USD Million)
Table 123 North America By Market, By Polymer Type, 2015�2022 (Kilotons)
Table 124 North America By Market, By Application, 2015�2022 (USD Million)
Table 125 North America By Market, By Application, 2015�2022 (Kilotons)
Table 126 US By Market, By Polymer Type, 2015�2022 (USD Million)
Table 127 US By Market, By Polymer Type, 2015�2022 (Kilotons)
Table 128 US By Market, By Application, 2015-2022 (USD Million)
Table 129 US By Market, By Application, 2015�2022 (Kilotons)
Table 130 Canada By Market, By Polymer Type, 2015�2022 (USD Million)
Table 131 Canada By Market, By Polymer Type, 2015�2022 (Kilotons)
Table 132 Canada By Market, By Application, 2015-2022 (USD Million)
Table 133 Canada By Market, By Application, 2015�2022 (Kilotons)
Table 134 Mexico By Market, By Polymer Type, 2015�2022 (USD Million)
Table 135 Mexico By Market, By Polymer Type, 2015�2022 (Kilotons)
Table 136 Mexico By Market, By Application, 2015-2022 (USD Million)
Table 137 Mexico Transparent Plastics Market, By Application, 2015�2022 (Kilotons)
Table 138 Middle East & Africa By Market, By Country, 2015�2022 (USD Million)
Table 139 Middle East & Africa By Market, By Country, 2015�2022 (Kilotons)
Table 140 Middle East & Africa By Market, By Type, 2015�2022 (USD Million)
Table 141 Middle East & Africa By Market, By Type, 2015�2022 (Kilotons)
Table 142 Middle East & Africa By Market, By Polymer Type, 2015�2022 (USD Million)
Table 143 Middle East & Africa By Market, By Polymer Type, 2015�2022 (Kilotons)
Table 144 Middle East & Africa By Market, By Application, 2015�2022 (USD Million)
Table 145 Middle East & Africa By Market, By Application, 2015�2022 (Kilotons)
Table 146 Saudi Arabia By Market, By Polymer Type, 2015�2022 (USD Million)
Table 147 Saudi Arabia By Market, By Polymer Type, 2015�2022 (Kilotons)
Table 148 Saudi Arabia By Market, By Application, 2015-2022 (USD Million)
Table 149 Saudi Arabia By Market, By Application, 2015�2022 (Kilotons)
Table 150 UAE Transparent Plastic Market, By Polymer Type,2015�2022 (USD Million)
Table 151 UAE Market, By Polymer Type, 2015�2022 (Kilotons)
Table 152 UAE Market, By Application, 2015-2022 (USD Million)
Table 153 UAE Market, By Application, 2015�2022 (Kilotons)
Table 154 South Africa By Market, By Polymer Type, 2015�2022 (USD Million)
Table 155 South Africa By Market, By Polymer Type, 2015�2022 (Kilotons)
Table 156 South Africa By Market, By Application, 2015-2022 (USD Million)
Table 157 South Africa By Market, By Application, 2015�2022 (Kilotons)
Table 158 Rest of Middle East & Africa By Market, By Polymer Type, 2015�2022 (USD Million)
Table 159 Rest of Middle East & Africa Transparent Plastics Market, By Polymer Type, 2015�2022 (Kilotons)
Table 160 Rest of Middle East & Africa Market, By Application, 2015-2022 (USD Million)
Table 161 Rest of Middle East & Africa Market, By Application, 2015�2022 (Kilotons)
Table 162 South America By Market, By Country, 2015�2022 (USD Million)
Table 163 South America By Market, By Country, 2015�2022 (Kilotons)
Table 164 South America By Market, By Type, 2015�2022 (USD Million)
Table 165 South America By Market, By Type, 2015�2022 (Kilotons)
Table 166 South America By Market, By Polymer Type, 2015�2022 (USD Million)
Table 167 South America By Market, By Polymer Type, 2015�2022 (Kilotons)
Table 168 South America By Market, By Application, 2015�2022 (USD Million)
Table 169 South America By Market, By Application, 2015�2022 (Kilotons)
Table 170 Brazil Transparent Plastic Market, By Polymer Type, 2015�2022 (USD Million)
Table 171 Brazil Market, By Polymer Type, 2015�2022 (Kilotons)
Table 172 Brazil Market, By Application, 2015-2022 (USD Million)
Table 173 Brazil Market, By Application, 2015�2022 (Kilotons)
Table 174 Argentina By Market, By Polymer Type, 2015�2022 (USD Million)
Table 175 Argentina By Market, By Polymer Type, 2015�2022 (Kilotons)
Table 176 Argentina By Market, By Application, 2015-2022 (USD Million)
Table 177 Argentina By Market, By Application, 2015�2022 (Kilotons)
Table 178 Rest of South America By Market, By Polymer Type, 2015�2022 (USD Million)
Table 179 Rest of South America By Market, By Polymer Type, 2015�2022 (Kilotons)
Table 180 Rest of South America By Market, By Application, 2015-2022 (USD Million)
Table 181 Rest of South America By Market, By Application, 2015�2022 (Kilotons)
Table 182 Agreements, 2013-2018
Table 183 Expansions, 2013-2018
Table 184 Acquisitions, 2013-2018
Table 185 New Product Launches, 2013-2018
Table 186 Contracts, 2013-2018
Table 187 Joint Ventures, 2013-2018
List of Figures (66 Figures)
Figure 1 Transparent Plastics Market: Research Design
Figure 2 Bottom-Up Approach
Figure 3 Top-Down Approach
Figure 4 Transparent Plastic Market: Data Triangulation
Figure 5 Rigid Transparent Plastics Expected to Be the Largest TypeSegment of the Transparent Plastic Market in 2017
Figure 6 Polyethylene Terephthalate (PET) is Expected to Be the Largest Polymer Type Segment in 2017
Figure 7 Packaging Expected to Be the Largest Application Segment in 2017
Figure 8 Asia Pacific Expected to Be the Largest Transparent Plastics Market in 2017
Figure 9 Geographic Expansion in Emerging Markets Offers Lucrative Opportunities for the Market Players
Figure 10 Flexible Transparent Plastics is Expected to Be the Fastest-Growing Type Segment During the Forecast Period
Figure 11 Polyethylene Terephthalate is Expected to Be the Fastest-Growing Polymer Type Segment During the Forecast Period
Figure 12 Packaging is Expected to Be the Fastest-Growing Application Segment During the Forecast Period
Figure 13 Transparent Plastics Market in Asia Pacific is Expected to Grow at the Highest Cagr During the Forecast Period
Figure 14 Transparent Plastics Manufacturing Processes
Figure 15 Transparent Plastic Market Dynamics
Figure 16 Average Crude Oil Prices Per Barrel (2014�2030)
Figure 17 Transparent Plastics Market: Porter�s Five Forces Analysis
Figure 18 Global Share of Packaging Materials, 2016
Figure 19 Projections of Investments in Infrastructure Projects, By Region: 2016�2040 (USD Trillion)
Figure 20 Retail Sales Forecast, 2018
Figure 21 Retail Sales Growth Forecast, 2018-2019
Figure 22 Estimated Healthcare Spending as A Percentage of Gdp, 2018
Figure 23 Electronics Industry Growth Rate, By Region, 2016-2018
Figure 24 Transparent Plastics Market, By Type, 2017 & 2022 (Kilotons)
Figure 25 Rigid Transparent Plastic Market, 2017-2022 (Kilotons)
Figure 26 Flexible Transparent Plastics Market, 2017-2022 (Kilotons)
Figure 27 Transparent Plastic Market, By Polymer Type
Figure 28 Polystyrene Transparent Plastics Market, 2017-2022 (KT)
Figure 29 Polypropylene Transparent Plastic Market, 2017-2022 (KT)
Figure 30 Polycarbonate Transparent Plastics Market, 2017-2022 (KT)
Figure 31 Polyethylene Terephthalate Transparent Plastic Market, 2017-2022 (KT)
Figure 32 Polyvinyl Chloride Transparent Plastics Market, 2017-2022 (KT)
Figure 33 Polymethyl Methacrylate Transparent Plastic Market, 2017-2022 (KT)
Figure 34 Other Polymer Types Transparent Plastics Market, 2017-2022 (KT)
Figure 35 Transparent Plastic Market Overview, By Application
Figure 36 Transparent Plastics Market in Packaging, 2017-2022 (Kilotons)
Figure 37 Transparent Plastic Market in Building & Construction, 2017-2022 (Kilotons)
Figure 38 Transparent Plastics Market in Automotive, 2017-2022 (Kilotons)
Figure 39 Transparent Plastic Market in Consumer Goods, 2017-2022 (Kilotons)
Figure 40 Transparent Plastics Market in Healthcare, 2017-2022 (Kilotons)
Figure 41 Transparent Plastic Market in Electrical & Electronics, 2017-2022 (Kilotons)
Figure 42 Transparent Plastics Market in Other Applications, 2017-2022 (Kilotons)
Figure 43 China and India are Expected to Be the Fastest Growing Markets for Transparent Plastics
Figure 44 Asia Pacific Transparent Plastic Market Snapshot
Figure 45 Europe Transparent Plastics Market Snapshot
Figure 46 North America Transparent Plastic Market Snapshot
Figure 47 Middle East & Africa Transparent Plastics Market Snapshot
Figure 48 South America Transparent Plastic Market Snapshot
Figure 49 Companies Primarily Adopted Both Organic and Inorganic Growth Strategies Between 2013 and 2017
Figure 50 E. I. Du Pont De Nemours and Company: Company Snapshot
Figure 51 The Dow Chemical Company: Company Snapshot
Figure 52 Lyondellbasell Industries Holdings B.V.: Company Snapshot
Figure 53 SABIC: Company Snapshot
Figure 54 Covestro: Company Snapshot
Figure 55 BASF SE: Company Snapshot
Figure 56 INEOS: Company Snapshot
Figure 57 PPG Industries: Company Snapshot
Figure 58 Evonik Industries Ag: Company Snapshot
Figure 59 LANXESS: Company Snapshot
Figure 60 Teijin Limited: Company Snapshot
Figure 61 LG Chem: Company Snapshot
Figure 62 Denka Company Limited: Company Snapshot
Figure 63 Trinseo S.A.: Company Snapshot
Figure 64 Asahi Kasei Corporation: Company Snapshot
Figure 65 Eastman Chemical Company: Company Snapshot
Figure 66 Arkema S.A.: Company Snapshot


Growth opportunities and latent adjacency in Transparent Plastics Market