Tris Nonylphenyl Phosphite Market by Application (Stabilizers, Petrochemicals, Rubber) and Region (Asia-Pacific, North America, Europe, Middle East & Africa and Latin America) - Global Forecast to 2021


[131 Pages Report] The global tris nonylphenyl phosphite market is projected to reach USD 309.8 Million by 2021, at a CAGR of 5.6% from 2016 to 2021.
The objectives of this study are:
- To define, describe, and analyze the global tris nonylphenyl phosphite market on the basis of application and region
- To analyze the short-term and long-term impact of the factors that influence the growth of the market
- To identify opportunities in the market for tris noylphenyl phosphite manufacturers and suppliers
- To study the industry supply chain, pricing analysis and manufacturing cost analysis
- To study company profiles, developments, upcoming trends & technologies, growth strategies, and industry activities
- To identify current and future trends, drivers and restraints in the global tris nonylphenyl phosphite market and end-use applications
Years considered for the study are:
- Base Year � 2015
- Estimated Year � 2016
- Projected Year � 2021
- Forecast Period � 2016 to 2021
For company profiles, 2015 has been considered as the base year. In cases wherein information was unavailable for the base year, the years prior to it have been considered.
Research Methodology
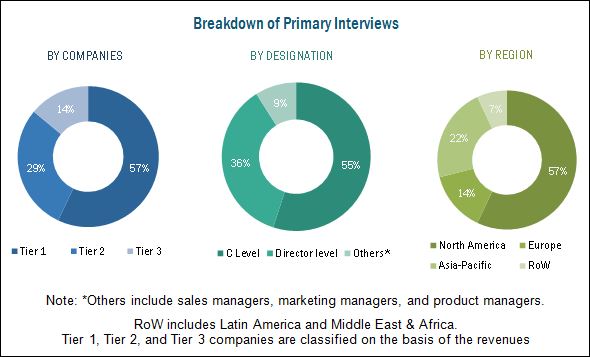
This study aims to estimate the global tris nonylphenyl phosphite market size for 2016 and projects its demand till 2021. It also provides a detailed qualitative and quantitative analysis of the global tris nonylphenyl phosphite market. Various secondary sources that include directories, industry journals, various associations (such as Specialchem, ICCA, CIA, SOCMA) and databases (PubChem, ChemSpider) have been used to identify and collect information useful for this extensive commercial study of the global tris nonylphenyl phosphite market. Primary sources such as experts from related industries and suppliers have been interviewed to obtain and verify critical information as well as to assess future prospects of the global tris nonylphenyl phosphite market. The breakdown of profiles of primaries is shown in the figure below:
To know about the assumptions considered for the study, download the pdf brochure
The value chain of the global tris nonylphenyl phosphite market includes suppliers like Wego Chemical Group (U.S.), phosphite antioxidant manufacturers like Dover Chemicals and Addivant. Some of the buyers of antioxidants are Everspring Chemical Company Co., Ltd. (Taiwan) and Akcros Chemicals (U.S.). The leading players operating in the global tris nonylphenyl phosphite market include Addivant USA, LLC (U.S.), Galata Chemicals Holding GMBH (Germany), Dover Chemical Corporation (U.S), Sterling Auxiliaries Pvt. Ltd. (India), Songwon Industrial Co., Ltd (Korea), Gulf Stabilizers Industries (Saudi Arabia) and the Sandhya Group (India)
Key Target Audience
- Manufacturers of Phosphite Antioxidants
- Traders, Distributors, and Suppliers of Phosphite Antioxidants
- End-use Industries Operating in the Tris Nonylphenyl Phosphite Supply Chain
- Government and Consulting Organizations
- Food Regulators and Other Regulatory Institutions
- Investment Banks and Private Equity Firms
Scope of the Report: This research report categorizes the global tris nonylphenyl phosphite market on the basis of application and region. The report forecasts revenues as well as analyzes the trends in each of the submarkets.
On the Basis of Application:
- Stabilizers
- Petrochemicals
- Rubber
On the Basis of Region:
- Asia-Pacific
- North America
- Europe
- Middle East & Africa
- Latin America
Available Customizations
With the given market data, MarketsandMarkets offers customizations according to the company�s specific needs. The following customization options are available for the report:
Application Analysis
- Further breakdown of the applications and end-use industries into subsegments
The global tris nonylphenyl phosphite (TNPP) market is projected to reach USD 309.8 Million by 2021, at a CAGR of 5.6% from 2016 to 2021. The key factors driving the global tris nonylphenyl phosphite market is the rising demand for phosphite antioxidants from the petrochemical and plastic industries.
The major applications of tris nonylphenyl phosphite are stabilizers, petrochemicals and rubber. Tris nonylphenyl phosphite is one of the most preferred phosphite stabilizers due to its inherent properties. The phosphite stabilizer helps in preserving the color and melt flow during polymer processing. In addition to this, phosphite stabilizers offer better hydrolytic stability which prevents chemical decomposition during transportation and shipping. These product attributes make it a widely preferred material in different applications like petrochemicals, food packaging and hygiene products.
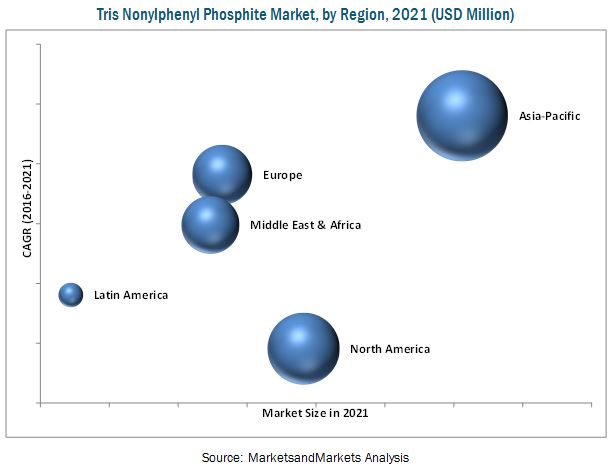
The tris nonylphenyl phosphite market in the Asia-Pacific region is anticipated to grow at the highest CAGR from 2016 to 2021. South Korea and China have witnessed stable economic growth, and the growth of the TNPP market is expected to be higher in these two countries. Moreover, the rising demand from the plastics and rubber based industries is driving the demand for TNPP in the Asia-Pacific region.
The future demand for tris nonylphenyl phosphite is expected to be hampered due to certain regulatory challenges, concerned with the use of phenyl based phosphite antioxidants. Some of the phenyl based antioxidants are not preferred for use in the food packaging industry and this has led to concerns for some of the manufacturers who are now investing in the development of new non-toxic products that can be used in the food packaging industry.
Key companies operating in the global tris nonylphenyl phosphite market include Addivant USA, LLC (U.S.), Galata Chemicals Holding GMBH (Germany), Dover Chemical Corporation (U.S), Sterling Auxiliaries Pvt. Ltd. (India), Songwon Industrial Co., Ltd (Korea), Gulf Stabilizers Industries (Saudi Arabia) and the Sandhya Group (India). These players are engaged in the supply of phosphite antioxidants and have a strong global presence. Companies in North America and Europe are focusing on the addition of capacities and new product developments to meet the growing demand from end-use industries.
To speak to our analyst for a discussion on the above findings, click Speak to Analyst
 Exclusive indicates content/data unique to MarketsandMarkets and not available with any competitors.
Table of Contents
1 Introduction
1.1 Objectives of Study
1.2 Market Definition
1.3 Study Scope
1.4 Currency & Years Considered for Study
1.5 Stakeholders
2 Research Methodology
2.1 Research Data
2.2 Tris Nonylphenyl Phosphite : Research Design
2.3 Market Size Estimation
2.4 Market Breakdown and Data Triangulation
2.5 Research Assumptions
3 Executive Summary
4 Market Overview
4.1 Introduction
4.2 Market Dynamics
4.2.1 Drivers
4.2.2 Restraints
4.2.3 Factors Affecting Prices
4.3 Manufacturing Cost Analysis
4.3.1 Asia-Pacific
4.3.2 Europe
4.3.3 North America
4.3.4 Middle East & Africa
4.3.5 Latin America
4.4 Supply Chain Analysis
4.4.1 Asia-Pacific
4.4.2 North America
4.4.3 Europe
4.4.4 Middle East & Africa
4.4.5 Latin America
5 Tris Nonylphenyl Phosphite Market, By Application
5.1 Introduction
5.2 Tris Nonylphenyl Phosphite Market, By Application
5.3 Plastic Stabilizers
5.4 Rubber Stabilizers
5.5 Others
6 Tris Nonylphenyl Phosphite Market, By Region
6.1 Introduction
6.2 Tris Nonylphenyl Phosphite Market, By Region
6.3 Asia-Pacific
6.4 North America
6.5 Europe
6.6 Middle East & Africa
6.7 Latin America
7 Company Profiles
7.1 Addivant Usa , LLC
7.2 Dover Chemical Corporation
7.3 Galata Chemicals Holding GmbH
7.4 Sterling Auxiliaries Pvt. Ltd.
7.5 Sandhya Group
7.6 Krishna Antioxidants Pvt.Ltd.
7.7 Khera Chemical Industries
7.8 Vesta Intracon B.V.
7.9 Valtris Specialty Chemicals
7.10 Adishank Chemicals Pvt. Ltd
7.11 Hunan Chemical B.V.
7.12 Richyu Chemical Co.
8 Appendix
8.1 Knowledge Store: Marketsandmarkets Subscription Portal Introduction
8.2 Marketsandmarkets Knowledge Store: Snapshot
8.3 Introducing RT: Real-Time Market Intelligence
List of Tables (61 Tables)
Table 1 Tris Nonylphenyl Phosphite Product Properties and Identifiers
Table 2 General Assumptions
Table 3 Asia-Pacific: Manufacturing Cost Analysis, 2014
Table 4 North America: Manufacturing Cost Analysis, 2014
Table 5 Europe: Manufacturing Cost Analysis, 2014
Table 6 MEA: Manufacturing Cost Analysis, 2014
Table 7 Latin America: Manufacturing Cost Analysis, 2014
Table 8 Tris Nonylphenyl Phosphite Market, By Application, 2014�2021 (USD Million)
Table 9 Tris Nonylphenyl Phosphite Market, By Application, 2014�2021 (Tons)
Table 10 Plastic Stabilizers Segment, By Region, 2014�2021 (USD Million)
Table 11 Plastic Stabilizers Segment, By Region, 2014�2021 (Tons)
Table 12 Plastic Stabilizers Segment, By Type , 2014�2021 (USD Million)
Table 13 Plastic Stabilizers Segment, By Type, 2014�2021 (Tons)
Table 14 Rubber Stabilizers Segment, By Region, 2014�2021 (USD Million)
Table 15 Rubber Stabilizers Segment, By Region, 2014�2021 (Tons)
Table 16 Rubber Stabilizers Segment, By Type, 2014�2021 (USD Million)
Table 17 Rubber Stabilizers Segment, By Type, 2014�2021(Tons)
Table 18 Other Application Segment, By Region, 2014�2021 (USD Million)
Table 19 Other Application Segment, By Region, 2014�2021 (Tons)
Table 20 Tris Nonylphenyl Phosphite Market, By Region, 2014�2021 (USD Million)
Table 21 Tris Nonylphenyl Phosphite Market, By Region, 2014�2021(Tons)
Table 22 Asia-Pacific Tris Nonylphenyl Phosphite Market, By Country, 2014�2021 (USD Million)
Table 23 Asia-Pacific Tris Nonylphenyl Phosphite Market, By Country, 2014�2021 (Tons)
Table 24 Asia-Pacific Tris Nonylphenyl Phosphite Market, By Application, 2014�2021 (USD Million)
Table 25 Asia-Pacific Tris Nonylphenyl Phosphite Market, By Application, 2014�2021 (Tons)
Table 26 Asia-Pacific Plastic Stabilizers Segment, By Type, 2014�2021 (USD Million)
Table 27 Asia-Pacific Plastic Stabilizers Segment, By Type, 2014�2021 (Tons)
Table 28 Asia-Pacific Rubber Stabilizers Segment, By Type, 2014�2021 (USD Million)
Table 29 Asia-Pacific Rubber Stabilizers Segment, By Type , 2014�2021 (Tons)
Table 30 North America Tris Nonylphenyl Phosphite Market, By Country, 2014�2021 (USD Million)
Table 31 North America Tris Nonylphenyl Phosphite Market, By Country, 2014�2021 (Tons)
Table 32 North America Tris Nonylphenyl Phosphite Market, By Application, 2014�2021 (USD Million)
Table 33 North America Tris Nonylphenyl Phosphite Market, By Application, 2014�2021 (Tons)
Table 34 North America Plastic Stabilizers Segment, By Type, 2014�2021 (USD Million)
Table 35 North America Plastic Stabilizers Segment, By Type, 2014�2021 (Tons)
Table 36 North America Rubber Stabilizers Segment, By Type, 2014�2021 (USD Million)
Table 37 North America Rubber Stabilizers Segment, By Type , 2014�2021 (Tons)
Table 38 Europe Tris Nonylphenyl Phosphite Market, By Country, 2014�2021 (USD Million)
Table 39 Europe Tris Nonylphenyl Phosphite Market, By Country, 2014�2021 (Tons)
Table 40 Europe Tris Nonylphenyl Phosphite Market, By Application, 2014�2021 (USD Million)
Table 41 Europe Tris Nonylphenyl Phosphite Market, By Application, 2014�2021 (Tons)
Table 42 Europe Plastic Stabilizers Segment, By Type, 2014�2021 (USD Million)
Table 43 Europe Plastic Stabilizers Segment, By Type, 2014�2021 (Tons)
Table 44 Europe Rubber Stabilizers Segment, By Type, 2014�2021 (USD Million)
Table 45 Europe Rubber Stabilizers Segment, By Type , 2014�2021 (Tons)
Table 46 MEA Tris Nonylphenyl Phosphite Market, By Country, 2014�2021 (USD Million)
Table 47 MEA Tris Nonylphenyl Phosphite Market, By Country, 2014�2021 (Tons)
Table 48 MEA Tris Nonylphenyl Phosphite Market, By Application, 2014�2021 (USD Million)
Table 49 MEA Tris Nonylphenyl Phosphite Market, By Application, 2014�2021 (Tons)
Table 50 MEA Plastic Stabilizers Segment, By Type, 2014�2021 (USD Million)
Table 51 MEA Plastic Stabilizers Segment, By Type, 2014�2021 (Tons)
Table 52 MEA Rubber Stabilizers Segment, By Type, 2014�2021 (USD Million)
Table 53 MEA Rubber Stabilizers Segment, By Type , 2014�2021 (Tons)
Table 54 Latin America Tris Nonylphenyl Phosphite Market, By Country, 2014�2021 (USD Million)
Table 55 Latin America Tris Nonylphenyl Phosphite Market, By Country, 2014�2021 (Tons)
Table 56 Latin America Tris Nonylphenyl Phosphite Market, By Application, 2014�2021 (USD Million)
Table 57 Latin America Tris Nonylphenyl Phosphite Market, By Application, 2014�2021 (Tons)
Table 58 Latin America Plastic Stabilizers Segment, By Type, 2014�2021 (USD Million)
Table 59 Latin America Plastic Stabilizers Segment, By Type, 2014�2021 (Tons)
Table 60 Latin America Rubber Stabilizers Segment, By Type, 2014�2021 (USD Million)
Table 61 Latin Americarubber Stabilizers Segment, By Type , 2014�2021 (Tons)
List of Figures (72 Figures)
Figure 1 Tris Nonylphenyl Phosphite Markets Covered
Figure 2 Tris Nonylphenyl Phosphite Market: Research Methodology
Figure 3 Tris Nonylphenyl Phosphite Market: Top Down Approach
Figure 4 Tris Nonylphenyl Phosphite Market: Bottom Up Approach
Figure 5 Tris Nonylphenyl Phosphite Market: Data Triangulation
Figure 6 Asia-Pacific to Witness Highest Growth in the Tris Nonylphenyl Phosphite Market Between 2016 and 2021
Figure 7 Tris Nonylphenyl Phosphite Market: Segmentation
Figure 8 Tris Nonylphenyl Phosphite Market: Drivers and Restraints
Figure 9 Asia-Pacific: Cogs Breakdown, 2014
Figure 10 North America: Cogs Breakdown, 2014
Figure 11 Europe: Cogs Breakdown, 2014
Figure 12 MEA: Cogs Breakdown, 2014
Figure 13 Latin America: Cogs Breakdown, 2014
Figure 14 Asia-Pacific Tris Nonylphenyl Phosphite Market: Supply Chain Analysis
Figure 15 North America Tris Nonylphenyl Phosphite Market: Supply Chain Analysis
Figure 16 Europe Tris Nonylphenyl Phosphite Market: Supply Chain Analysis
Figure 17 Middle East & Africa Tris Nonylphenyl Phosphite Market: Supply Chain Analysis
Figure 18 Latin America Tris Nonylphenyl Phosphite Market: Supply Chain Analysis
Figure 19 Tris Nonylphenyl Phosphite Market, By Application, 2014�2021 (USD Million)
Figure 20 Tris Nonylphenyl Phosphite Market, By Application, 2014�2021 (Tons)
Figure 21 Plastic Stabilizers Segment, By Region, 2014�2021 (USD Million)
Figure 22 Plastic Stabilizers Segment, By Region, 2014�2021 (Tons)
Figure 23 Plastic Stabilizers Segment, By Type , 2014�2021 (USD Million)
Figure 24 Plastic Stabilizers Segment, By Type, 2014�2021 (Tons)
Figure 25 Rubber Stabilizers Segment, By Region, 2014�2021 (USD Million)
Figure 26 Rubber Stabilizers Segment, By Region, 2014�2021 (Tons)
Figure 27 Rubber Stabilizers Segment, By Type, 2014�2021 (USD Million)
Figure 28 Rubber Stabilizers Segment, By Type, 2014�2021 (Tons)
Figure 29 Other Application Segment, By Region, 2014�2021 (USD Million)
Figure 30 Other Application Segment, By Region, 2014�2021 (Tons)
Figure 31 Global Tris Nonylphenyl Phosphite Market, By Region, 2014�2021 (USD Million)
Figure 32 Global Tris Nonylphenyl Phosphite Market, By Region, 2014�2021 (Tons)
Figure 33 Asia-Pacific Tris Nonylphenyl Phosphite Market, By Country, 2014�2021 (USD Million)
Figure 34 Asia-Pacific Tris Nonylphenyl Phosphite Market, By Country, 2014�2021 (Tons)
Figure 35 Asia-Pacific Tris Nonylphenyl Phosphite Market, By Application, 2014�2021 (USD Million)
Figure 36 Asia-Pacific Tris Nonylphenyl Phosphite Market, By Application, 2014�2021 (Tons)
Figure 37 Asia-Pacific Plastic Stabilizers Segment, By Type, 2014�2021 (USD Million)
Figure 38 Asia-Pacific Plastic Stabilizers Segment, By Type, 2014�2021 (Tons)
Figure 39 Asia-Pacific Rubber Stabilizers Segment, By Type, 2014�2021 (USD Million)
Figure 40 Asia-Pacific Rubber Stabilizers Segment, By Type, 2014�2021 (Tons)
Figure 41 North America Tris Nonylphenyl Phosphite Market, By Country, 2014�2021 (USD Million)
Figure 42 North America Tris Nonylphenyl Phosphite Market, By Country, 2014�2021 (Tons)
Figure 43 North America Tris Nonylphenyl Phosphite Market, By Application, 2014�2021 (USD Million)
Figure 44 North America Tris Nonylphenyl Phosphite Market, By Application, 2014�2021 (Tons)
Figure 45 North America Plastic Stabilizers Segment, By Type, 2014�2021 (USD Million)
Figure 46 North America Plastic Stabilizers Segment, By Type, 2014�2021 (Tons)
Figure 47 North America Rubber Stabilizers Segment, By Type, 2014�2021 (USD Million)
Figure 48 North America Rubber Stabilizers Segment, By Type, 2014�2021 (Tons)
Figure 49 Europe Tris Nonylphenyl Phosphite Market, By Country, 2014�2021 (USD Million)
Figure 50 Europe Tris Nonylphenyl Phosphite Market, By Country, 2014�2021 (Tons)
Figure 51 Europe Tris Nonylphenyl Phosphite Market, By Application, 2014�2021 (USD Million)
Figure 52 Europe Tris Nonylphenyl Phosphite Market, By Application, 2014�2021 (Tons)
Figure 53 Europe Plastic Stabilizers Segment, By Type, 2014�2021 (USD Million)
Figure 54 Europe Plastic Stabilizers Segment, By Type, 2014�2021 (Tons)
Figure 55 Europe Rubber Stabilizers Segment, By Type, 2014�2021 (USD Million)
Figure 56 Europe Rubber Stabilizers Segment, By Type, 2014�2021 (Tons)
Figure 57 MEA Tris Nonylphenyl Phosphite Market, By Country, 2014�2021 (USD Million)
Figure 58 MEA Tris Nonylphenyl Phosphite Market, By Country, 2014�2021 (Tons)
Figure 59 MEA Tris Nonylphenyl Phosphite Market, By Application, 2014�2021 (USD Million)
Figure 60 MEA Tris Nonylphenyl Phosphite Market, By Application, 2014�2021 (Tons)
Figure 61 MEA Plastic Stabilizers Segment, By Type, 2014�2021 (USD Million)
Figure 62 MEA Plastic Stabilizers Segment, By Type, 2014�2021 (Tons)
Figure 63 MEA Rubber Stabilizers Segment, By Type, 2014�2021 (USD Million)
Figure 64 MEA Rubber Stabilizers Segment, By Type, 2014�2021 (Tons)
Figure 65 Latin America Tris Nonylphenyl Phosphite Market, By Country, 2014�2021 (USD Million)
Figure 66 Latin America Tris Nonylphenyl Phosphite Market, By Country, 2014�2021 (Tons)
Figure 67 Latin America Tris Nonylphenyl Phosphite Market, By Application, 2014�2021 (USD Million)
Figure 68 Latin America Tris Nonylphenyl Phosphite Market, By Application, 2014�2021 (Tons)
Figure 69 Latin America Plastic Stabilizers Segment, By Type, 2014�2021 (USD Million)
Figure 70 Latin America Plastic Stabilizers Segment, By Type, 2014�2021 (Tons)
Figure 71 Latin America Rubber Stabilizers Segment, By Type, 2014�2021 (USD Million)
Figure 72 Latin America Rubber Stabilizers Segment, By Type, 2014�2021 (Tons)


Growth opportunities and latent adjacency in Tris Nonylphenyl Phosphite Market