Turbochargers compress the combustion air (exhaust gas) and supply it to the engine. The engine aspirates the same volume of air, but due to the higher pressure, more air mass is supplied into the combustion chamber. Consequently, more fuel is burnt to increase the engine's power output according to the speed and swept volume.
Key Drivers:
Key Restraints:
Top 10 Players:
Automotive Turbocharger Market Key Application:
[242 Pages Report] The global automotive turbocharger market is size estimated to be USD 11.1 billion in 2020 and projected to reach USD 18.4 billion by 2025, at a CAGR of 10.5%, from 2020 and 2025. However, due to COVID-19 impact, most countries have imposed a complete lockdown for almost more than two months, which in turn has impacted vehicle production. The automotive turbocharger market is estimated to observed a decline post-COVID-19 due to the impact on vehicle production. The global automotive turbocharger market size post-COVID-19 is expected to be USD 11.1 billion in 2020 and is projected to reach USD 18.4 billion by 2025, at a CAGR of 10.5% from 2020 to 2025. However, a steady recovery post-2020 in vehicle production will support the growth of this market in the coming years. Few other growth contributing factors for automotive turbocharger will further decrease in emission limits and an increase in fuel efficiency limits in upcoming regulations, the shift of the light-duty vehicles towards direct gasoline engines (GDI), thus, increasing the demand for gasoline turbochargers in the coming years.
To know about the assumptions considered for the study, Request for Free Sample Report
The entire automotive industry was still suffering from the decline of vehicle production since the end of 2018 when it was hit by COVID-19 pandemic in late 2019. The COVID-19 impact resulted in the closure of manufacturing & assembly plants, disruption in the exports of the automotive components. This scenario is expected to affect the automotive turbocharger market as its growth is directly related to the production of vehicles. The global production of vehicle pre-COVID-19 was expected to reach from ~90-95 million units in 2020 to ~110-115 million units by 2025. According to OICA, though global vehicle production declined by 5.2% between 2018-2019, the production outlook was supposed to showcase significant growth from 2021-2022 owing to multiple steps taken by OEMs, as well as some government, to attract customers. Hence automotive turbocharger market in the pre-COVID -19 situation was projected to reach USD 21.3 billion by 2025 from USD 13.5 billion in 2020 (in terms of value).
However, due to the COVID-19 pandemic, most countries imposed a complete lockdown for almost more than two months, which in turn has impacted vehicle production. According to the China Association of Automobile Manufacturer, a 33% decline in passenger car production was observed in the first quarter of 2020. Europe has seen production losses at around two million vehicles. According to MarketsandMarkets analysis, the global production of vehicles in 2020 will observe a 15% decline. Several large automakers are having already started vehicle production. For instance, automakers in China, such as Volkswagen, Nissan, Hyundai, and Honda, have announced the reopening of their plants in China. In Europe, Toyota, Volkswagen, and Audi have resumed operations. Considering all these factors, we expect global vehicle production to grow at a rate of 3.3% from 2020 to 2025. The automotive turbocharger market is estimated to observed a decline post-COVID-19 due to the impact on vehicle production. However, a steady recovery post-2020 in vehicle production will support the growth of this market in the coming years.
Various governments across the world have taken strong measures to reduce emissions and the dependency on non-renewable energy resources. Turbocharger helps significantly in reducing vehicular emissions. Using turbocharger reduces the displacement volume of the cylinder, reducing the volume of the fuel required for the same output, and thereby reducing the exhaust emissions of the vehicle. It also increases fuel efficiency. It is because of these reasons the push for the adoption of turbocharger technology has intensified.
The automotive industry is witnessing a global slowdown. The global vehicle production declined by 1% in 2018 and is estimated to drop further in 2019 as reported by the International Organization of Motor Vehicle Manufacturers (OICA). Increase in shared mobility, increasing oil prices, high prices of vehicles, increased stress on promoting electric vehicles are the major factors affecting the automotive industry. This slowdown, in turn, affects the turbocharger industry.
Electric turbochargers offer more power and better fuel efficiency because of the elimination of the turbo lag . It offer various benefits and fewer technical challenges. It also results in less maintenance and cooling oil requirements. Because of the multiple benefits e-turbo has to offer and the increasing demand for better fuel efficiency and power output, it is going to have deeper market penetration in the coming years.
Turbo lag is a major challenge with conventional turbochargers. Most of the diesel engines are equipped with conventional turbos, which have this lag This challenge can be eliminated with the use of e-turbos. E-turbo not only eliminates the turbo lag but also increases the efficiency and fuel economy of the vehicle.
The diesel turbocharger market is matured because all commercial vehicles are mostly diesel-powered, and almost all of them are equipped with turbochargers. Thus, the demand for gasoline turbochargers is growing at a rapid rate. The adoption of TGDI in gasoline vehicles has increased the market for gasoline turbochargers, and stringent emission norms will drive the market further. With growing stringency in emission regulations, OEMs are also shifting toward CNG or alternate fuel vehicles, even in heavy commercial vehicles. Though the penetration of these alternative fuel vehicles is limited, benefits, such as better fuel efficiency, cleaner energy, and lower cost than traditional fuels, are expected to drive the demand for these vehicles in the near future. This would also shift the turbocharger demand.
Turbochargers find indispensable applications in off-highway vehicles such as construction vehicles and agricultural tractors. According to industry experts, low HP tractors do not have turbochargers installed, whereas almost all high HP tractors are equipped usually with turbochargers. Alternatively, nearly all construction equipment are expected to be equipped with turbochargers. As electrification in OHV equipment is estimated to be limited at least till the next 4-5 years, this is not likely to impact the demand for OHV turbochargers in the near future. The construction equipment market has witnessed substantial growth, particularly in emerging economies such as China and India.
A turbocharger is designed in such a way that it usually lasts as long as the engine. It does not require any special maintenance, and inspection is limited to a few periodic checks. When the engine is running at an RPM of anywhere between 2,000 and 6,000, the turbocharger is running at 150,000 RPM. However, factors such as thermal cracking, oxidation/rusting of turbo components, and metal fatigue of rotating parts might damage the turbocharger, which can lead to turbocharger replacement. Considering the higher number of miles driven by HCVs, the replacement rate of turbochargers is very high in these vehicles. HCVs drive the average miles in different regions ranging from 29,000 miles to 30,500 miles per year. Hence, HCVs are estimated to lead the aftermarket demand for turbochargers.
To know about the assumptions considered for the study, download the pdf brochure
COVID-19 pandemic has resulted in a decline in vehicle production. However, Asia Pacific continues to remain the largest vehicle producer globally. Considering the opening of manufacturing plants in China, we expect global vehicle production to grow at a rate of 3.3% from 2020 to 2025. With a significant presence of all leading automobile manufactures, Asia Oceania is the largest producer of passenger cars in the world. Major automobile producing countries in Asia Oceania are China, Japan, India, and South Korea. Asia Oceania is estimated to be the largest market for automotive turbochargers owing to the stringent emission norms implemented in this region. The presence of key players such as IHI, continental AG, Mitsubishi Heavy Industries, BorgWarner, has broadened the scope for turbochargers in this region. Chinas passenger car production is estimated to cross 20 million by 2024, with 50% of them already equipped with TGDI now will expand the turbocharger market. Other emerging economies stress on cleaner vehicles such as Mild hybrid vehicles, and stringent emission norms will positively impact the turbocharger industry in the future.
Automotive turbocharger market is dominated by manufacturers such Honeywell (US), BorgWarner (US), MHI (Japan), IHI (Japan), and Continental (Germany), Bosch Mahle (Germany), Cummins (US), ABB (Switzerland), TEL (India), and Delphi Technologies (UK), Rotomaster International (Canada), Precision Turbo & Engine INC(US), Turbonetics(US), Turbo International (US), Kompressorenabu Bannewitz GMBH(Germany), Turbo Dynamic Ltd.(UK), Fuyuan Turbocharger Co. Ltd.(China), Hunan Tyen Machinery Co. Ltd. (China), Ningbo Motor Industrial Co. Ltd. (China), Calsonic Kansei (Japan).
Report Metric |
Details |
Market Size Available for Years |
20182025 |
Base Year Considered |
2019 |
Forecast Period |
20202025 |
Forecast Units |
Value (USD million/billion) and Volume (000/million units) (for the automotive industry) |
Segments Covered |
Technology, Material, Fuel Type, On- & Off-Highway Vehicles, Aftermarket and Region |
Geographies Covered |
Asia Oceania, Europe, North America, and RoW |
Companies Covered |
Honeywell (US), BorgWarner (US), MHI (Japan), IHI (Japan), and Continental (Germany), Bosch Mahle (Germany), Cummins (US), ABB (Switzerland), TEL (India), and Delphi Technologies (UK), Rotomaster International (Canada), Precision Turbo & Engine INC(US), Turbonetics(US), Turbo International (US), Kompressorenabu Bannewitz GMBH(Germany), Turbo Dynamic Ltd.(UK), Fuyuan Turbocharger Co. Ltd.(China), Hunan Tyen Machinery Co. Ltd. (China), Ningbo Motor Industrial Co. Ltd. (China), Calsonic Kansei (Japan). |
Impact of COVID-19 on the automotive turbocharger market?
COVID-19 has resulted in a decline in vehicle production, which is directly proportionate to the decline in the overall turbocharger market. On the other hand, it is expected that the pandemic effect will help the gasoline turbocharger segment to grow over diesel as diesel engines are expensive, and implementation of new emission regulations further adds to the cost of the diesel engines, especially in light-duty vehicles. In addition to that, the impact of COVID-19 would limit the purchasing power of buyers, which might result in the purchase of gasoline vehicles over diesel vehicles. Therefore, a shift toward gasoline engines or GDI could be observed. Also, to some extent, the pandemic impact would create a positive outlook for ICE vehicles as most of the OEMs have delayed their electric vehicle plans. This, in turn, will create a better chance for the growth of the turbocharger market.
What are the strategies adopted by the automotive turbocharger manufacturers to overcome COVID-19 impact?
In the race to stay competitive and durable, automotive turbocharger manufacture adopted strategies such as merger & acquisition, joint ventures, and new product development.
What are the key market trends impacting the growth of the automotive turbocharger market?
Stricter emission norms such as Euro VI, China VI have propelled the market for turbochargers. Also, increasing demand for lightweight vehicle parts is projected to drive the demand for lightweight materials in turbochargers
How is the market for wastegate turbocharger expected and its demand in the APAC region?
Wastegate turbochargers are expected to hold the largest share (in terms of volume) in 2020, of the total turbochargers market. Wastegate turbochargers, being more economical than VGT type, Asia Oceania is estimated to showcase the most significant demand for this type of turbocharges, as the region prefers economic passenger cars (especially in countries such as China and India). Currently, the installation rate for VGT is lower in Asia. However, owing to its better efficiency (than wastegate turbos) and new emission regulations, which are expected to be introduced in India and China in the coming years, the demand for VGT is likely to increase in Asian countries post-2020.
What opportunities and challenges are faced by the automotive turbocharger market vendors?
Electric turbochargers offer more power and better fuel efficiency because of the elimination of the turbo lag. It offers various benefits and fewer technical challenges. Therefore, Electric turbochargers will give a boost to the future demand for turbochargers. Durable, temperature resistant, economical materials for turbochargers are the challenges faced by the automotive turbocharger market. .
To speak to our analyst for a discussion on the above findings, click Speak to Analyst
TABLE OF CONTENTS
1 INTRODUCTION (Page No. - 33)
1.1 OBJECTIVES
1.2 MARKET DEFINITION
1.3 INCLUSIONS & EXCLUSIONS
1.4 MARKET SCOPE
FIGURE 1 MARKET SEGMENTATION: AUTOMOTIVE TURBOCHARGER MARKET
1.5 LIMITATIONS
1.6 STAKEHOLDERS
2 RESEARCH METHODOLOGY (Page No. - 36)
2.1 RESEARCH DATA
FIGURE 2 AUTOMOTIVE TURBOCHARGER MARKET: RESEARCH DESIGN
FIGURE 3 RESEARCH METHODOLOGY MODEL
2.1.1 SECONDARY DATA
2.1.1.1 Key secondary sources referred for vehicle production
2.1.1.2 Key secondary sources referred for market sizing
2.1.1.3 Key data from secondary sources
2.1.2 PRIMARY DATA
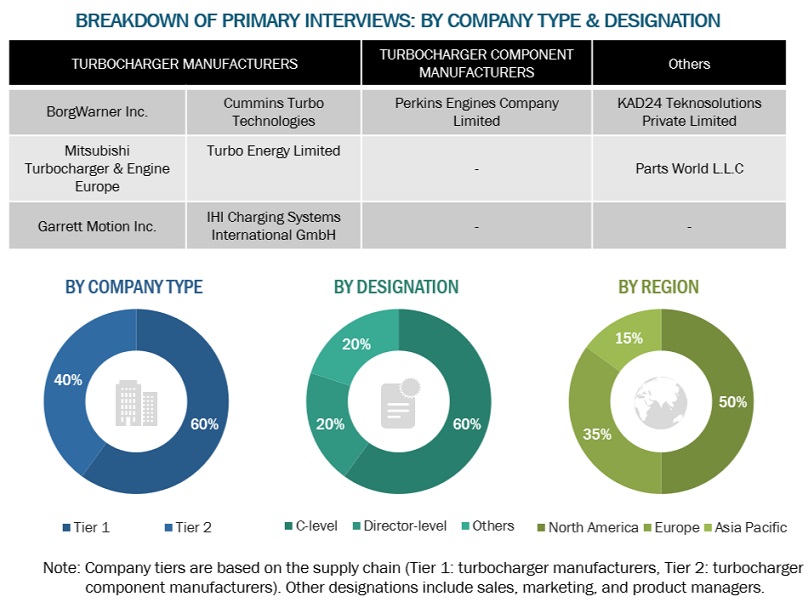
FIGURE 4 BREAKDOWN OF PRIMARY INTERVIEWS
2.1.2.1 Sampling techniques & data collection methods
2.2 MARKET SIZE ESTIMATION
2.2.1 BOTTOM-UP APPROACH: AUTOMOTIVE TURBOCHARGER MARKET
FIGURE 5 APPROACH 1 - BOTTOM-UP APPROACH: AUTOMOTIVE TURBOCHARGER MARKET
2.2.2 BOTTOM-UP APPROACH: OFF-HIGHWAY TURBOCHARGER MARKET
FIGURE 6 BOTTOM-UP APPROACH: OFF-HIGHWAY TURBOCHARGER MARKET
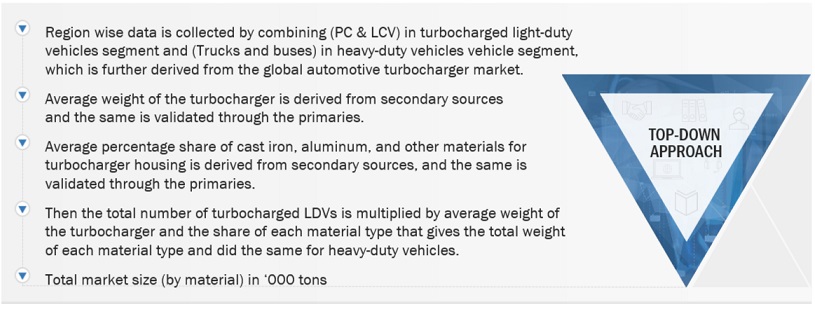
2.2.3 APPROACH 2: TOP-DOWN APPROACH: AUTOMOTIVE TURBOCHARGER MATERIAL MARKET
FIGURE 7 TOP-DOWN APPROACH: AUTOMOTIVE TURBOCHARGER MATERIAL MARKET
2.3 MARKET BREAKDOWN AND DATA TRIANGULATION
FIGURE 8 DATA TRIANGULATION
2.4 ASSUMPTIONS
3 EXECUTIVE SUMMARY (Page No. - 47)
3.1 PRE- & POST-COVID-19 SCENARIO
FIGURE 9 PRE- & POST-COVID-19 SCENARIO: AUTOMOTIVE TURBOCHARGER MARKET, 20182025 (USD MILLION)
FIGURE 10 AUTOMOTIVE TURBOCHARGER: MARKET OUTLOOK
FIGURE 11 AUTOMOTIVE TURBOCHARGER MARKET, BY REGION, 20202025 (USD MILLION)
FIGURE 12 AUTOMOTIVE TURBOCHARGER MARKET, BY REGION, 2020 VS. 2022 VS. 2025 (USD MILLION)
4 AUTOMOTIVE TURBOCHARGER MARKET, PREMIUM INSIGHTS (Page No. - 52)
4.1 ATTRACTIVE OPPORTUNITIES IN AUTOMOTIVE TURBOCHARGER MARKET
FIGURE 13 STRINGENT EMISSION AND FUEL ECONOMY REGULATIONS TO DRIVE THE AUTOMOTIVE TURBOCHARGER MARKET
4.2 AUTOMOTIVE TURBOCHARGER MARKET, BY TECHNOLOGY
FIGURE 14 VARIABLE GEOMETRY TURBOCHARGER TO HOLD THE LARGEST SHARE IN 2020, BY VALUE (USD MILLION)
4.3 AUTOMOTIVE TURBOCHARGER MARKET, BY FUEL TYPE
FIGURE 15 GASOLINE TURBOCHARGERS TO OVERTAKE DIESEL TURBOCHARGERS, BY VALUE (USD MILLION)
4.4 AUTOMOTIVE TURBOCHARGER MARKET, BY VEHICLE TYPE
FIGURE 16 PASSENGER CAR TO BE THE LARGEST AND FASTEST GROWING SEGMENT, BY VALUE (USD MILLION)
4.5 AUTOMOTIVE TURBOCHARGER MARKET, BY MATERIAL
FIGURE 17 CAST IRON SEGMENT TO HOLD THE LARGEST SHARE IN 2020, BY VOLUME (000 TONS)
4.6 AUTOMOTIVE TURBOCHARGER MARKET, BY OFF-HIGHWAY VEHICLES
FIGURE 18 AGRICULTURAL TRACTOR TO BE THE LARGEST OFF-HIGHWAY VEHICLE SEGMENT, BY VALUE (USD MILLION)
4.7 AUTOMOTIVE TURBOCHARGER MARKET, BY REGION
FIGURE 19 ASIA PACIFIC TO DOMINATE DURING THE FORECAST PERIOD
4.8 AUTOMOTIVE TURBOCHARGER AFTERMARKET
FIGURE 20 ASIA PACIFIC TO BE THE LARGEST AFTERMARKET FOR TURBOCHARGERS, BY VALUE (USD MILLION)
5 MARKET OVERVIEW (Page No. - 56)
5.1 INTRODUCTION
5.2 YEARS CONSIDERED FOR THE STUDY
5.3 CURRENCY AND PRICING
TABLE 1 CURRENCY EXCHANGE RATES (WRT PER USD)
5.4 MARKET DYNAMICS
FIGURE 21 AUTOMOTIVE TURBOCHARGER: MARKET DYNAMICS
5.4.1 DRIVERS
5.4.1.1 Decrease in emission limits in upcoming emission regulations
TABLE 2 OVERVIEW OF EMISSION REGULATION SPECIFICATIONS FOR PASSENGER CARS, 20162021
TABLE 3 EMISSION NORMS IN KEY COUNTRIES FOR PASSENGER CARS
FIGURE 22 EMISSION LIMITS CHANGE IN EUROPE
FIGURE 23 EMISSION LIMITS CHANGE IN CHINA CHINA V VS CHINA VI
5.4.1.2 Increased demand for passenger car gasoline engines
FIGURE 24 TREND OF GASOLINE PASSENGER CARS IN EUROPE, 2017-2020 (UNITS)
5.4.2 RESTRAINTS
5.4.2.1 Higher maintenance cost and more cooling oil requirements
5.4.2.2 Decrease in vehicle production in the last few years
FIGURE 25 GLOBAL PASSENGER CAR PRODUCTION, 2017-2019 (MILLION UNITS)
FIGURE 26 GLOBAL ELECTRIC VEHICLE SALES, 2017 VS 2025
5.4.3 OPPORTUNITIES
5.4.3.1 Electric turbochargers will give a boost to the future demand for turbochargers
5.4.4 CHALLENGES
5.4.4.1 Turbo lag
5.4.4.2 Durable, temperature resistant, economical materials for turbochargers
5.5 REVENUE SHIFT FOR THE TURBOCHARGER MANUFACTURERS
FIGURE 27 UPCOMING EMISSION REGULATIONS TO SHIFT THE FOCUS TOWARDS TURBOCHARGED GASOLINE ENGINES AND ELECTRIC PROPULSION
6 COVID-19 IMPACT ANALYSIS (Page No. - 66)
6.1 COVID-19 IMPACT ANALYSIS ON AUTOMOTIVE MARKET
TABLE 4 EUROPE: LOSS IN VEHICLE PRODUCTION DUE TO PLANT SHUTDOWNS, BY COUNTRY, (UNITS)
FIGURE 28 AUTOMOTIVE PRODUCTION: PRE- VS. POST-COVID-19 SCENARIO, 20182025 (000 UNITS)
TABLE 5 AUTOMOTIVE PRODUCTION: PRE- VS. POST-COVID-19 SCENARIO, 20182025 (000 UNITS)
6.2 COVID-19 IMPACT ANALYSIS ON TURBOCHARGER MARKET
6.2.1 AUTOMOTIVE TURBOCHARGER MARKET SCENARIO
FIGURE 29 AUTOMOTIVE TURBOCHARGER MARKET SCENARIO 2018-2025 (USD MILLION)
6.2.1.1 Realistic scenario
TABLE 6 AUTOMOTIVE TURBOCHARGER MARKET (REALISTIC SCENARIO), BY REGION, 20182025 (MILLION USD)
6.2.1.2 High COVID-19 impact scenario
TABLE 7 AUTOMOTIVE TURBOCHARGER MARKET (HIGH COVID-19 IMPACT SCENARIO), BY REGION, 20182025 (MILLION USD)
6.2.1.3 Low COVID-19 impact scenario
TABLE 8 AUTOMOTIVE TURBOCHARGER MARKET (LOW COVID-19 IMPACT SCENARIO), BY REGION, 20182025 (MILLION USD)
7 AUTOMOTIVE TURBOCHARGER MARKET, BY VEHICLE TYPE (Page No. - 71)
7.1 INTRODUCTION
7.1.1 RESEARCH METHODOLOGY
7.1.2 ASSUMPTIONS
7.1.3 INDUSTRY INSIGHTS
7.1.4 GLOBAL VEHICLE PRODUCTION DATA
TABLE 9 GLOBAL VEHICLE PRODUCTION, BY VEHICLE TYPE, 20172019 (000 UNITS)
FIGURE 30 AUTOMOTIVE TURBOCHARGER MARKET, BY VEHICLE TYPE, 2020 VS 2025 (USD MILLION)
TABLE 10 AUTOMOTIVE TURBOCHARGER MARKET, BY VEHICLE TYPE, 20172019 (000 UNITS)
TABLE 11 AUTOMOTIVE TURBOCHARGER MARKET, BY VEHICLE TYPE, 20202025 (000 UNITS)
TABLE 12 AUTOMOTIVE TURBOCHARGER MARKET, BY VEHICLE TYPE, 20172019 (USD MILLION)
TABLE 13 AUTOMOTIVE TURBOCHARGER MARKET, BY VEHICLE TYPE, 20202025 (USD MILLION)
7.2 PASSENGER CARS
7.2.1 INCREASING PASSENGER CAR PRODUCTION WILL BOOST THE TURBOCHARGER MARKET IN ASIA PACIFIC AND EUROPE
TABLE 14 PASSENGER CAR TURBOCHARGER MARKET, BY REGION, 20172019 (000 UNITS)
TABLE 15 PASSENGER CAR TURBOCHARGER MARKET, BY REGION, 20202025 (000 UNITS)
TABLE 16 PASSENGER CAR TURBOCHARGER MARKET, BY REGION, 20172019 (USD MILLION)
TABLE 17 PASSENGER CAR TURBOCHARGER MARKET, BY REGION, 20202025 (USD MILLION)
7.3 LIGHT COMMERCIAL VEHICLES
7.3.1 INCREASING TREND OF TURBOCHARGER APPLICATION IN LCV WILL BOOST THE GROWTH OF THE NORTH AMERICA MARKET
TABLE 18 LIGHT COMMERCIAL VEHICLES TURBOCHARGER MARKET, BY REGION, 20172019 (000 UNITS)
TABLE 19 LIGHT COMMERCIAL VEHICLES TURBOCHARGER MARKET, BY REGION, 20202025 (000 UNITS)
TABLE 20 LIGHT COMMERCIAL VEHICLES TURBOCHARGER MARKET, BY REGION, 20172019 (USD MILLION)
TABLE 21 LIGHT COMMERCIAL VEHICLES TURBOCHARGER MARKET, BY REGION, 20202025 (USD MILLION)
7.4 TRUCK
7.4.1 GROWTH IN CONSTRUCTION, INFRASTRUCTURE & TRANSPORTATION SECTORS TO DRIVE THE AUTOMOTIVE TURBOCHARGER DEMAND
TABLE 22 TRUCK TURBOCHARGER MARKET, BY REGION, 2017-2019 (000 UNITS)
TABLE 23 TRUCK TURBOCHARGER MARKET, BY REGION, 2020-2025 (000 UNITS)
TABLE 24 TRUCK TURBOCHARGER MARKET, BY REGION, 2017-2019 (USD MILLION)
TABLE 25 TRUCK TURBOCHARGER MARKET, BY REGION, 2020-2025 (USD MILLION)
7.5 BUS
7.5.1 INCREASING DEMAND FOR PUBLIC AND PRIVATE TRANSPORTATION TO BOOST THE MARKET FOR BUSES IN ASIA
TABLE 26 BUS TURBOCHARGER MARKET, BY REGION, 20172019 (000 UNITS)
TABLE 27 BUS TURBOCHARGER MARKET, BY REGION, 20202025 (000 UNITS)
TABLE 28 BUS TURBOCHARGER MARKET, BY REGION, 20172019 (USD MILLION)
TABLE 29 BUS TURBOCHARGER MARKET, BY REGION, 20202025 (USD MILLION)
8 AUTOMOTIVE TURBOCHARGER MARKET, BY FUEL TYPE (Page No. - 82)
8.1 INTRODUCTION
8.1.1 RESEARCH METHODOLOGY
8.1.2 ASSUMPTIONS
8.1.3 INDUSTRY INSIGHTS
FIGURE 31 AUTOMOTIVE TURBOCHARGER MARKET, BY FUEL TYPE, 2020 VS 2025 (USD MILLION)
TABLE 30 AUTOMOTIVE TURBOCHARGER MARKET, BY FUEL TYPE, 20172019 (000 UNITS)
TABLE 31 AUTOMOTIVE TURBOCHARGER MARKET, BY FUEL TYPE, 20202025 (000 UNITS)
TABLE 32 AUTOMOTIVE TURBOCHARGER MARKET, BY FUEL TYPE, 20172019 (USD MILLION)
TABLE 33 AUTOMOTIVE TURBOCHARGER MARKET, BY FUEL TYPE, 20202025 (USD MILLION)
8.2 DIESEL
8.2.1 INCREASING STRINGENT EMISSION NORMS WILL IMPACT THE AUTOMOTIVE TURBOCHARGER MARKET
TABLE 34 DIESEL USAGE IN PASSENGER CARS, BY REGION, 2018 VS 2022 VS 2025 (%)
TABLE 35 DIESEL TURBOCHARGER MARKET, BY REGION, 20172019 (000 UNITS)
TABLE 36 DIESEL TURBOCHARGER MARKET, BY REGION, 20202025 (000 UNITS)
TABLE 37 DIESEL TURBOCHARGER MARKET, BY REGION, 20172019 (USD MILLION)
TABLE 38 DIESEL TURBOCHARGER MARKET, BY REGION, 20202025 (USD MILLION)
8.3 GASOLINE
8.3.1 INCREASING DEMAND FROM EUROPE WILL DRIVE THE MARKET FOR GASOLINE VEHICLES
TABLE 39 GASOLINE USAGE IN PASSENGER CARS, BY REGION, 2018 VS 2022 VS 2025 (%)
TABLE 40 GASOLINE TURBOCHARGER MARKET, BY REGION, 20172019 (000 UNITS)
TABLE 41 GASOLINE TURBOCHARGER MARKET, BY REGION, 20202025 (000 UNITS)
TABLE 42 GASOLINE TURBOCHARGER MARKET, BY REGION, 20172019 (USD MILLION)
TABLE 43 GASOLINE TURBOCHARGER MARKET, BY REGION, 20202025 (USD MILLION)
8.4 ALTERNATE FUEL/CNG
8.4.1 SUBSIDIZED PRICE AND ENVIRONMENTAL BENEFITS WILL HELP CNG VEHICLES TO GROW
TABLE 44 CNG USAGE IN PASSENGER CARS, BY REGION, 2018 VS 2022 VS 2025 (%)
TABLE 45 ALTERNATE FUEL/CNG TURBOCHARGER MARKET, BY REGION, 20172019 (000 UNITS)
TABLE 46 ALTERNATE FUEL/CNG TURBOCHARGER MARKET, BY REGION, 20202025 (000 UNITS)
TABLE 47 ALTERNATE FUEL/CNG TURBOCHARGER MARKET, BY REGION, 20172019 (USD MILLION)
TABLE 48 ALTERNATE FUEL/CNG TURBOCHARGER MARKET, BY REGION, 20202025 (USD MILLION)
9 AUTOMOTIVE TURBOCHARGER MARKET, BY TECHNOLOGY (Page No. - 91)
9.1 INTRODUCTION
9.1.1 RESEARCH METHODOLOGY
9.1.2 ASSUMPTIONS
9.1.3 INDUSTRY INSIGHTS
FIGURE 32 AUTOMOTIVE TURBOCHARGER MARKET, BY TECHNOLOGY, 2020 VS 2025 (USD MILLION)
TABLE 49 AUTOMOTIVE TURBOCHARGER MARKET, BY TECHNOLOGY TYPE, 20172019 (000 UNITS)
TABLE 50 AUTOMOTIVE TURBOCHARGER MARKET, BY TECHNOLOGY TYPE, 20202025 (000 UNITS)
TABLE 51 AUTOMOTIVE TURBOCHARGER MARKET, BY TECHNOLOGY TYPE, 20172019 (USD MILLION)
TABLE 52 AUTOMOTIVE TURBOCHARGER MARKET, BY TECHNOLOGY TYPE, 20202025 (USD MILLION)
9.2 VARIABLE GEOMETRY TURBOCHARGER (VGT/VNT)
9.2.1 DEMAND FOR HIGH EFFICIENCY AND LOW CARBON EMISSION TECHNOLOGY WILL DRIVE THE VARIABLE GEOMETRY TURBOCHARGER MARKET
TABLE 53 VGT MARKET, BY REGION, 20172019 (000 UNITS)
TABLE 54 VGT MARKET, BY REGION, 20202025 (000 UNITS)
TABLE 55 VGT MARKET, BY REGION, 20172019 (USD MILLION)
TABLE 56 VGT MARKET, BY REGION, 20202025 (USD MILLION)
9.3 WASTEGATE TURBOCHARGER
9.3.1 INCREASING DEMAND FOR SMALL CARS IN ASIA PACIFIC WILL DRIVE THE WASTEGATE TURBOCHARGER MARKET
TABLE 57 WASTEGATE TURBOCHARGER MARKET, BY REGION, 20172019 (000 UNITS)
TABLE 58 WASTEGATE TURBOCHARGER MARKET, BY REGION, 20202025 (000 UNITS)
TABLE 59 WASTEGATE TURBOCHARGER MARKET, BY REGION, 20172019 (USD MILLION)
TABLE 60 WASTEGATE TURBOCHARGER MARKET, BY REGION, 20202025 (USD MILLION)
9.4 ELECTRIC TURBOCHARGER
9.4.1 USE OF 48V ARCHITECTURE IN FUTURE CARS AND PLUG-IN HYBRID WILL DRIVE THE ELECTRIC TURBOCHARGER MARKET
TABLE 61 ELECTRIC TURBOCHARGER MARKET, BY REGION, 2017-2019 (000 UNITS)
TABLE 62 ELECTRIC TURBOCHARGER MARKET, BY REGION, 2020-2025 (000 UNITS)
TABLE 63 ELECTRIC TURBOCHARGER MARKET, BY REGION, 2017-2019 (USD MILLION)
TABLE 64 ELECTRIC TURBOCHARGER MARKET, BY REGION, 2020-2025 (USD MILLION)
9.5 VARIABLE TWIN SCROLL TURBOCHARGER
9.6 TWIN TURBOCHARGER
9.6.1 TWO STAGE SERIES TURBOCHARGER
9.6.2 TWO STAGE PARALLEL TURBOCHARGER
9.6.3 TWIN SCROLL TURBOCHARGER
9.7 FREE-FLOATING TURBOCHARGER
9.8 DOUBLE AXLE TURBOCHARGER
10 AUTOMOTIVE TURBOCHARGER MARKET, BY MATERIAL (Page No. - 102)
10.1 INTRODUCTION
10.1.1 RESEARCH METHODOLOGY
10.1.2 ASSUMPTIONS
10.1.3 INDUSTRY INSIGHTS
FIGURE 33 AUTOMOTIVE TURBOCHARGER MARKET, BY MATERIAL, 2020 VS 2025 (000 TONS)
TABLE 65 AUTOMOTIVE TURBOCHARGER MARKET, BY MATERIAL, 20172019 (000 TONS)
TABLE 66 AUTOMOTIVE TURBOCHARGER MATERIAL MARKET, BY VEHICLE TYPE, 20172019 (000 TONS)
TABLE 67 AUTOMOTIVE TURBOCHARGER MARKET, BY MATERIAL, 20202025 (000 TONS)
TABLE 68 AUTOMOTIVE TURBOCHARGER MATERIAL MARKET, BY VEHICLE TYPE, 20202025 (000 TONS)
10.2 CAST IRON
10.2.1 DEMAND FOR COST EFFECTIVE AND HEAT RESISTANT MATERIAL WILL HELP THE CAST IRON MARKET TO GROW
TABLE 69 CAST IRON MARKET FOR TURBOCHARGERS, BY VEHICLE TYPE, 20172019 (000 TONS)
TABLE 70 CAST IRON MARKET FOR TURBOCHARGERS, BY VEHICLE TYPE, 20202025 (000 TONS)
10.3 ALUMINUM
10.3.1 USE OF ALUMINUM TURBINE HOUSING IN LDV WILL INCREASE IN FUTURE
TABLE 71 ALUMINUM MARKET FOR TURBOCHARGERS, BY VEHICLE TYPE, 20172019 (000 TONS)
TABLE 72 ALUMINUM MARKET FOR TURBOCHARGERS, BY VEHICLE TYPE, 20202025 (000 TONS)
10.4 OTHER MATERIALS
10.4.1 USE OF OTHER MATERIALS IN PERFORMANCE CARS WILL DRIVE THE TURBOCHARGER MARKET
TABLE 73 OTHER MATERIALS MARKET FOR TURBOCHARGERS, BY VEHICLE TYPE, 20172019 (000 TONS)
TABLE 74 OTHER MATERIALS MARKET FOR TURBOCHARGERS, BY VEHICLE TYPE, 20202025 (000 TONS)
11 AUTOMOTIVE TURBOCHARGER MARKET, BY COMPONENT (Page No. - 109)
11.1 INTRODUCTION
11.1.1 INDUSTRY INSIGHTS
11.2 TURBINE
11.3 COMPRESSOR
11.4 HOUSING
12 OFF-HIGHWAY TURBOCHARGER MARKET, BY INDUSTRY (Page No. - 111)
12.1 INTRODUCTION
FIGURE 34 NRMM UPCOMING VS SPECULATED EMISSION REGULATIONS, 2019-2030
12.1.1 RESEARCH METHODOLOGY
12.1.2 ASSUMPTIONS
12.1.3 INDUSTRY INSIGHTS
FIGURE 35 OFF-HIGHWAY VEHICLE TURBOCHARGER MARKET, BY INDUSTRY, 2020 VS 2025 (USD MILLION)
TABLE 75 OFF-HIGHWAY TURBOCHARGER MARKET, BY INDUSTRY, 20172019 (000 UNITS)
TABLE 76 OFF-HIGHWAY TURBOCHARGER MARKET, BY INDUSTRY, 20202025 (000 UNITS)
TABLE 77 OFF-HIGHWAY VEHICLE TURBOCHARGER MARKET, BY INDUSTRY, 20172019 (USD MILLION)
TABLE 78 OFF-HIGHWAY VEHICLE TURBOCHARGER MARKET, BY INDUSTRY, 20202025 (USD MILLION)
12.2 AGRICULTURE TRACTOR
12.2.1 INCREASING DEMAND FOR HIGH PERFORMANCE POWER TRACTOR WILL DRIVE THE DEMAND FOR AUTOMOTIVE TURBOCHARGER
TABLE 79 AGRICULTURE TRACTOR TURBOCHARGER MARKET, BY REGION, 20172019 (000 UNITS)
TABLE 80 AGRICULTURE TRACTOR TURBOCHARGER MARKET, BY REGION, 20202025 (000 UNITS)
TABLE 81 AGRICULTURE TRACTOR TURBOCHARGER MARKET, BY REGION, 20172019 (USD MILLION)
TABLE 82 AGRICULTURE TRACTOR TURBOCHARGER MARKET, BY REGION, 20202025 (USD MILLION)
12.3 CONSTRUCTION EQUIPMENT
12.3.1 GROWTH IN CONSTRUCTION & INFRASTRUCTURE ACTIVITIES IN ASIA PACIFIC AND NORTH AMERICA WILL DRIVE THE MARKET
TABLE 83 CONSTRUCTION EQUIPMENT TURBOCHARGER MARKET, BY REGION, 20172019 (000 UNITS)
TABLE 84 CONSTRUCTION EQUIPMENT TURBOCHARGER MARKET, BY REGION, 20202025 (000 UNITS)
TABLE 85 CONSTRUCTION EQUIPMENT TURBOCHARGER MARKET, BY REGION, 20172019 (USD MILLION)
TABLE 86 CONSTRUCTION EQUIPMENT TURBOCHARGER MARKET, BY REGION, 20202025 (USD MILLION)
13 AUTOMOTIVE TURBOCHARGER AFTERMARKET, BY VEHICLE TYPE (Page No. - 120)
13.1 INTRODUCTION
13.1.1 RESEARCH METHODOLOGY
13.1.2 ASSUMPTIONS
13.1.3 INDUSTRY INSIGHTS
FIGURE 36 AUTOMOTIVE TURBOCHARGER AFTERMARKET, BY REGION, 2019 VS 2025 (USD MILLION)
TABLE 87 AUTOMOTIVE TURBOCHARGER AFTERMARKET, BY REGION, 20172019 (000 UNITS)
TABLE 88 AUTOMOTIVE TURBOCHARGER AFTERMARKET, BY REGION, 20172025 (000 UNITS)
TABLE 89 AUTOMOTIVE TURBOCHARGER AFTERMARKET, BY REGION, 20172019 (USD MILLION)
TABLE 90 AUTOMOTIVE TURBOCHARGER AFTERMARKET, BY REGION, 20202025 (USD MILLION)
13.2 LIGHT COMMERCIAL VEHICLE (LCV)
13.2.1 INCREASING ADOPTION OF TURBOCHARGER FOR LCV IN NORTH AMERICA WILL BOOST THE DEMAND IN FUTURE
TABLE 91 LCV TURBOCHARGER AFTERMARKET, BY REGION, 20172019 (000 UNITS)
TABLE 92 LCV TURBOCHARGER AFTERMARKET, BY REGION, 20202025 (000 UNITS)
TABLE 93 LCV TURBOCHARGER AFTERMARKET, BY REGION, 20172019 (USD MILLION)
TABLE 94 LCV TURBOCHARGER AFTERMARKET, BY REGION, 20202025 (USD MILLION)
13.3 HEAVY COMMERCIAL VEHICLE (HCV)
13.3.1 HCV WILL LEAD THE MARKET, DUE TO THE HIGH MILES DRIVEN COMPARE WITH THE LCVS
TABLE 95 HCV TURBOCHARGER AFTERMARKET, BY REGION, 20172025 (000 UNITS)
TABLE 96 HCV TURBOCHARGER AFTERMARKET, BY REGION, 20202025 (000 UNITS)
TABLE 97 HCV TURBOCHARGER AFTERMARKET, BY REGION, 20172019 (USD MILLION)
TABLE 98 HCV TURBOCHARGER AFTERMARKET, BY REGION, 20202025 (USD MILLION)
14 AUTOMOTIVE TURBOCHARGER MARKET, BY REGION (Page No. - 128)
14.1 INTRODUCTION
14.1.1 RESEARCH METHODOLOGY
14.1.2 ASSUMPTIONS/LIMITATIONS
14.1.3 INDUSTRY INSIGHTS
FIGURE 37 AUTOMOTIVE TURBOCHARGER MARKET, BY REGION, 20202025 (USD MILLION)
TABLE 99 AUTOMOTIVE TURBOCHARGER MARKET, BY REGION, 20172019 (000 UNITS)
TABLE 100 AUTOMOTIVE TURBOCHARGER MARKET, BY REGION, 20202025 (000 UNITS)
TABLE 101 AUTOMOTIVE TURBOCHARGER MARKET, BY REGION, 20172019 (USD MILLION)
TABLE 102 AUTOMOTIVE TURBOCHARGER MARKET, BY REGION, 20202025 (USD MILLION)
14.2 ASIA PACIFIC
14.2.1 ASIA PACIFIC VEHICLE PRODUCTION DATA
TABLE 103 ASIA PACIFIC: VEHICLE PRODUCTION, BY VEHICLE TYPE, 20172019 (000 UNITS)
FIGURE 38 ASIA PACIFIC: AUTOMOTIVE TURBOCHARGER MARKET SNAPSHOT
TABLE 104 ASIA PACIFIC TURBOCHARGER MARKET, BY COUNTRY, 20172019 (000 UNITS)
TABLE 105 ASIA PACIFIC TURBOCHARGER MARKET, BY COUNTRY, 20202025 (000 UNITS)
TABLE 106 ASIA PACIFIC TURBOCHARGER MARKET, BY COUNTRY, 20172019 (USD MILLION)
TABLE 107 ASIA PACIFIC TURBOCHARGER MARKET, BY COUNTRY, 20202025 (USD MILLION)
14.2.2 CHINA
14.2.2.1 China vehicle production data
TABLE 108 CHINA: VEHICLE PRODUCTION, BY VEHICLE TYPE, 20172019 (000 UNITS)
14.2.2.2 Emission norms, popularity of TGDI will drive the market
TABLE 109 CHINA TURBOCHARGER MARKET, BY VEHICLE TYPE, 20172019 (000 UNITS)
TABLE 110 CHINA TURBOCHARGER MARKET, BY VEHICLE TYPE, 20202025 (000 UNITS)
TABLE 111 CHINA TURBOCHARGER MARKET, BY VEHICLE TYPE, 20172019 (USD MILLION)
TABLE 112 CHINA TURBOCHARGER MARKET, BY VEHICLE TYPE, 20202025 (USD MILLION)
14.2.3 INDIA
14.2.3.1 India vehicle production data
TABLE 113 INDIA: VEHICLE PRODUCTION, BY VEHICLE TYPE, 20172019 (000 UNITS)
14.2.3.2 Increase in gasoline vehicles will drive the market
TABLE 114 INDIA TURBOCHARGER MARKET, BY VEHICLE TYPE, 20172019 (000 UNITS)
TABLE 115 INDIA TURBOCHARGER MARKET, BY VEHICLE TYPE, 20202025 (000 UNITS)
TABLE 116 INDIA TURBOCHARGER MARKET, BY VEHICLE TYPE, 20172019 (USD MILLION)
TABLE 117 INDIA TURBOCHARGER MARKET, BY VEHICLE TYPE, 20202025 (USD MILLION)
14.2.4 JAPAN
14.2.4.1 Increasing use of TGDI engine will drive the market
TABLE 118 JAPAN: VEHICLE PRODUCTION, BY VEHICLE TYPE, 20172019 (000 UNITS)
14.2.4.2 Increased production of HEV will drive the market
TABLE 119 JAPAN TURBOCHARGER MARKET, BY VEHICLE TYPE, 20172019 (000 UNITS)
TABLE 120 JAPAN TURBOCHARGER MARKET, BY VEHICLE TYPE, 20202025 (000 UNITS)
TABLE 121 JAPAN TURBOCHARGER MARKET, BY VEHICLE TYPE, 20172019 (USD MILLION)
TABLE 122 JAPAN TURBOCHARGER MARKET, BY VEHICLE TYPE, 20202025 (USD MILLION)
14.2.5 SOUTH KOREA
14.2.5.1 South Korea vehicle production data
TABLE 123 SOUTH KOREA: VEHICLE PRODUCTION, BY VEHICLE TYPE, 20172019 (000 UNITS)
14.2.5.2 Emission norms, shift towards gasoline will drive the market
TABLE 124 SOUTH KOREA TURBOCHARGER MARKET, BY VEHICLE TYPE, 20172019 (000 UNITS)
TABLE 125 SOUTH KOREA TURBOCHARGER MARKET, BY VEHICLE TYPE, 20202025 (000 UNITS)
TABLE 126 SOUTH KOREA TURBOCHARGER MARKET, BY VEHICLE TYPE, 20172019 (USD MILLION)
TABLE 127 SOUTH KOREA TURBOCHARGER MARKET, BY VEHICLE TYPE, 20202025 (USD MILLION)
14.2.6 THAILAND
14.2.6.1 Thailand vehicle production data
TABLE 128 THAILAND: VEHICLE PRODUCTION, BY VEHICLE TYPE, 20172019 (000 UNITS)
14.2.6.2 Stringent emission norms to drive the market
TABLE 129 THAILAND TURBOCHARGER MARKET, BY VEHICLE TYPE, 20172019 (000 UNITS)
TABLE 130 THAILAND TURBOCHARGER MARKET, BY VEHICLE TYPE, 20202025 (000 UNITS)
TABLE 131 THAILAND TURBOCHARGER MARKET, BY VEHICLE TYPE, 20172019 (USD MILLION)
TABLE 132 THAILAND TURBOCHARGER MARKET, BY VEHICLE TYPE, 20202025 (USD MILLION)
14.2.7 INDONESIA
14.2.7.1 Indonesia vehicle production data
TABLE 133 INDONESIA: VEHICLE PRODUCTION, BY VEHICLE TYPE, 20172019 (000 UNITS)
14.2.7.2 Availability of high-quality gasoline, government incentives to promote clean transportation will drive the market
TABLE 134 INDONESIA TURBOCHARGER MARKET, BY VEHICLE TYPE, 20172019 (000 UNITS)
TABLE 135 INDONESIA TURBOCHARGER MARKET, BY VEHICLE TYPE, 20202025 (000 UNITS)
TABLE 136 INDONESIA TURBOCHARGER MARKET, BY VEHICLE TYPE, 20172019 (USD MILLION)
TABLE 137 INDONESIA TURBOCHARGER MARKET, BY VEHICLE TYPE, 20202025 (USD MILLION)
14.2.8 REST OF ASIA PACIFIC
14.2.8.1 Rest of Asia Pacific vehicle production data
TABLE 138 REST OF ASIA PACIFIC: VEHICLE PRODUCTION, BY VEHICLE TYPE, 20172019 (000 UNITS)
14.2.8.2 Stringent emission norms, growing economy will drive the market
TABLE 139 REST OF ASIA PACIFIC TURBOCHARGER MARKET, BY VEHICLE TYPE, 20172019 (000 UNITS)
TABLE 140 REST OF ASIA PACIFIC TURBOCHARGER MARKET, BY VEHICLE TYPE, 20202025 (000 UNITS)
TABLE 141 REST OF ASIA PACIFIC TURBOCHARGER MARKET, BY VEHICLE TYPE, 20172019 (USD MILLION)
TABLE 142 REST OF ASIA PACIFIC TURBOCHARGER MARKET, BY VEHICLE TYPE, 20202025 (USD MILLION)
14.3 EUROPE
14.3.1 EUROPE VEHICLE PRODUCTION DATA
TABLE 143 EUROPE: VEHICLE PRODUCTION, BY VEHICLE TYPE, 20172019 (000 UNITS)
FIGURE 39 EUROPE: AUTOMOTIVE TURBOCHARGER MARKET SNAPSHOT
TABLE 144 EUROPE TURBOCHARGER MARKET, BY COUNTRY, 20172019 (000 UNITS)
TABLE 145 EUROPE TURBOCHARGER MARKET, BY COUNTRY, 20202025 (000 UNITS)
TABLE 146 EUROPE TURBOCHARGER MARKET, BY COUNTRY, 20172019 (USD MILLION)
TABLE 147 EUROPE TURBOCHARGER MARKET, BY COUNTRY, 20202025 (USD MILLION)
14.3.2 GERMANY
14.3.2.1 Germany vehicle production data
TABLE 148 GERMANY: VEHICLE PRODUCTION, BY VEHICLE TYPE, 20172019 (000 UNITS)
14.3.2.2 Emission norms, shift toward gasoline vehicles will drive the market
TABLE 149 GERMANY TURBOCHARGER MARKET, BY VEHICLE TYPE, 20172019 (000 UNITS)
TABLE 150 GERMANY TURBOCHARGER MARKET, BY VEHICLE TYPE, 20202025 (000 UNITS)
TABLE 151 GERMANY TURBOCHARGER MARKET, BY VEHICLE TYPE, 20172019 (USD MILLION)
TABLE 152 GERMANY TURBOCHARGER MARKET, BY VEHICLE TYPE, 20202025 (USD MILLION)
14.3.3 FRANCE
14.3.3.1 France vehicle production data
TABLE 153 FRANCE: VEHICLE PRODUCTION, BY VEHICLE TYPE, 20172019 (000 UNITS)
14.3.3.2 Production of mild hybrid vehicles, ban on diesel vehicles will drive the market
TABLE 154 FRANCE TURBOCHARGER MARKET, BY VEHICLE TYPE, 20172019 (000 UNITS)
TABLE 155 FRANCE TURBOCHARGER MARKET, BY VEHICLE TYPE, 2020-2025(000 UNITS)
TABLE 156 FRANCE TURBOCHARGER MARKET, BY VEHICLE TYPE, 20172019 (USD MILLION)
TABLE 157 FRANCE TURBOCHARGER MARKET, BY VEHICLE TYPE, 2020-2025 (USD MILLION)
14.3.4 UK
14.3.4.1 UK vehicle production data
TABLE 158 UK: VEHICLE PRODUCTION, BY VEHICLE TYPE, 20172019 (000 UNITS)
14.3.4.2 Lenient gasoline emission norms will drive the market
TABLE 159 UK TURBOCHARGER MARKET, BY VEHICLE TYPE, 20172019 (000 UNITS)
TABLE 160 UK TURBOCHARGER MARKET, BY VEHICLE TYPE, 20202025 (000 UNITS)
TABLE 161 UK TURBOCHARGER MARKET, BY VEHICLE TYPE, 20172019 (USD MILLION)
TABLE 162 UK TURBOCHARGER MARKET, BY VEHICLE TYPE, 20202025 (USD MILLION)
14.3.5 SPAIN
14.3.5.1 Spain vehicle production data
TABLE 163 SPAIN: VEHICLE PRODUCTION, BY VEHICLE TYPE, 20172019 (000 UNITS)
14.3.5.2 Increased sales of gasoline vehicles will drive the market
TABLE 164 SPAIN TURBOCHARGER MARKET, BY VEHICLE TYPE, 20172019 (000 UNITS)
TABLE 165 SPAIN TURBOCHARGER MARKET, BY VEHICLE TYPE, 20202025 (000 UNITS)
TABLE 166 SPAIN TURBOCHARGER MARKET, BY VEHICLE TYPE, 20172019 (USD MILLION)
TABLE 167 SPAIN TURBOCHARGER MARKET, BY VEHICLE TYPE, 20202025 (USD MILLION)
14.3.6 ITALY
14.3.6.1 Italy vehicle production data
TABLE 168 ITALY: VEHICLE PRODUCTION, BY VEHICLE TYPE, 20172019 (000 UNITS)
14.3.6.2 Government subsidies, mild hybrid vehicles will drive the market
TABLE 169 ITALY TURBOCHARGER MARKET, BY VEHICLE TYPE, 20172019 (000 UNITS)
TABLE 170 ITALY TURBOCHARGER MARKET, BY VEHICLE TYPE, 20202025 (000 UNITS)
TABLE 171 ITALY TURBOCHARGER MARKET, BY VEHICLE TYPE, 20172019 (USD MILLION)
TABLE 172 ITALY TURBOCHARGER MARKET, BY VEHICLE TYPE, 20202025 (USD MILLION)
14.3.7 RUSSIA
14.3.7.1 Russia vehicle production data
TABLE 173 RUSSIA: VEHICLE PRODUCTION, BY VEHICLE TYPE, 20172019 (000 UNITS)
14.3.7.2 Stringent emission norms, popularity of NGV will drive the market
TABLE 174 RUSSIA TURBOCHARGER MARKET, BY VEHICLE TYPE, 20172019 (000 UNITS)
TABLE 175 RUSSIA TURBOCHARGER MARKET, BY VEHICLE TYPE, 20202025 (000 UNITS)
TABLE 176 RUSSIA TURBOCHARGER MARKET, BY VEHICLE TYPE, 20172019 (USD MILLION)
TABLE 177 RUSSIA TURBOCHARGER MARKET, BY VEHICLE TYPE, 20202025 (USD MILLION)
14.3.8 TURKEY
14.3.8.1 Turkey vehicle production data
TABLE 178 TURKEY: VEHICLE PRODUCTION, BY VEHICLE TYPE, 20172019 (000 UNITS)
14.3.8.2 Reduced emission limits for diesel vehicles will drive the market
TABLE 179 TURKEY TURBOCHARGER MARKET, BY VEHICLE TYPE, 20172019 (000 UNITS)
TABLE 180 TURKEY TURBOCHARGER MARKET, BY VEHICLE TYPE, 20202025 (000 UNITS)
TABLE 181 TURKEY TURBOCHARGER MARKET, BY VEHICLE TYPE, 20172019 (USD MILLION)
TABLE 182 TURKEY TURBOCHARGER MARKET, BY VEHICLE TYPE, 20202025 (USD MILLION)
14.3.9 POLAND
14.3.9.1 Growing production of heavy duty vehicles, presence of key players will drive the market
14.3.10 SLOVAKIA
14.3.10.1 Stringent emission norms, increased production of passenger cars will drive the market
14.3.11 REST OF EUROPE
14.3.11.1 Rest of Europe vehicle production data
TABLE 183 REST OF EUROPE: VEHICLE PRODUCTION, BY VEHICLE TYPE, 20172019 (000 UNITS)
14.3.11.2 Stringent emission norms, growing economy will drive the market
TABLE 184 REST OF EUROPE TURBOCHARGER MARKET, BY VEHICLE TYPE, 20172019 (000 UNITS)
TABLE 185 REST OF EUROPE TURBOCHARGER MARKET, BY VEHICLE TYPE, 20202025 (000 UNITS)
TABLE 186 REST OF EUROPE TURBOCHARGER MARKET, BY VEHICLE TYPE, 20172019 (USD MILLION)
TABLE 187 REST OF EUROPE TURBOCHARGER MARKET, BY VEHICLE TYPE, 20202025 (USD MILLION)
14.4 NORTH AMERICA
14.4.1 NORTH AMERICA VEHICLE PRODUCTION DATA
TABLE 188 NORTH AMERICA: VEHICLE PRODUCTION, BY VEHICLE TYPE, 20172019 (000 UNITS)
TABLE 189 NORTH AMERICA TURBOCHARGER MARKET, BY VEHICLE TYPE, 20172019 (000 UNITS)
TABLE 190 NORTH AMERICA TURBOCHARGER MARKET, BY COUNTRY, 20202025 (000 UNITS)
TABLE 191 NORTH AMERICA TURBOCHARGER MARKET, BY VEHICLE TYPE, 20172019 (USD MILLION)
TABLE 192 NORTH AMERICA TURBOCHARGER MARKET, BY COUNTRY, 20202025 (USD MILLION)
14.4.2 US
14.4.2.1 US vehicle production data
TABLE 193 US: VEHICLE PRODUCTION, BY VEHICLE TYPE, 20172019 (000 UNITS)
14.4.2.2 Increasing adaption of TGDI engine and, stringent emission norms will drive the market
TABLE 194 US TURBOCHARGER MARKET, BY VEHICLE TYPE, 20172019 (000 UNITS)
TABLE 195 US TURBOCHARGER MARKET, BY VEHICLE TYPE, 20202025 (000 UNITS)
TABLE 196 US TURBOCHARGER MARKET, BY VEHICLE TYPE, 20172025 (USD MILLION)
TABLE 197 US TURBOCHARGER MARKET, BY VEHICLE TYPE, 20202025 (USD MILLION)
14.4.3 CANADA
14.4.3.1 Canada vehicle production data
TABLE 198 CANADA: VEHICLE PRODUCTION, BY VEHICLE TYPE, 20172019 (000 UNITS)
14.4.3.2 Demand for higher fuel economy will drive the market
TABLE 199 CANADA TURBOCHARGER MARKET, BY VEHICLE TYPE, 20172019 (000 UNITS)
TABLE 200 CANADA TURBOCHARGER MARKET, BY VEHICLE TYPE, 20202027 (000 UNITS)
TABLE 201 CANADA TURBOCHARGER MARKET, BY VEHICLE TYPE, 20172025 (USD MILLION)
TABLE 202 CANADA TURBOCHARGER MARKET, BY VEHICLE TYPE, 20202025 (USD MILLION)
14.4.4 MEXICO
14.4.4.1 Mexico vehicle production data
TABLE 203 MEXICO: VEHICLE PRODUCTION, BY VEHICLE TYPE, 20172019 (000 UNITS)
14.4.4.2 Rising fuel prices, stringent emission norms will drive the market
TABLE 204 MEXICO TURBOCHARGER MARKET, BY VEHICLE TYPE, 20172019 (000 UNITS)
TABLE 205 MEXICO TURBOCHARGER MARKET, BY VEHICLE TYPE, 20202025 (000 UNITS)
TABLE 206 MEXICO TURBOCHARGER MARKET, BY VEHICLE TYPE, 20172019 (USD MILLION)
TABLE 207 MEXICO TURBOCHARGER MARKET, BY VEHICLE TYPE, 20202025 (USD MILLION)
14.5 ROW
14.5.1 ROW VEHICLE PRODUCTION DATA
TABLE 208 ROW: VEHICLE PRODUCTION, BY VEHICLE TYPE, 20172019 (000 UNITS)
TABLE 209 ROW TURBOCHARGER MARKET, BY VEHICLE TYPE, 20172019 (000 UNITS)
TABLE 210 ROW TURBOCHARGER MARKET, BY COUNTRY, 20202025 (000 UNITS)
TABLE 211 ROW TURBOCHARGER MARKET, BY VEHICLE TYPE, 20172025 (USD MILLION)
TABLE 212 ROW TURBOCHARGER MARKET, BY COUNTRY, 20202025 (USD MILLION)
14.5.2 BRAZIL
14.5.2.1 Brazil vehicle production data
TABLE 213 BRAZIL: VEHICLE PRODUCTION, BY VEHICLE TYPE, 20172019 (000 UNITS)
14.5.2.2 Increased sales of diesel vehicles, mild hybrid vehicles will drive the market
TABLE 214 BRAZIL TURBOCHARGER MARKET, BY VEHICLE TYPE, 20172019 (000 UNITS)
TABLE 215 BRAZIL TURBOCHARGER MARKET, BY VEHICLE TYPE, 20202025 (000 UNITS)
TABLE 216 BRAZIL TURBOCHARGER MARKET, BY VEHICLE TYPE, 20172025 (USD MILLION)
TABLE 217 BRAZIL TURBOCHARGER MARKET, BY VEHICLE TYPE, 20202025 (USD MILLION)
14.5.3 ARGENTINA
14.5.3.1 Argentina vehicle production data
TABLE 218 ARGENTINA: VEHICLE PRODUCTION, BY VEHICLE TYPE, 20172019 (000 UNITS)
14.5.3.2 Shift toward alternate fuels will drive the market
TABLE 219 ARGENTINA TURBOCHARGER MARKET, BY VEHICLE TYPE, 20172019 (000 UNITS)
TABLE 220 ARGENTINA TURBOCHARGER MARKET, BY VEHICLE TYPE, 20202025 (000 UNITS)
TABLE 221 ARGENTINA TURBOCHARGER MARKET, BY VEHICLE TYPE, 20172025 (USD MILLION)
TABLE 222 ARGENTINA TURBOCHARGER MARKET, BY VEHICLE TYPE, 20202025 (USD MILLION)
14.5.4 IRAN
14.5.4.1 Iran vehicle production data
TABLE 223 IRAN: VEHICLE PRODUCTION, BY VEHICLE TYPE, 20172019 (000 UNITS)
14.5.4.2 Stringent emission norms, exploration of natural gas reserves will drive the market
TABLE 224 IRAN TURBOCHARGER MARKET, BY VEHICLE TYPE, 20172019 (000 UNITS)
TABLE 225 IRAN TURBOCHARGER MARKET, BY VEHICLE TYPE, 20202025 (000 UNITS)
TABLE 226 IRAN TURBOCHARGER MARKET, BY VEHICLE TYPE, 20172019 (USD MILLION)
TABLE 227 IRAN TURBOCHARGER MARKET, BY VEHICLE TYPE, 20202025 (USD MILLION)
14.5.5 SOUTH AFRICA
14.5.5.1 South Africa vehicle production data
TABLE 228 SOUTH AFRICA: VEHICLE PRODUCTION, BY VEHICLE TYPE, 20172019 (000 UNITS)
14.5.5.2 Increased popularity of TGDI, presence of key players will drive the market
TABLE 229 SOUTH AFRICA TURBOCHARGER MARKET, BY VEHICLE TYPE, 20172019 (000 UNITS)
TABLE 230 SOUTH AFRICA TURBOCHARGER MARKET, BY VEHICLE TYPE, 20202025 (000 UNITS)
TABLE 231 SOUTH AFRICA TURBOCHARGER MARKET, BY VEHICLE TYPE, 20172019 (USD MILLION)
TABLE 232 SOUTH AFRICA TURBOCHARGER MARKET, BY VEHICLE TYPE, 20202025 (USD MILLION)
14.5.6 REST OF ROW
14.5.6.1 Rest of RoW vehicle production data
TABLE 233 OTHERS: VEHICLE PRODUCTION, BY VEHICLE TYPE, 20172019 (000 UNITS)
14.5.6.2 Push toward cleaner transportation will drive the market
TABLE 234 REST OF ROW TURBOCHARGER MARKET, BY VEHICLE TYPE, 20172019 (000 UNITS)
TABLE 235 REST OF ROW TURBOCHARGER MARKET, BY VEHICLE TYPE, 20202025 (000 UNITS)
TABLE 236 REST OF ROW TURBOCHARGER MARKET, BY VEHICLE TYPE, 20172019 (USD MILLION)
TABLE 237 REST OF ROW TURBOCHARGER MARKET, BY VEHICLE TYPE, 20202027 (USD MILLION)
15 RECOMMENDATIONS BY MARKETS AND MARKETS (Page No. - 182)
15.1 ASIA PACIFIC WILL BE THE MAJOR MARKET FOR AUTOMOTIVE TURBOCHARGER
15.2 ELECTRIC TURBOCHARGER CAN BE A KEY FOCUS FOR MANUFACTURERS
15.3 CONCLUSION
16 COMPETITIVE LANDSCAPE (Page No. - 183)
16.1 OVERVIEW
FIGURE 40 COMPANIES ADOPTED EXPANSIONS AS THE KEY GROWTH STRATEGY, 20172019
16.2 AUTOMOTIVE TURBOCHARGER MARKET: MARKET RANKING ANALYSIS
FIGURE 41 AUTOMOTIVE TURBOCHARGER MARKET: MARKET RANKING ANALYSIS, 2018
16.3 COMPETITIVE SCENARIO
TABLE 238 CONTRACTS, AGREEMENTS, AND PARTNERSHIPS, 20182019
16.3.1 NEW PRODUCT DEVELOPMENTS
TABLE 239 NEW PRODUCT DEVELOPMENTS, 20182019
16.3.2 EXPANSIONS
TABLE 240 EXPANSIONS, 20172019
16.3.3 COMPETITIVE LEADERSHIP MAPPING
16.3.4 VISIONARY LEADERS
16.3.5 INNOVATORS
16.3.6 DYNAMIC DIFFERENTIATORS
16.3.7 EMERGING COMPANIES
16.4 COMPETITIVE LEADERSHIP MAPPING: TURBOCHARGER MANUFACTURERS
FIGURE 42 AUTOMOTIVE TURBOCHARGER MANUFACTURERS: COMPETITIVE LEADERSHIP MAPPING, 2018
16.4.1 STRENGHT OF PRODUCT PORTFOLIO
16.4.2 BUSINESS STRATEGY EXCELLENCE
16.5 COMPETITIVE LEADERSHIP MAPPING: COMPONENT SUPPLIERS
FIGURE 43 AUTOMOTIVE TURBOCHARGER COMPONENT SUPPLIERS: COMPETITIVE LEADERSHIP MAPPING, 2018
16.5.1 STRENGTH OF PRODUCT PORTFOLIO
16.5.2 BUSINESS STRATEGY EXCELLENCE
16.6 RIGHT TO WIN
17 COMPANY PROFILES (Page No. - 197)
(Business Overview, Products Offered, Recent Developments, SWOT Analysis, MnM View)*
17.1 KEY PLAYERS
17.1.1 HONEYWELL
FIGURE 44 HONEYWELL: COMPANY SNAPSHOT
FIGURE 45 GARRETT MOTION INC.: COMPANY SNAPSHOT
FIGURE 46 SWOT ANALYSIS: HONEYWELL
17.1.2 CONTINENTAL AG
FIGURE 47 CONTINENTAL AG: COMPANY SNAPSHOT (2018)
FIGURE 48 SWOT ANALYSIS: CONTINENTAL AG
17.1.3 BORGWARNER
FIGURE 49 BORGWARNER: COMPANY SNAPSHOT
FIGURE 50 BORGWARNER: SWOT ANALYSIS
17.1.4 MITSUBISHI HEAVY INDUSTRIES
FIGURE 51 MITSUBISHI HEAVY INDUSTRIES: COMPANY SNAPSHOT
FIGURE 52 MITSUBISHI HEAVY INDUSTRIES: SWOT ANALYSIS
17.1.5 IHI
FIGURE 53 IHI: COMPANY SNAPSHOT
FIGURE 54 IHI: SWOT ANALYSIS
17.1.6 BMTS TECHNOLOGY
17.1.7 CUMMINS
FIGURE 55 CUMMINS: COMPANY SNAPSHOT
17.1.8 ABB
FIGURE 56 ABB: COMPANY SNAPSHOT
17.1.9 TEL
17.1.10 DELPHI TECHNOLOGIES
FIGURE 57 DELPHI TECHNOLOGIES: COMPANY SNAPSHOT
17.2 ADDITIONAL COMPANY PROFILES
17.2.1 NORTH AMERICA
17.2.1.1 Rotomaster International
17.2.1.2 Precision Turbo & Engine Inc.
17.2.1.3 Turbonetics Inc.
17.2.1.4 Turbo International
17.2.2 EUROPE
17.2.2.1 Kompressorenbau Bannewitz GmbH
17.2.2.2 Turbo Dynamics Ltd.
17.2.2.3 Cimos
17.2.3 ASIA PACIFIC
17.2.3.1 Calsonic Kansei
17.2.3.2 Weifang FuYuan Turbocharger Co., Ltd.
17.2.3.3 Hunan Tyen Machinery Co., Ltd.
17.2.3.4 Ningbo Motor Industrial Co., Ltd.
*Details on Business Overview, Products Offered, Recent Developments, SWOT Analysis, MnM View might not be captured in case of unlisted companies.
18 AUTOMOTIVE TURBOCHARGER ADJACENT MARKETS (Page No. - 222)
18.1 INTRODUCTION
TABLE 241 AUTOMOTIVE TURBOCHARGER ADJACENT MARKETS
18.2 LIMITATIONS
18.3 AUTOMOTIVE TURBOCHARGER ECOSYSTEM & INTERCONNECTED MARKETS
FIGURE 58 AUTOMOTIVE TURBOCHARGER ECOSYSTEM & INTERCONNECTED MARKETS
18.3.1 MARKET DEFINITION
18.3.2 LIMITATION
18.3.3 MARKET OVERVIEW
FIGURE 59 AIRCRAFT TURBOCHARGERS MARKET SIZE, BY REGION, 2018 VS 2023 (USD MILLION)
18.3.4 AIRCRAFT AND MARINE TURBOCHARGERS MARKET, BY REGION
TABLE 242 AIRCRAFT TURBOCHARGERS MARKET SIZE, BY REGION, 20162023 (USD MILLION)
TABLE 243 MARINE TURBOCHARGERS MARKET SIZE, BY REGION, 20162023 (USD MILLION)
18.4 AUTOMOTIVE SUPERCHARGER MARKET
18.4.1 MARKET DEFINITION
18.4.2 LIMITATIONS
18.4.3 MARKET OVERVIEW
FIGURE 60 AUTOMOTIVE SUPERCHARGER MARKET, BY REGION, 2017 VS. 2025 (USD MILLION)
TABLE 244 AUTOMOTIVE SUPERCHARGER MARKET, BY REGION, 20152025 (THOUSAND UNITS)
TABLE 245 AUTOMOTIVE SUPERCHARGER MARKET, BY REGION, 20152025 (USD MILLION)
18.5 GDI SYSTEM MARKET
18.5.1 MARKET DEFINITION
18.5.2 LIMITATIONS
18.5.3 MARKET OVERVIEW
18.5.4 GDI SYSTEM MARKET
FIGURE 61 GDI SYSTEM MARKET, BY REGION, 2017 VS. 2025 (USD MILLION)
TABLE 246 GDI SYSTEM MARKET, BY REGION, 20152025 (OOO UNITS)
TABLE 247 GDI SYSTEM MARKET, BY REGION, 20152025 (USD MILLION)
18.6 EXHAUST HEAT RECOVERY SYSTEM MARKET
18.6.1 MARKET DEFINITION
18.6.2 LIMITATIONS
18.6.3 MARKET OVERVIEW
FIGURE 62 EXHAUST HEAT RECOVERY SYSTEM MARKET, BY TECHNOLOGY, 2018 VS. 2025 (USD BILLION)
TABLE 248 EXHAUST HEAT RECOVERY SYSTEM MARKET, BY TECHNOLOGY, 20162025 (MILLION UNITS)
TABLE 249 EXHAUST HEAT RECOVERY SYSTEM MARKET, BY TECHNOLOGY, 20162025 (USD BILLION)
19 APPENDIX (Page No. - 234)
19.1 INSIGHTS OF INDUSTRY EXPERTS
19.2 DISCUSSION GUIDE
19.3 KNOWLEDGE STORE: MARKETSANDMARKETS SUBSCRIPTION PORTAL
19.4 AVAILABLE CUSTOMIZATIONS
19.4.1 AUTOMOTIVE TURBOCHARGER MARKET, BY TECHNOLOGY
19.4.1.1 VGT/VNT Market, By Country Mining
19.4.1.2 Wastegate Turbocharger, By Country
19.4.1.3 Electric Turbocharger Market, By Country
19.4.2 VEHICLE TYPE-WISE TURBOCHARGER TECHNOLOGY ANALYSIS
19.4.3 LOCOMOTIVE TURBOCHARGER MARKET, BY REGION
19.4.3.1 Asia Pacific
19.4.3.2 Europe
19.4.3.3 North America
19.4.3.4 RoW
19.4.4 MARINE TURBOCHARGERS MARKET, BY REGION
19.4.4.1 Asia Pacific
19.4.4.2 Europe
19.4.4.3 North America
19.4.4.4 RoW
19.4.5 DETAILED ANALYSIS AND PROFILING OF ADDITIONAL MARKET PLAYERS
19.5 RELATED REPORTS
19.6 AUTHOR DETAILS
The study involved four main activities in estimating the current size of the automotive turbocharger market. Exhaustive secondary research was done to collect information about the Automotive Turbocharger Market, By Technology, Material, On- & Off-Highway Vehicles, Fuel Type, Components, and Region. The next step was to validate these findings, assumptions, and market analysis with industry experts across the value chain through primary research. A mix of top-down and bottom-up approach was employed to estimate the overall market size for different segments considered in this study.
The secondary sources referred for this research study include automotive industry organizations such as International council on clean transportation (ICCT); Organisation Internationale des Constructeurs d'Automobiles (OICA); European Automobile Manufacturers Association (ACEA); The Construction Equipment Association (CEA); Automotive Components manufacturers Association, International Energy Agency (IEA); corporate filings (such as annual reports, investor presentations, and financial statements); and trade, business, and regional component-related associations. Secondary data has been collected and analyzed to arrive at the overall market size, which is further validated by multiple industry experts.
Extensive primary research has been conducted after acquiring an understanding of the automotive turbocharger market scenario through secondary research. Several primary interviews were conducted with industry experts from both the demand- (OEMs and engine manufacturers) and the supply-side (turbocharger manufacturers, material suppliers) across four major regions, namely, Asia Oceania, Europe, North America, and the Rest of the World (RoW). Primary data has been collected through questionnaires, emails, and telephonic interviews. In the canvassing of primaries, we have strived to cover various departments within organizations, such as sales, operations, and administration, to provide a holistic viewpoint in our report.
After interacting with industry experts, we have also conducted brief sessions with highly experienced independent consultants to reinforce the findings from our primaries. This, along with the in-house subject matter experts opinions, has led us to the results as described in the remainder of this report.
To know about the assumptions considered for the study, download the pdf brochure
The bottom-up approach has been used to estimate and validate the size of the turbocharger market. In this approach, the vehicle production statistics for each vehicle type (passenger car, LCV, and HCV) at a country and regional level respectively have been considered. The country-level penetration rate of turbochargers in gasoline and diesel is derived through country-wise model mapping of vehicle types, and the same validated through primary respondents. This gives country-level gasoline and diesel turbochargers market by vehicle type.
Further, it is segmented at the regional level in terms of turbocharger type (wastegate, VGT/VNT, and electric turbocharger). To determine the market size, in terms of value, the country-level market size for the automotive turbocharger is multiplied by the regional average selling price of each turbocharger type. The summation of the country-level market gives the regional market, and further summation of the local market provides the global on-highway turbocharger market. A similar methodology has been followed to estimate the automotive turbocharger market for off-highway vehicles (construction, mining equipment, and agriculture tractors) and electric vehicles (BEV, HEV, and PHEV).
To know about the assumptions considered for the study, Request for Free Sample Report
All percentage shares, splits, and breakdowns have been determined using secondary sources and verified by primary sources. All parameters that are said to affect the markets covered in this research study have been accounted for, viewed in extensive detail, and analyzed to obtain the final quantitative and qualitative data. This data has been consolidated, enhanced with detailed inputs and analysis from MarketsandMarkets, and presented in the report. The following figure is an illustrative representation of the overall market size estimation process employed for this study.
With the given market data, MarketsandMarkets offers customizations according to the companys specific needs.
The following customization options are available for the report:
Benchmarking the rapid strategy shifts of the Top 100 companies in the Automotive Turbocharger Market
Request For Special Pricing
Growth opportunities and latent adjacency in Automotive Turbocharger Market
My focus is the South america market of turbochargers, but i need to know about the international market too. Mainly the quantitative information. Could you send a sample with focus in Brazil and Argentina markets?
I have develop the study to introduce Rapid Prototype for Turbocharger. In order to understand the market trend I wuold like more information to complete my study.
Looking for the upcoming trends in turbocharger as well as Pneumatic actuator requirement in turbocharger
Power Range 200kW-10000kW Market Trends (electrification, e-boost, hybridizationetc.) Which TC is on which engine builder
Evaluating Turbocharger market for opportunities related to Wastegate actuators and other potential business opportunities.