Ultraviolet Analyzer Market by Treatment Type (Liquid, Gas), Device Type (Online, Field), Industry (Oil & Gas, Chemicals & Pharmaceuticals, Environmental, Food & Beverages), Application, and Geography - Global Forecast to 2024


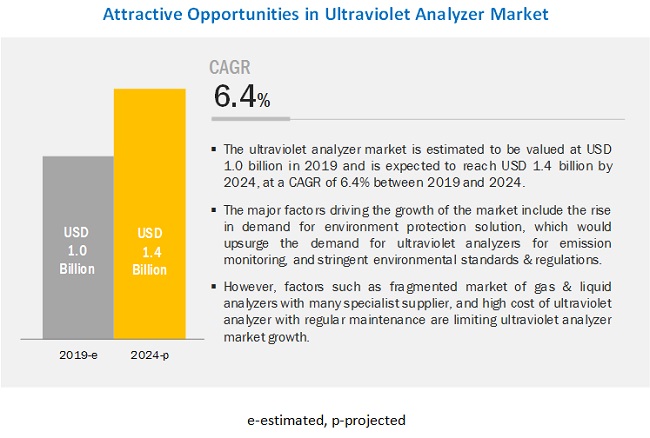
The ultraviolet analyzer market is expected to grow from USD 1.0 billion in 2019 to USD 1.4 billion by 2024, at a CAGR of 6.4% between 2019 and 2024. The rise in demand for environmental protection would upsurge the demand for ultraviolet analyzers for emission monitoring, and stringent environmental standards and regulations are the major factors driving the growth of the market.
�Ultraviolet analyzer market for gas treatment to grow at higher CAGR during the forecast period�
The ultraviolet gas analyzers are used for measurement of concentrations of harmful gases such as sulfides, ammonia, nitrides, and ozone emitted from industries. The growing environmental concerns and need for continuous emission monitoring of these gases, ultraviolet analyzers has high demand in the market. The major vendors offering ultraviolet analyzers for gas analysis include Ametek Process Instruments, Vasthi Instruments, Emerson, and ABB.
�Oil & gas industry to grow at the highest CAGR of ultraviolet analyzer market during the forecast period�
Oil & gas companies worldwide are required to not only minimize emissions but also to measure them continuously. Therefore, there is a growing demand for ultraviolet analyzers for continuous emission monitoring of gases and liquids to meet the increasingly stringent gas emission regulations. Thus, ultraviolet analyzers market for oil & gas industries is growing at the highest CAGR during the forecast period.
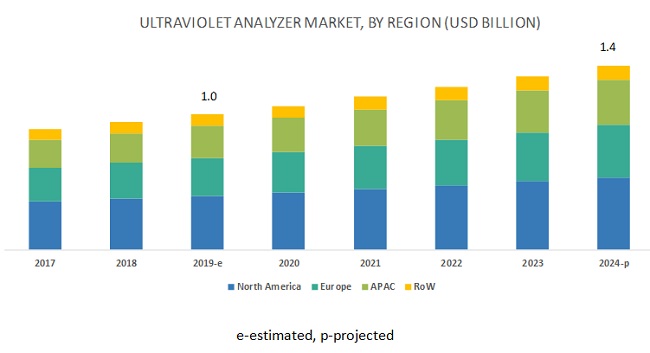
�APAC to account for the largest share of ultraviolet analyzer market during the forecast period�
APAC is expected to hold the largest share of the ultraviolet analyzer market during the forecast period. The stringent air pollution control has driven the market in APAC. Further, the growth is attributed to increasing industrialization and urbanization in the APAC region. Moreover, the growth in power generation companies in countries such as China and India is a major factor responsible for the increasing adoption of ultraviolet analyzers.
Key Market Players
ABB Ltd. (Switzerland), AMETEK, Inc. (US), Emerson Electric Co. (US), Halma plc (UK), Horiba, Ltd (Japan), Teledyne Analytical Instruments Inc. (US), Thermo Fisher Scientific Inc. (US), Xylem Inc. (US), Agilent Technologies Inc. (US), and Hitachi High-Technologies Corporation (Japan) are among a few major players in ultraviolet analyzer market.
Teledyne (US) has a strong presence in the instrumentation market globally and has a strong hold on the US market. It compromises an extensive distribution channel across all major regions. The company markets its products through its board network of sales offices worldwide as well as through its online store in the US. The company focuses on expanding its operations and reaching out to other markets through either acquisitions or strategic partnerships. The company increases its business opportunities with expansion programs through acquisitions. For instance, the company recently acquired Hanson Research (US) to accelerate its development of new products and services.
Thermo Fisher Scientific (US) offers ultraviolet analyzers under its brand Thermo Scientific. These analyzers are used for a wide range of applications, including food and beverage analysis, environmental testing, and industrial quality control. Moreover, the company�s ultraviolet analyzers are designed to measure various combinations of SO2, NOx, CO, NH3, H2S, and other organic compounds for continuous emission monitoring.
Horiba (Japan) is a global group of companies that develops, manufactures, and sells an extensive range of instruments and analytical systems. The company's environmental and process system equipment segment offers water quality monitoring systems, water quality monitor for total nitrogen/phosphorus, monitoring devices, and stack gas analysis systems. The company offers ultraviolet analyzers and related products under the Process & Environmental segment. The company has a strong product portfolio and geographical presence in ultraviolet analyzer market. The company has achieved growth since its foundation and have specialized in measurement technologies. The company spent a significant percentage of revenue, i.e., 7.2% on research and development in 2018. The company offers more than 1,000 products in five of its business segments.
Report Scope
|
Report Metric |
Details |
|
Years considered to provide market size |
2018�2024 |
|
Base year considered |
2018 |
|
Forecast Period |
2019�2024 |
|
Segments Covered |
Treatment Type, Device Type, Application, Industry, and Geography |
|
Geographies Covered |
North Americas, Europe, APAC, and RoW |
|
Companies Covered |
ABB Ltd. (Switzerland), AMETEK, Inc. (US), Emerson Electric Co. (US), Halma plc (UK), Horiba, Ltd (Japan), Teledyne Analytical Instruments Inc. (US), Thermo Fisher Scientific Inc. (US), Xylem Inc. (US), Agilent Technologies Inc. (US), and Hitachi High-Technologies Corporation (Japan)�total 25 players have been covered |
This report categorizes the ultraviolet analyzer market based on treatment type, device type, application, industry, and geography.
By Treatment Type
- Liquid
- Gas
By Device Type
- Online
- Field
By Application
- Liquid
- Pure Water
- Process Liquid
- Wastewater
- Gas
- Air Quality Monitoring
- Emission Monitoring
- Process Monitoring
By Industry
- Semiconductor
- Food & Beverages
- Oil & Gas
- Energy & Power
- Chemical & Pharmaceuticals
- Environmental
- Others (Metal & mining, agriculture, paper & pulp, and marine)
By Geography
- North Americas
- Europe
- APAC
- RoW (South America, Middle East, and Africa)
Key Questions Addressed in the Report
- What are the major applications of ultraviolet analyzers?
- What are the driving factors and opportunities for ultraviolet analyzer market?
- Which region would lead the global market during the forecast period?
- What are the strategies followed by ultraviolet analyzer manufacturers and service providers to stay ahead in the market?
- What is the competitive landscape of the market?
Which are the major industries requires ultraviolet analyzer?
Oil & Gas, Chemicals & Pharmaceuticals, Environmental, Food & Beverages are the major industries require ultraviolet analyzers.
Which region will lead the ultraviolet analyzer market in future?
APAC is expected to lead the power tools market during the forecast period.
What are the driving factors for ultraviolet analyzer market?
Some of the major driving factors for the growth of this market include rise in demand for environmental protection would upsurge the demand for ultraviolet analyzers for emission monitoring, and stringent environmental standards and regulations.
How is the ultraviolet analyzer market segmented?
The ultraviolet analyzer market has been segmented based on device type, application, industry, and region.
What are the opportunities for new market entrants in this market?
The development of ultraviolet analyzer with improved capacity, and growing demand of analyzers from emerging economies would provide growth opportunities for the players operating in this market.
To speak to our analyst for a discussion on the above findings, click Speak to Analyst
 Exclusive indicates content/data unique to MarketsandMarkets and not available with any competitors.
Table of Contents
1 Introduction (Page No. - 16)
1.1 Study Objectives
1.2 Market Definition
1.3 Study Scope
1.3.1 Markets Covered
1.3.2 Years Considered for the Study
1.4 Currency
1.5 Limitations
1.6 Stakeholders
2 Research Methodology (Page No. - 19)
2.1 Research Data
2.1.1 Secondary Data
2.1.1.1 List of Major Secondary Sources
2.1.1.2 Secondary Sources
2.1.2 Primary Data
2.1.2.1 Primary Interviews With Experts
2.1.2.2 Key Data From Primary Sources
2.1.3 Secondary and Primary Research
2.1.3.1 Key Industry Insights
2.1.3.2 Breakdown of Primaries
2.2 Market Size Estimation
2.2.1 Bottom-Up Approach
2.2.1.1 Approach for Arriving at the Market Share By Bottom-Up Approach
2.2.2 Top-Down Approach
2.2.2.1 Approach for Capturing the Market Share By Top-Down Approach
2.3 Market Breakdown and Data Triangulation
2.4 Research Assumptions
3 Executive Summary (Page No. - 28)
4 Premium Insights (Page No. - 32)
4.1 Attractive Growth Opportunities in Ultraviolet Analyzer Market
4.2 Ultraviolet Analyzer Market, By Treatment Type
4.3 Market, By Device Type
4.4 Market, By Gas Application
4.5 Market in APAC, By Industry and Country
4.6 Market, By Geography
5 Market Overview (Page No. - 36)
5.1 Introduction
5.1.1 Drivers
5.1.1.1 Rising Need to Protect the Environment Would Upsurge Demand for Ultraviolet Analyzers for Emission Monitoring
5.1.1.2 Stringent Environmental Standards and Regulations
5.1.2 Restraints
5.1.2.1 High Acquisition and Maintenance Cost
5.1.2.2 Fragmented Market With Many Specialist Suppliers
5.1.3 Opportunities
5.1.3.1 Developing Ultraviolet Analyzers With Improved Capacity
5.1.3.2 Growing Demand From Emerging Economies
5.1.4 Challenges
5.1.4.1 Design Constraints Limiting Compliance With Epa Guidelines for Air Monitoring
5.1.4.2 Lack of Skilled Labor
6 Ultraviolet Analyzer Market, By Treatment Type (Page No. - 40)
6.1 Introduction
6.2 Liquid
6.2.1 Ultraviolet Analyzers are Mostly Used to Monitor Organic Compounds in Liquids
6.3 Gas
6.3.1 Gas Applications to Dominate Ultraviolet Analyzers Market During Forecast Period
7 Ultraviolet Analyzer Market, By Device Type (Page No. - 45)
7.1 Introduction
7.2 Online Devices
7.2.1 Online Ultraviolet Analyzers to Dominate the Market During Forecast Period
7.3 Field Devices
7.3.1 Field Ultraviolet Analyzers are Majorly Used in Water Monitoring, Laboratory Testing, and Air Quality Testing
8 Ultraviolet Analyzer Market, By Application (Page No. - 50)
8.1 Introduction
8.2 Liquid Applications
8.2.1 Pure Water
8.2.1.1 Ultraviolet is One of the Prominent Technologies for Obtaining High-Purity Water
8.2.2 Process Liquid
8.2.2.1 Oil & Gas Industry to Dominate Ultraviolet Analyzer Market for Process Liquid During Forecast Period
8.2.3 Wastewater
8.2.3.1 Ultraviolet Technology-Based Analysis has Been One of the Major Water Treatment Technologies Used in Environmental Industry
8.3 Gas Applications
8.3.1 Air Quality Monitoring
8.3.1.1 Growing Need for Environmental Protection and Stringent Regulations on Sulfur Content in Light Oil and Gasoline Boost the Adoption of Ultraviolet Analyzers
8.3.2 Emission Monitoring
8.3.2.1 Market for Emission Monitoring Expected to Grow at Highest Rate During Forecast Period
8.3.3 Process Monitoring
8.3.3.1 Growing Demand for Minerals and Natural Resources Boost the Growth of Market for Process Monitoring
9 Ultraviolet Analyzer Market, By Industry (Page No. - 59)
9.1 Introduction
9.2 Semiconductor
9.2.1 Growth of Market for Semiconductor Industry is Attributed to the Advent and Adoption of New Technologies
9.3 Food & Beverages
9.3.1 Market for Food & Beverages is Expected to Hold the Largest Market Size in Us
9.4 Chemicals & Pharmaceuticals
9.4.1 Growth of Market for Chemicals & Pharmaceuticals Industry is Attributed to Stringent Environmental Regulations
9.5 Oil & Gas
9.5.1 Oil & Gas Industry to Be the Fastest-Growing Market for Ultraviolet Analyzers
9.6 Energy & Power
9.6.1 Ultraviolet Analyzers are Deployed to Monitor the Levels of Organic Contamination in Energy & Power Industry
9.7 Environmental
9.7.1 Increasing Regulations Globally Regarding Environmental Safety and Pollution Drive the Market
9.8 Others
10 Geographic Analysis (Page No. - 88)
10.1 Introduction
10.2 North America
10.2.1 US
10.2.1.1 US to Dominate Market During Forecast Period
10.2.2 Canada
10.2.2.1 Chemicals & Pharmaceuticals Industry to Dominate Market in Canada
10.2.3 Mexico
10.2.3.1 Manufacturing Activities and Increase in Foreign Direct Investments (FDIS) Drive the Growth of Market in Mexico
10.3 Europe
10.3.1 Germany
10.3.1.1 Germany to Dominate Ultraviolet Analyzer Market in Europe
10.3.2 UK
10.3.2.1 Highly Stringent Government Regulations Drive the Ultraviolet Analyzer Market in UK
10.3.3 France
10.3.3.1 Growing Demand From Oil & Gas Industry to Boost the Growth of Market in France
10.3.4 Rest of Europe
10.4 APAC
10.4.1 China
10.4.1.1 China to Be the Largest Market for Ultraviolet Analyzers in APAC During Forecast Period
10.4.2 Japan
10.4.2.1 Japanese Ultraviolet Analyzer Market Growth to Be Driven By the Expansion of Off-Grid Power Generation Plants
10.4.3 India
10.4.3.1 Increasing Industrialization to Drive the Market in India
10.4.4 Rest of APAC
10.5 RoW
10.5.1 South America
10.5.1.1 Developments in Manufacturing Sector in South America to Drive the Regional Market
10.5.2 Middle East
10.5.2.1 Growth of Oil & Gas Industry in Middle East to Drive Market in RoW
10.5.3 Africa
10.5.3.1 Rapid Urbanization is One of the Major Factors Driving the Market Growth in Africa
11 Competitive Landscape (Page No. - 111)
11.1 Overview
11.2 Ultraviolet Analyzer Market Ranking Analysis
11.3 Competitive Leadership Mapping
11.3.1 Visionary Leaders
11.3.2 Innovators
11.3.3 Dynamic Differentiators
11.3.4 Emerging Companies
11.4 Strength of Product Portfolio (For 25 Players)
11.5 Business Strategy Excellence (For 25 Players)
11.6 Competitive Scenario
11.6.1 Product Launches and Developments
11.6.2 Acquisition, Agreements, and Business Expansions
12 Company Profiles (Page No. - 118)
Business Overview, Products Offered, Recent Developments, SWOT Analysis, and MnM View)*
12.1 Introduction
12.2 Key Players
12.2.1 ABB
12.2.2 Ametek
12.2.3 Emerson
12.2.4 Horiba
12.2.5 Teledyne
12.2.6 Thermo Fisher Scientific
12.2.7 Halma
12.2.8 Xylem
12.3 Other Key Players
12.3.1 Siemens
12.3.2 Servomex
12.3.3 Aeroqual
12.3.4 ECDI
12.3.5 Environnment
12.3.6 Vasthi Instruments
12.3.7 Agilent Technologies
12.3.8 Hitachi High-Technologies
12.3.9 Opsis
12.3.10 Advance Uv Systems
12.3.11 Realtech
12.3.12 Envirotech Instruments
*Details on Business Overview, Products Offered, Recent Developments, SWOT Analysis, and MnM View might not be captured in case of unlisted companies.
13 Appendix (Page No. - 145)
13.1 Discussion Guide
13.2 Knowledge Store: Marketsandmarkets� Subscription Portal
13.3 Available Customizations
13.4 Related Reports
13.5 Author Details
List of Tables (102 Tables)
Table 1 Ultraviolet Analyzer Market, By Treatment Type, 2017�2024 (USD Million)
Table 2 Ultraviolet Analyzer Market for Liquid Treatment, By Device Type, 2017�2024 (USD Million)
Table 3 Market for Liquid Treatment, By Industry, 2017�2024 (USD Million)
Table 4 Market for Gas Treatment, By Device Type, 2017�2024 (USD Million)
Table 5 Market for Gas Treatment, By Industry, 2017�2024 (USD Million)
Table 6 Market, By Device Type, 2017�2024 (USD Million)
Table 7 Online Ultraviolet Analyzer Market, By Treatment Type, 2017�2024 (USD Million)
Table 8 Online Ultraviolet Analyzer, By Liquid Application, 2017�2024 (USD Million)
Table 9 Online Ultraviolet Analyzer, By Gas Application, 2017�2024 (USD Million)
Table 10 Field Ultraviolet Analyzer, By Treatment Type, 2017�2024 (USD Million)
Table 11 Field Ultraviolet Analyzer, By Liquid Application, 2017�2024 (USD Million)
Table 12 Field Ultraviolet Analyzer, By Gas Application, 2017�2024 (USD Million)
Table 13 Market, By Liquid Application, 2017�2024 (USD Million)
Table 14 UV Analyzer Market, By Gas Application, 2017�2024 (USD Million)
Table 15 UV Analyzer Market for Pure Water, By Industry, 2017�2024 (USD Million)
Table 16 Ultraviolet Analyzer Market for Process Liquid, By Industry, 2017�2024 (USD Million)
Table 17 Market for Wastewater Analysis, By Industry, 2017�2024 (USD Million)
Table 18 Market for Air Quality Monitoring, By Industry, 2017�2024 (USD Million)
Table 19 Market for Emission Monitoring, By Industry, 2017�2024 (USD Million)
Table 20 Market for Process Monitoring, By Industry, 2017�2024 (USD Million)
Table 21 Market, By Industry, 2017�2024 (USD Million)
Table 22 Market for Semiconductor, By Treatment Type, 2017�2024 (USD Million)
Table 23 Market for Semiconductor, By Liquid Application, 2017�2024 (USD Million)
Table 24 Market for Semiconductor, By Gas Application, 2017�2024 (USD Million)
Table 25 Market for Semiconductor, By Region, 2017�2024 (USD Million)
Table 26 Market for Semiconductor in North America, By Country, 2017�2024 (USD Million)
Table 27 Market for Semiconductor in Europe, By Country, 2017�2024 (USD Million)
Table 28 Market for Semiconductor in APAC, By Country, 2017�2024 (USD Million)
Table 29 Market for Semiconductor, By RoW, By Region, 2017�2024 (USD Million)
Table 30 Market for Food & Beverages, By Treatment Type, 2017�2024 (USD Million)
Table 31 Market for Food & Beverages, By Liquid Application, 2017�2024 (USD Million)
Table 32 Market for Food & Beverages, By Gas Application, 2017�2024 (USD Million)
Table 33 Market for Food & Beverages, By Region, 2017�2024 (USD Million)
Table 34 Market for Food & Beverages in North America, By Country, 2017�2024 (USD Million)
Table 35 Market for Food & Beverages in Europe, By Country, 2017�2024 (USD Million)
Table 36 Market for Food & Beverages in APAC, By Country, 2017�2024 (USD Million)
Table 37 Market for Food & Beverages in RoW, By Region, 2017�2024 (USD Million)
Table 38 Market for Chemicals & Pharmaceuticals, By Treatment Type, 2017�2024 (USD Million)
Table 39 Market for Chemicals & Pharmaceuticals, By Liquid Application, 2017�2024 (USD Million)
Table 40 Market for Chemicals & Pharmaceuticals, By Gas Application, 2017�2024 (USD Million)
Table 41 Market for Chemicals & Pharmaceuticals, By Region, 2017�2024 (USD Million)
Table 42 Market for Chemicals & Pharmaceuticals in North America, By Country, 2017�2024 (USD Million)
Table 43 Market for Chemicals & Pharmaceuticals in Europe, By Country, 2017�2024 (USD Million)
Table 44 Market for Chemicals & Pharmaceuticals in APAC, By Country, 2017�2024 (USD Million)
Table 45 Market for Chemicals & Pharmaceuticals in RoW, By Region, 2017�2024 (USD Million)
Table 46 Market for Oil & Gas, By Treatment Type, 2017�2024 (USD Million)
Table 47 Market for Oil & Gas, By Liquid Application, 2017�2024 (USD Million)
Table 48 Market for Oil & Gas, By Gas Application, 2017�2024 (USD Million)
Table 49 Market for Oil & Gas, By Region, 2017�2024 (USD Million)
Table 50 Market for Oil & Gas in North America, By Country, 2017�2024 (USD Million)
Table 51 Market for Oil & Gas in Europe, By Country, 2017�2024 (USD Million)
Table 52 Market for Oil & Gas in APAC, By Country, 2017�2024 (USD Million)
Table 53 Market for Oil & Gas in RoW, By Region, 2017�2024 (USD Million)
Table 54 Market for Energy & Power, By Treatment Type, 2017�2024 (USD Million)
Table 55 Market for Energy & Power, By Liquid Application, 2017�2024 (USD Million)
Table 56 Market for Energy & Power, By Gas Application, 2017�2024 (USD Million)
Table 57 Market for Energy & Power, By Region, 2017�2024 (USD Million)
Table 58 Market for Energy & Power in North America, By Country, 2017�2024 (USD Million)
Table 59 Market for Energy & Power in Europe, By Country, 2017�2024 (USD Million)
Table 60 Market for Energy & Power in APAC, By Country, 2017�2024 (USD Million)
Table 61 Market for Energy & Power in RoW, By Country, 2017�2024 (USD Million)
Table 62 Market for Environmental, By Treatment Type, 2017�2024 (USD Million)
Table 63 Market for Environmental, By Liquid Application, 2017�2024 (USD Million)
Table 64 Market for Environmental, By Gas Application, 2017�2024 (USD Million)
Table 65 Market for Environmental, By Region, 2017�2024 (USD Million)
Table 66 Market for Environmental in North America, By Country, 2017�2024 (USD Million)
Table 67 Market for Environmental in Europe, By Country, 2017�2024 (USD Million)
Table 68 Market for Environmental in APAC, By Country, 2017�2024 (USD Million)
Table 69 Market for Environmental in RoW, By Region, 2017�2024 (USD Million)
Table 70 Market for Others, By Treatment Type, 2017�2024 (USD Million)
Table 71 Market for Others, By Liquid Application, 2017�2024 (USD Million)
Table 72 Market for Others, By Gas Application, 2017�2024 (USD Million)
Table 73 Market for Others, By Region, 2017�2024 (USD Million)
Table 74 Market for Others in North America, By Country, 2017�2024 (USD Million)
Table 75 Market for Others in Europe, By Country, 2017�2024 (USD Million)
Table 76 Market for Others in APAC, By Country, 2017�2024 (USD Million)
Table 77 Market for Others in RoW, By Region, 2017�2024 (USD Million)
Table 78 Market, By Region, 2017�2024 (USD Million)
Table 79 Market in North America, By Country, 2017�2024 (USD Million)
Table 80 Market in North America, By Industry, 2017�2024 (USD Million)
Table 81 Market in US, By Industry, 2017�2024 (USD Million)
Table 82 Market in Canada, By Industry, 2017�2024 (USD Million)
Table 83 Market in Mexico, By Industry, 2017�2024 (USD Million)
Table 84 Market in Europe, By Country, 2017�2024 (USD Million)
Table 85 Market in Europe, By Industry, 2017�2024 (USD Million)
Table 86 Market in Germany, By Industry, 2017�2024 (USD Million)
Table 87 Market in UK, By Industry, 2017�2024 (USD Million)
Table 88 Market in France, By Industry, 2017�2024 (USD Million)
Table 89 Market in RoE, By Industry, 2017�2024 (USD Million)
Table 90 Market in APAC, By Country, 2017�2024 (USD Million)
Table 91 Market in APAC, By Industry, 2017�2024 (USD Million)
Table 92 Market in China, By Industry, 2017�2024 (USD Million)
Table 93 Market in Japan, By Industry, 2017�2024 (USD Million)
Table 94 Market in India, By Industry, 2017�2024 (USD Million)
Table 95 Market in RoAPAC, By Industry, 2017�2024 (USD Million)
Table 96 Market in RoW, By Region, 2017�2024 (USD Million)
Table 97 Market in RoW, By Industry, 2017�2024 (USD Million)
Table 98 Market in South America, By Industry, 2017�2024 (USD Million)
Table 99 Market in Middle East, By Industry, 2017�2024 (USD Million)
Table 100 Market in Africa, By Industry, 2017�2024 (USD Million)
Table 101 Product Launches and Developments, 2016�2019
Table 102 Acquisitions, Agreements, and Business Expansions, 2016�2019
List of Figures (53 Figures)
Figure 1 Segmentation of the Ultraviolet Analyzer Market
Figure 2 Market: Research Design
Figure 3 Market: Bottom-Up Approach
Figure 4 Market: Top-Down Approach
Figure 5 Data Triangulation
Figure 6 Assumptions for the Research Study
Figure 7 UV Analyzer Market for Gas to Hold Largest Market Size During Forecast Period
Figure 8 Online UV Analyzer Market to Grow at Higher CAGR During Forecast Period
Figure 9 Emission Monitoring Application of UV Market to Grow at Highest CAGR During Forecast Period
Figure 10 Oil & Gas Industry to Hold Largest Share in Market During Forecast Period
Figure 11 APAC to Hold Largest Share of UV Market in 2018
Figure 12 Growing Need for Environmental Protection Instruments to Boost Adoption of Ultraviolet Analyzers During Forecast Period
Figure 13 UV Analyzer Market for Gas to Grow at A Higher Rate During Forecast Period
Figure 14 Online Devices to Hold Larger Share of UV Analyzer Market in 2024
Figure 15 Air Quality Monitoring to Dominate UV Analyzer Market During Forecast Period
Figure 16 Oil & Gas Industry to Hold Largest Share of UV Analyzer Market in APAC in 2024
Figure 17 North America to Hold Largest Share of UV Analyzer Market in 2024
Figure 18 Rise in Government Investments for Environmental Safety Drives Market
Figure 19 Sulfur Dioxide (SO2) and Nitrogen Oxides (NOX) Emission Data From Power Plants in Us, 2010�2018
Figure 20 UV Analyzer Market, By Treatment Type
Figure 21 Gas Treatment Type to Dominate UV Analyzer Market During Forecast Period
Figure 22 Online Device Type to Dominate UV Analyzer Market for Gas During Forecast Period
Figure 23 UV Analyzer Market, By Device Type
Figure 24 Online Ultraviolet Analyzers to Dominate Market During Forecast Period
Figure 25 Gas Treatment to Dominate Field Market During Forecast Period
Figure 26 UV Analyzer Market, By Application
Figure 27 Process Liquid to Dominate UV Analyzer Market for Liquid Applications During Forecast Period
Figure 28 Oil & Gas Industry to Dominate UV Analyzer Market for Process Liquid During Forecast Period
Figure 29 Oil & Gas Industry to Dominate UV Analyzer Market for Gas During Forecast Period
Figure 30 UV Analyzer Market, By Industry
Figure 31 Oil & Gas to Lead UV Analyzer Market During Forecast Period
Figure 32 US to Dominate UV Analyzer Market for Semiconductor Industry During Forecast Period
Figure 33 Air Quality Monitoring Application to Dominate UV Analyzer Market for Food & Beverages During Forecast Period
Figure 34 Process Liquid to Dominate UV Analyzer Market for Chemicals & Pharmaceuticals Industry During Forecast Period
Figure 35 UV Analyzer Market for Gas Treatment to have High Growth Rate During Forecast Period
Figure 36 Process Liquid to Dominate UV Analyzer Market for Energy & Power During Forecast Period
Figure 37 Air Quality Monitoring to Dominate UV Analyzer Market During Forecast Period
Figure 38 Geographic Snapshot of the UV Analyzer Market
Figure 39 North America to Lead UV Analyzer Market During Forecast Period
Figure 40 North America: Market Snapshot
Figure 41 Europe: Market Snapshot
Figure 42 APAC: Market Snapshot
Figure 43 UV Analyzer Market Players Mainly Adopted Organic Growth Strategies From 2016 to 2019
Figure 44 Ranking of Key Players in the UV Analyzer Market, 2018
Figure 45 UV Analyzer Market (Global) Competitive Leadership Mapping, 2018
Figure 46 ABB: Company Snapshot
Figure 47 Ametek: Company Snapshot
Figure 48 Emerson: Company Snapshot
Figure 49 Horiba: Company Snapshot
Figure 50 Teledyne: Company Snapshot
Figure 51 Thermo Fisher Scientific: Company Snapshot
Figure 52 Halma: Company Snapshot
Figure 53 Xylem: Company Snapshot
The study involved four major activities in estimating the size of the ultraviolet analyzer market. Exhaustive secondary research has been conducted to collect information on the ultraviolet analyzer market. Validation of these findings, assumptions, and sizing with industry experts across the value chain through primary research has been the next step. Both top-down and bottom-up approaches have been employed to estimate the complete market size. After that, market breakdown and data triangulation have been used to estimate the market size of segments.
Secondary Research
In the secondary research, various secondary sources have been referred to for identifying and collecting information important for this study. Secondary sources include corporate filings (such as annual reports, investor presentations, and financial statements); trade, business, and professional associations; white papers, instrumentation and control associations (such as International Society of Automation (ISA), US Environmental Protection Agency (US EPA)), and certified publications; articles from recognized authors; gold and silver standard websites; directories; and databases.
Primary Research
In the primary research, various primary sources from both the supply and demand sides have been interviewed to obtain the qualitative and quantitative information for this report. Primary sources from the supply side include industry experts such as CEOs, VPs, marketing directors, technology and innovation directors, and related key executives from major companies and organizations operating in the ultraviolet analyzer market. Following is the breakdown of primary respondents.
To know about the assumptions considered for the study, download the pdf brochure
Market Size Estimation
Both top-down and bottom-up approaches have been used to estimate and validate the size of the overall ultraviolet analyzer market and the market based on segments. The research methodology used to estimate the market size has been given below:
- Key players in the market have been identified through extensive secondary research.
- The industry�s supply chain and market size, in terms of value, have been determined through primary and secondary research processes.
- All percentage shares, splits, and breakdowns have been determined using secondary sources and verified through primary sources.
Data Triangulation
After arriving at the overall market size�using the estimation processes explained above�the market has been split into several segments. To complete the overall market engineering process and arrive at the exact statistics of each market segment and subsegment, data triangulation, and market breakdown procedures have been employed, wherever applicable. The data has been triangulated by studying various factors and trends in both the demand and supply sides of the ultraviolet analyzer market.
Available Customizations
Along with the market data, MarketsandMarkets offers customizations according to a company�s specific needs. The following customization options are available for the report:
Company Information
- Detailed analysis and profiling of additional market players (up to 5)


Growth opportunities and latent adjacency in Ultraviolet Analyzer Market