TOC Analyzer Market by offering (Hardware, Software, and Services), Type (Online and Portable), Technology, Application (High-Purity Water, Wastewater treatment, Surface Water), Industry, and Geography - Global Forecast to 2036


TOC Analyzer Market Summary
The global TOC Analyzer Market was valued at approximately USD 1.45 billion in 2025 and is projected to reach nearly USD 3.62 billion by 2036, expanding at a CAGR of 8.7% during the forecast period. The market is witnessing substantial growth due to increasing demand for high-precision water quality monitoring, pharmaceutical validation, environmental testing, and industrial process optimization. Growing regulatory requirements related to water purity, wastewater management, and contamination control are significantly contributing to market expansion. Industries such as pharmaceuticals, semiconductors, food & beverages, and chemicals are increasingly deploying Total Organic Carbon (TOC) analyzers to ensure operational compliance and product quality.
Rapid integration of AI-enabled analytics, Industrial IoT platforms, cloud-based monitoring systems, and automation technologies is reshaping the TOC Analyzer Market landscape. Smart TOC analyzers equipped with predictive maintenance capabilities and remote monitoring functionalities are gaining traction across industrial environments. Additionally, digital transformation initiatives in manufacturing and laboratory operations are accelerating the adoption of automated analytical instruments worldwide. Rising investments in smart water infrastructure and sustainability-focused industrial practices are expected to further fuel market growth through 2036.
Key Market Trends & Insights
-
North America dominates the TOC Analyzer Market due to stringent environmental regulations and strong pharmaceutical manufacturing presence.
-
Asia Pacific is projected to witness the fastest growth owing to rapid industrialization and increasing investments in water treatment infrastructure.
-
Online TOC analyzers remain the dominant product segment because of their continuous monitoring capabilities in industrial applications.
-
AI-driven data interpretation and cloud-integrated monitoring platforms are emerging as major technological trends.
-
Pharmaceutical and semiconductor industries are increasingly adopting automated TOC analysis solutions for contamination control.
-
Growing emphasis on sustainability and wastewater recycling is boosting deployment of advanced TOC monitoring systems globally.
Market Size & Forecast
-
Base Year Market Size (2025): USD 1.45 Billion
-
Forecast Market Value (2036): USD 3.62 Billion
-
CAGR (2025–2036): 8.7%
-
Growth is driven by increasing environmental monitoring regulations, industrial automation, pharmaceutical water validation requirements, and smart analytical technologies.
TOC Analyzer Market Top 10 key takeaway
-
The TOC Analyzer Market is projected to grow significantly through 2036 due to rising industrial water quality monitoring demand.
-
Online TOC analyzers account for the largest market share because of real-time monitoring advantages.
-
Pharmaceutical manufacturing remains one of the leading end-use industries.
-
AI-powered analytical platforms are improving operational efficiency and predictive maintenance.
-
Asia Pacific is emerging as the fastest-growing regional market.
-
Smart factories and Industry 4.0 adoption are accelerating analyzer integration.
-
Regulatory compliance related to ultrapure water is supporting market expansion.
-
Cloud-enabled TOC monitoring systems are gaining widespread adoption.
-
Environmental sustainability initiatives are increasing wastewater testing investments.
-
Strategic partnerships and product innovations are intensifying competition among major players.
Product Insights
Online TOC analyzers represent the leading product segment in the TOC Analyzer Market due to their ability to provide continuous, real-time organic carbon monitoring in industrial and laboratory settings. These systems are extensively utilized in pharmaceutical water systems, semiconductor fabrication facilities, and municipal water treatment plants where uninterrupted monitoring is critical for operational safety and compliance. Their capability to reduce manual intervention while improving analytical accuracy makes them highly preferred among industrial operators.
Portable and laboratory TOC analyzers are also gaining popularity across research institutions and environmental monitoring applications. Portable systems are increasingly adopted for field testing due to their compact design, rapid analysis capability, and ease of deployment. Laboratory TOC analyzers continue to play a critical role in scientific research, chemical analysis, and quality assurance processes.
Technological advancements such as AI-based calibration, automated sample handling, touch-screen interfaces, and remote diagnostics are enhancing product performance. Manufacturers are increasingly focusing on miniaturization, low-maintenance designs, and cloud connectivity to improve user efficiency and reduce operational costs. Integration with industrial automation platforms and smart water management systems is further strengthening the adoption of advanced TOC analyzers worldwide.
Technology / Component Insights
Advanced oxidation technology, non-dispersive infrared (NDIR) detection, ultraviolet oxidation, and high-temperature combustion methods are among the core technologies driving the TOC Analyzer Market. High-temperature combustion analyzers remain highly preferred for applications requiring superior measurement precision and broad analytical range. UV-persulfate oxidation technologies are also gaining traction due to their efficiency in ultrapure water analysis and pharmaceutical applications.
AI and Industrial IoT technologies are increasingly transforming TOC analyzer operations. Modern analyzers are equipped with intelligent sensors capable of predictive diagnostics, automated calibration alerts, and real-time data analytics. Cloud computing integration enables centralized monitoring of multiple analyzer systems across industrial facilities, improving operational transparency and decision-making efficiency.
Automation technologies are reducing human intervention in sampling, calibration, and maintenance procedures. Additionally, machine learning algorithms are being used to optimize analyzer performance and detect contamination patterns more accurately. Future innovation trends are expected to include wireless analyzer networks, digital twin integration, edge computing capabilities, and self-learning analytical platforms capable of autonomous operational optimization.
Application Insights
Water treatment applications account for the largest share of the TOC Analyzer Market due to growing concerns related to water contamination, industrial wastewater discharge, and environmental sustainability. Municipal water treatment plants and industrial wastewater facilities increasingly rely on TOC analyzers to monitor organic pollutants and comply with regulatory standards.
The pharmaceutical industry is another major application segment driven by stringent requirements for purified water and water-for-injection systems. TOC analyzers are widely used to ensure pharmaceutical manufacturing compliance with international quality standards. Semiconductor manufacturing is also emerging as a significant application area because ultrapure water plays a critical role in semiconductor fabrication processes.
Food and beverage processing, chemical manufacturing, energy generation, and environmental laboratories are further expanding the application scope of TOC analyzers. Future opportunities are expected to emerge from smart city water management projects, renewable energy facilities, and decentralized industrial monitoring systems powered by AI and IoT technologies.
Regional Insights
North America holds the dominant share in the TOC Analyzer Market owing to strong regulatory frameworks, advanced pharmaceutical manufacturing infrastructure, and early adoption of industrial automation technologies. The United States continues to lead regional growth due to stringent Environmental Protection Agency (EPA) standards and rising investments in smart water monitoring systems.
Europe represents a mature yet steadily growing market supported by environmental sustainability initiatives and increasing adoption of advanced industrial analytics. Countries such as Germany and France are emphasizing wastewater recycling, industrial process optimization, and smart manufacturing integration.
Asia Pacific is expected to register the fastest CAGR during the forecast period due to rapid industrialization, expanding semiconductor manufacturing, and increasing infrastructure investments in countries like China and Japan. Rising urbanization and government-led water quality improvement initiatives are further accelerating market growth across the region.
-
North America leads the market due to strong industrial and pharmaceutical demand.
-
Asia Pacific is projected to record the highest CAGR through 2036.
-
Europe benefits from sustainability-focused industrial policies.
-
China and Japan are investing heavily in smart water management technologies.
-
Industrial automation trends are strengthening regional analyzer adoption worldwide.
[Country]-Specific Market Trends
China is emerging as a major contributor to the TOC Analyzer Market with an estimated CAGR of 10.4% through 2036. Rapid expansion of semiconductor manufacturing, industrial wastewater monitoring, and smart city infrastructure projects are driving demand. Government initiatives focused on pollution control and environmental monitoring are also supporting market growth.
Japan is witnessing increasing adoption of high-precision TOC analyzers across pharmaceutical and electronics industries. Advanced manufacturing practices and strong investments in automation technologies are accelerating the integration of AI-enabled monitoring systems.
The United States remains the largest national market due to extensive pharmaceutical production, advanced water treatment infrastructure, and strict environmental regulations. Canada is also experiencing steady growth driven by industrial water quality monitoring initiatives and sustainability programs. Mexico is gradually expanding its industrial monitoring infrastructure due to manufacturing sector growth.
Germany continues to dominate the European TOC Analyzer Market with strong emphasis on industrial automation and environmental compliance. France is increasingly investing in smart water treatment systems and sustainable industrial operations, supporting analyzer adoption across various industries.
-
China shows the highest regional growth momentum in Asia Pacific.
-
Japan focuses heavily on automation-integrated analytical technologies.
-
The United States remains the largest contributor in North America.
-
Germany leads European industrial monitoring adoption.
-
France is strengthening investments in sustainable water infrastructure.
Key TOC Analyzer Market Company Insights
Major companies operating in the TOC Analyzer Market are focusing on product innovation, AI integration, strategic partnerships, and global expansion strategies to strengthen market positioning. Key players include Shimadzu Corporation, Hach Company, Mettler Toledo, Endress+Hauser, GE Vernova, Xylem Inc., Analytik Jena, and Teledyne Technologies.
These companies are investing heavily in cloud-based monitoring platforms, AI-powered analytical software, and compact analyzer designs to improve operational efficiency. Strategic collaborations with industrial automation providers and water treatment companies are helping manufacturers expand their customer base. Several firms are also focusing on energy-efficient and low-maintenance analyzer systems to align with sustainability goals.
-
Companies are investing heavily in AI-enabled analyzer technologies.
-
Cloud connectivity and remote monitoring features are becoming standard offerings.
-
Strategic partnerships are accelerating market penetration.
-
Product miniaturization and automation remain key innovation priorities.
-
Sustainability-focused analyzer designs are gaining importance globally.
Recent Developments
In 2025, Shimadzu Corporation introduced a next-generation AI-enabled TOC analyzer designed for pharmaceutical ultrapure water applications with predictive maintenance capabilities and cloud-based diagnostics.
In 2024, Endress+Hauser partnered with a leading industrial automation provider to integrate smart TOC monitoring systems into Industry 4.0 manufacturing environments for real-time water quality optimization.
In 2025, Mettler Toledo launched a compact portable TOC analyzer featuring IoT-enabled connectivity and advanced touchscreen interfaces targeted at environmental testing laboratories.
Market Segmentation
The TOC Analyzer Market is segmented by product, technology, application, and region. By product, the market includes online TOC analyzers, portable TOC analyzers, and laboratory TOC analyzers. Online systems dominate the market due to their real-time industrial monitoring capabilities. Portable analyzers are witnessing rapid growth in field testing applications, while laboratory analyzers remain essential in research and quality assurance activities.
By technology, the market is categorized into high-temperature combustion, UV oxidation, UV-persulfate oxidation, and membrane conductivity methods. High-temperature combustion technology holds a substantial market share because of its high analytical accuracy and broad application range.
Based on application, the market serves pharmaceutical manufacturing, water treatment, semiconductor production, food & beverages, environmental monitoring, and chemical processing industries. Water treatment and pharmaceuticals remain the leading application areas due to increasing regulatory compliance requirements.
Regionally, North America leads the market, followed by Europe and Asia Pacific. Asia Pacific is expected to experience the fastest growth owing to expanding industrial infrastructure and rising investments in digital monitoring systems.
-
Online TOC analyzers dominate product segmentation.
-
High-temperature combustion remains the leading analytical technology.
-
Water treatment is the largest application segment.
-
Pharmaceutical and semiconductor sectors continue to drive innovation.
-
Asia Pacific is projected to witness the fastest regional growth.
The TOC Analyzer Market is poised for substantial expansion through 2036, supported by increasing demand for advanced water quality monitoring, environmental compliance, and industrial process optimization. AI integration, Industrial IoT connectivity, cloud-based analytics, and automation technologies are transforming traditional TOC analysis into intelligent, real-time monitoring ecosystems. Industries are increasingly prioritizing contamination control, operational efficiency, and sustainability, creating strong demand for next-generation TOC analyzers.
As digital transformation accelerates across manufacturing, pharmaceuticals, and environmental infrastructure, TOC analyzers will become increasingly strategic for industrial operations worldwide. Companies investing in AI-powered analytical systems, predictive diagnostics, and smart monitoring capabilities are expected to gain significant competitive advantages in the evolving global market landscape through 2036.
FAQs
1. What is the current size of the TOC Analyzer Market?
The TOC Analyzer Market was valued at approximately USD 1.45 billion in 2025.
2. What is the expected growth rate of the TOC Analyzer Market?
The market is projected to grow at a CAGR of 8.7% from 2025 to 2036.
3. What are the key drivers of the TOC Analyzer Market?
Major growth drivers include increasing environmental regulations, pharmaceutical water quality requirements, industrial automation, AI integration, and smart water management initiatives.
4. Which region leads the TOC Analyzer Market?
North America currently leads the market due to strong regulatory frameworks and advanced industrial infrastructure.
5. Which companies are prominent in the TOC Analyzer Market?
Key companies include Shimadzu Corporation, Hach Company, Mettler Toledo, Endress+Hauser, and Teledyne Technologies.
To speak to our analyst for a discussion on the above findings, click Speak to Analyst
 Exclusive indicates content/data unique to MarketsandMarkets and not available with any competitors.
Table of Contents
1 Introduction (Page No. - 15)
1.1 Objectives of the Study
1.2 Definition
1.3 Scope of the Study
1.3.1 Geographic Scope
1.3.2 Years Considered for the Study
1.4 Currency
1.5 Limitations
1.6 Stakeholders
2 Research Methodology (Page No. - 19)
2.1 Research Data
2.2 Secondary and Primary Research
2.2.1 Secondary Data
2.2.1.1 Secondary Sources
2.2.2 Primary Data
2.2.2.1 Key Data From Primary Sources
2.2.2.2 Key Industry Insights
2.2.2.3 Breakdown of Primaries
2.3 Market Size Estimation
2.3.1 Bottom-Up Approach
2.3.1.1 Approach for Arriving at the Market Share By Bottom-Up Approach (Demand Side)
2.3.2 Top-Down Approach
2.3.2.1 Approach for Arriving at the Market Share By Top-Down Analysis (Supply Side)
2.4 Market Breakdown and Data Triangulation
2.5 Research Assumptions
3 Executive Summary (Page No. - 29)
4 Premium Insights (Page No. - 36)
4.1 Market Expected to Have Huge Growth Opportunities in APAC
4.2 Market, By Offering
4.3 Market, By Region and Industry
4.4 Market, By Type
4.5 Market, By Country (2017)
5 Market Overview (Page No. - 39)
5.1 Introduction
5.2 Market Dynamics
5.2.1 Drivers
5.2.1.1 Benefits of TOC Analysis Over Bod and Cod Analyses
5.2.1.2 Increasing Adoption of Preventive and Predictive Maintenance Services
5.2.1.3 Rising Demand for Water and Wastewater Treatments
5.2.1.4 Growing Application Areas of TOC Analyzers Across Various Industries
5.2.2 Restraints
5.2.2.1 High Cost of Ownership
5.2.3 Opportunities
5.2.3.1 Growing Government Initiatives and Policies Related to Water and Wastewater Treatment
5.2.3.2 Technological Innovations With Improved Capabilities
5.2.4 Challenges
5.2.4.1 Technical Challenges Related to Reliability of Analyzers
5.2.4.2 Need for Expertise to Operate TOC Analyzers
6 Industry Trends (Page No. - 45)
6.1 Introduction
6.2 Value Chain Analysis
6.3 Regulatory Standards
6.3.1 Pharmacopoeia
6.3.2 Food and Drug Administration
6.3.3 American Society for Testing and Materials
6.3.4 International Organization for Standardization
6.3.5 Environmental Protection Agency (EPA)
6.3.6 Standard Methods
7 TOC Analyzer Market, By Offering (Page No. - 50)
7.1 Introduction
7.2 Hardware
7.3 Software
7.3.1 Data Integration
7.3.2 Diagnostic Reporting
7.3.3 Parameter Calculation
7.4 Services
8 TOC Analyzer Market, By Type (Page No. - 55)
8.1 Introduction
8.2 Online
8.3 Laboratory
9 TOC Analyzer Market, By Technology (Page No. - 63)
9.1 Introduction
9.2 Ultraviolet (UV) Oxidation
9.3 UV Persulfate Oxidation
9.4 High-Temperature Combustion
9.5 Others
10 TOC Analyzer Market, By Application (Page No. - 72)
10.1 Introduction
10.2 High Purity Water
10.3 Water for Injection
10.4 Source/Drinking Water
10.5 Industrial Process Water
10.6 Wastewater Treatment
10.7 Surface Water
11 TOC Analyzer Market, By Industry (Page No. - 85)
11.1 Introduction
11.2 Pharmaceutical
11.3 Environmental
11.4 Energy and Power
11.5 Semiconductor
11.6 Oil and Gas
11.7 Chemical
11.8 Food and Beverages
11.9 Others
12 Geographic Analysis (Page No. - 105)
12.1 Introduction
12.2 North America
12.2.1 US
12.2.1.1 US Held the Largest Share of Market in 2016
12.2.2 Canada
12.2.2.1 Canadian Market Expected to Grow at the Highest CAGR During the Forecast Period
12.2.3 Mexico
12.2.3.1 Growing Need for Water and Wastewater Treatment Technologies Would Lead to the market Growth in the Near Future
12.3 Europe
12.3.1 Germany
12.3.1.1 Germany Held the Largest Share of the European TOC Analyzer Market in 2016
12.3.2 UK
12.3.2.1 Significant Market for TOC Analyzers in the Water Industry
12.3.3 France
12.3.3.1 Water and Wastewater Treatment Applications in France Drive the Growth of the market
12.3.4 Rest of Europe
12.3.4.1 Growing Opportunity From Metals and Mining Industry
12.4 Asia Pacific (APAC)
12.4.1 China
12.4.1.1 Increasing Adoption From Manufacturing Industries Fueling the Market in China
12.4.2 Japan
12.4.2.1 Significant Growth of Semiconductor and Pharmaceuticals Industries Drive the Market in Japan
12.4.3 India
12.4.3.1 Proactive Initiatives Taken By the Indian Government Encouraging the Growth of the market
12.4.4 Rest of APAC
12.4.4.1 Australia and South Korea are Emerging Markets With Significant Potential
12.5 Rest of the World (RoW)
12.5.1 Middle East
12.5.1.1 Infrastructure Development in Oil and Gas Sector in the Middle East to Drive the market
12.5.2 South America
12.5.2.1 South America to Hold A Significant Share of the Market in RoW
12.5.3 Africa
12.5.3.1 Water and Wastewater Treatment Opportunities and Rapid Growth of Mining and Oil and Gas Industries
13 Competitive Landscape (Page No. - 127)
13.1 Overview
13.2 Ranking Analysis: Market, 2016
13.3 Competitive Situation and Trends
13.3.1 Product Launches and Developments
13.3.2 Acquisition and Agreements
13.3.3 Contracts and Expansions
14 Company Profiles (Page No. - 133)
(Overview, Products Offered, Product Offering Scorecard, Business Strategy Scorecard, Recent Developments, Key Relationships)*
14.1 General Electric
14.2 Shimadzu
14.3 Hach
14.4 Mettler-Toledo
14.5 Lar Process Analysers
14.6 Endress+Hauser
14.7 Teledyne Tekemar
14.8 Xylem
14.9 Eltra
14.10 Metrohm
14.11 Key Innovators
14.11.1 Elementar Analysensysteme GmbH
14.11.2 Skalar
14.11.3 UIC Inc.
14.11.4 Comet Analytics, Inc.
14.11.5 TOC Systems Inc.
*Details on Overview, Products Offered, Product Offering Scorecard, Business Strategy Scorecard, Recent Developments, Key Relationships Might Not Be Captured in Case of Unlisted Companies.
15 Appendix (Page No. - 161)
15.1 Insights of Industry Experts
15.2 Discussion Guide
15.3 Knowledge Store: Marketsandmarkets’ Subscription Portal
15.4 Introducing RT: Real-Time Market Intelligence
15.5 Available Customizations
15.6 Related Reports
15.7 Author Details
List of Tables (64 Tables)
Table 1 Market Size in Terms of Value and Volume, 2014–2023
Table 2 Market, By Offering, 2014–2023 (USD Million)
Table 3 Market, By Type, 2014–2023 (USD Million)
Table 4 Online TOC Analyzer Market, By Application, 2014–2023 (USD Million)
Table 5 Online TOC Analyzer Market, By Industry, 2014–2023 (USD Million)
Table 6 Online TOC Analyzer Market, By Region, 2014–2023 (USD Million)
Table 7 Laboratory TOC Analyzer Market, By Application, 2014–2023 (USD Million)
Table 8 Laboratory TOC Analyzer Market, By Industry, 2014–2023 (USD Million)
Table 9 Laboratory TOC Analyzer Market, By Region, 2014–2023 (USD Million)
Table 10 Market, By Technology, 2014–2023 (USD Million)
Table 11 Market for Ultraviolet Oxidation Technology, By Application, 2014–2023 (USD Million)
Table 12 Market for UV Persulfate Oxidation Technology, By Application, 2014–2023 (USD Million)
Table 13 Market for High-Temperature Combustion Technology, By Application, 2014–2023 (USD Million)
Table 14 Market for Other Technologies, By Application, 2014–2023 (USD Million)
Table 15 Market, By Application, 2014–2023 (USD Million)
Table 16 Market for High Purity Water Application, By Type, 2014–2023 (USD Million)
Table 17 Market for High Purity Water Application, By Technology, 2014–2023 (USD Million)
Table 18 Market for Water for Injection Application, By Type, 2014–2023 (USD Million)
Table 19 Market for Water for Injection Application, By Technology, 2014–2023 (USD Million)
Table 20 Market for Source Water Application, By Type, 2014–2023 (USD Million)
Table 21 Market for Source Water Application, By Technology, 2014–2023 (USD Million)
Table 22 Market for Industrial Process Water Application, By Type, 2014–2023 (USD Million)
Table 23 Market for Industrial Process Water Application, By Technology, 2014–2023 (USD Million)
Table 24 Market for Wastewater Treatment Application, By Type, 2014–2023 (USD Million)
Table 25 Market for Wastewater Treatment Application, By Technology, 2014–2023 (USD Million)
Table 26 Market for Surface Water Application, By Type, 2014–2023 (USD Million)
Table 27 Market for Surface Water Application, By Technology, 2014–2023 (USD Million)
Table 28 Market, By Industry, 2014–2023 (USD Million)
Table 29 Market for Pharmaceuticals Industry, By Type, 2014–2023 (USD Million)
Table 30 Market for Pharmaceuticals Industry, By Region, 2014–2023 (USD Million)
Table 31 Market for Pharmaceuticals Industry in North America, By Country, 2014–2023 (USD Million)
Table 32 Market for Environmental Industry, By Type, 2014–2023 (USD Million)
Table 33 Market for Environmental Industry, By Region, 2014–2023 (USD Million)
Table 34 Market for Environmental Industry in North America, By Country, 2014–2023 (USD Million)
Table 35 Market for Energy and Power Industry, By Type, 2014–2023 (USD Million)
Table 36 Market for Energy and Power Industry, By Region, 2014–2023 (USD Million)
Table 37 Market for Semiconductor Industry, By Type, 2014–2023 (USD Million)
Table 38 Market for Semiconductor Industry, By Region, 2014–2023 (USD Million)
Table 39 Market for Oil and Gas Industry, By Type, 2014–2023 (USD Million)
Table 40 Market for Oil and Gas Industry, By Region, 2014–2023 (USD Million)
Table 41 Market for Chemicals Industry, By Type, 2014–2023 (USD Million)
Table 42 Market for Chemicals Industry, By Region, 2014–2023 (USD Million)
Table 43 Market for Food and Beverages Industry, By Type, 2014–2023 (USD Million)
Table 44 Market for Food and Beverages, By Region, 2014–2023 (USD Million)
Table 45 Market for Food and Beverages Industry in North America, By Country, 2014–2023 (USD Million)
Table 46 Market for Other Industries, By Type, 2014–2023 (USD Million)
Table 47 Market for Other Industries, By Region, 2014–2023 (USD Million)
Table 48 Market, By Region, 2014–2023 (USD Million)
Table 49 Market in North America, By Country, 2014–2023 (USD Million)
Table 50 Market in North America, By Type, 2014–2023 (USD Million)
Table 51 Market in North America, By Industry, 2014–2023 (USD Million)
Table 52 Market in Europe, By Country, 2014–2023 (USD Million)
Table 53 Market in Europe, By Type, 2014–2023 (USD Million)
Table 54 Market in Europe, By Industry, 2014–2023 (USD Million)
Table 55 Market in APAC, By Country, 2014–2023 (USD Million)
Table 56 Market in APAC, By Type, 2014–2023 (USD Million)
Table 57 Market in APAC, By Industry, 2014–2023 (USD Million)
Table 58 Market in RoW, By Region, 2014–2023 (USD Million)
Table 59 Market in RoW, By Type, 2014–2023 (USD Million)
Table 60 Market in RoW, By Industry, 2014–2023 (USD Million)
Table 61 Market: Ranking Analysis (2016)
Table 62 Most Significant Product Launches and Developments in the Market
Table 63 Most Significant Acquisitions and Agreements in the Market
Table 64 Most Significant Contracts and Expansions in the Market
List of Figures (62 Figures)
Figure 1 Markets Covered
Figure 2 Market: Research Design
Figure 3 Market: Bottom-Up Approach
Figure 4 Market: Top-Down Approach
Figure 5 Market Breakdown & Data Triangulation
Figure 6 Snapshot of Market (2017 vs 2023): Hardware to Hold the Largest Market Size in 2017
Figure 7 Laboratory TOC Analyzers to Hold A Larger Market Size By 2023
Figure 8 Market for High Purity Water Application to Grow at the Highest CAGR During the Forecast Period
Figure 9 Market for Pharmaceuticals Industry to Grow at Highest CAGR During the Forecast Period
Figure 10 Europe to Hold the Largest Share of the market in 2017
Figure 11 Attractive Growth Opportunities in the market
Figure 12 Market for Software to Grow at the Highest CAGR During the Forecast Period
Figure 13 Europe Expected to Hold the Largest Share of Market in 2017
Figure 14 Online TOC Analyzer Market to Grow at A Higher CAGR During the Forecast Period (2017–2023)
Figure 15 US to Hold the Largest Share of the TOC Analyzer Market in 2017
Figure 16 Rising Demand for Water and Wastewater Treatments to Drive the Market Growth
Figure 17 Market: A Major Value Added By Manufacturers and Component Providers
Figure 18 Market, By Offering
Figure 19 Market for Software to Grow at Highest CAGR Between 2017 and 2023
Figure 20 Market, By Type
Figure 21 Market for Online TOC Analyzers to Grow at Higher CAGR Between 2017 and 2023
Figure 22 Environmental to Hold the Largest Size of the Online market Between 2017 and 2023
Figure 23 Laboratory TOC Analyzer Market for Pharmaceuticals Industry to Grow at the Highest CAGR Between 2017 and 2023
Figure 24 Market, By Technology
Figure 25 Market for UV Oxidation Technology to Grow at the Highest CAGR Between 2017 and 2023
Figure 26 High Purity Water Application to Lead the Market for TOC Analyzers With UV Persulfate Oxidation Technology Between 2017 and 2023
Figure 27 Wastewater Treatment Application to Dominate the High-Temperature Combustion TOC Analyzer Market By 2023
Figure 28 Market, By Application
Figure 29 Market for High Purity Water Application to Grow at the Highest CAGR Between 2017 and 2023
Figure 30 UV Oxidation Technology to Dominate the Market for High Purity Water Application Between 2017 and 2023
Figure 31 Market for Online TOC Analyzers for Water for Injection Application to Grow at A Higher CAGR Between 2017 and 2023
Figure 32 High-Temperature Combustion Technology to Hold the Largest Size of the market for Source Water Application By 2023
Figure 33 Laboratory Analyzers to Hold A Larger Market Size for Industrial Process Water Application By 2023
Figure 34 High-Temperature Combustion Technology to Hold the Largest Size of the market for Wastewater Treatment Application By 2023
Figure 35 Laboratory Analyzers to Hold A Larger Market Size for Surface Water Application By 2023
Figure 36 Market, By Industry
Figure 37 Market for Pharmaceuticals Industry Expected to Grow at the Highest CAGR Between 2017 and 2023
Figure 38 Laboratory Analyzers to Hold A Larger Market Size for Pharmaceuticals Industry During the Forecast Period
Figure 39 Market in APAC for Environmental Industry to Grow at the Highest CAGR Between 2017 and 2023
Figure 40 Laboratory Analyzers to Dominate the Market for Energy and Power Industry During the Forecast Period
Figure 41 APAC to Lead the market for Semiconductor Industry During 2017–2023
Figure 42 Market for Online TOC Analyzers for Oil and Gas Industry to Grow at A Higher CAGR Between 2017 and 2023
Figure 43 North America to Hold the Largest Size of the Market for Chemicals Industry in 2017
Figure 44 Online TOC Analyzer Market for Food and Beverages Industry to Grow at A Higher CAGR Between 2017 and 2023
Figure 45 Market in APAC for Other Industries to Growth at the Highest CAGR During the Forecast Period
Figure 46 Geographic Snapshot: Chinese and Indian Markets Expected to Grow at A Significant CAGR During Forecast Period
Figure 47 Europe Held the Largest Share of the Market in 2016
Figure 48 North America: Market Snapshot
Figure 49 Market in Canada to Grow at Highest CAGR Between 2017 and 2023
Figure 50 Europe: TOC Analyzer Market Snapshot
Figure 51 Market in France to Grow at the Highest CAGR Between 2017 and 2023
Figure 52 Asia Pacific: Market Snapshot
Figure 53 China Expected to Hold the Largest Size of Market in APAC Between 2017 and 2023
Figure 54 Market in South America to Grow at the Highest CAGR Between 2017 and 2023
Figure 55 Companies Adopted Product Launches and Developments as Key Growth Strategies Between 2014 and August 2017
Figure 56 Market Evaluation Framework
Figure 57 Product Launches and Developments as Key Strategies
Figure 58 General Electric: Company Snapshot
Figure 59 Shimadzu: Company Snapshot
Figure 60 Mettler-Toledo: Company Snapshot
Figure 61 Endress+Hauser: Company Snapshot
Figure 62 Xylem: Company Snapshot
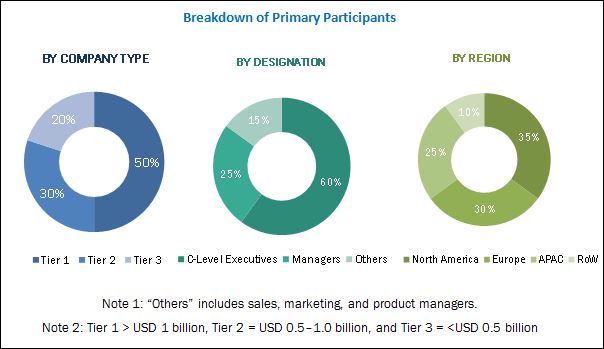
The research methodology used to estimate and forecast the TOC analyzer market begins with obtaining data on key vendor revenues through secondary research. Some of the secondary sources used in this research include information from various journals and databases such as IEEE journals, pharmacopeias, and environmental journals, Factiva, Hoovers, and OneSource. Moreover, the vendor offerings have been taken into consideration to determine the market segmentation. The bottom-up procedure has been employed to arrive at the overall size of the market from the revenue of the key players in the market. After arriving at the overall market size, the total market has been split into several segments and subsegments, which have been verified through primary research by conducting extensive interviews with the officials holding key positions in the industry such as CEOs, VPs, directors, and executives. The market breakdown and data triangulation procedures have been employed to complete the overall market engineering process and arrive at the exact statistics for all segments and subsegments. The breakdown of the profiles of primaries has been depicted in the following figure:
To know about the assumptions considered for the study, download the pdf brochure
The TOC analyzer ecosystem comprises the vendors such as General Electric Company (US), Shimadzu Corporation (Japan), Mettler-Toledo International Inc. (Canada), Hach Company (US), LAR Process Analysers AG. (Germany), Teledyne Tekemar Company Inc. (US), Xylem, Inc. (US), Endress+Hauser Management AG (Germany), ELTRA GmbH (Germany), Metrohm AG (Switzerland), Elementar Analysensysteme GmbH (Germany), and Skalar Analytical B.V. (Netherlands) selling these products and solutions to end users according to their unique requirements. The end users industries such as pharmaceuticals, environmental, energy and power, semiconductor, oil and gas, chemicals, food and beverages, and others.
Target Audience:
- TOC analyzer manufacturers
- Original equipment manufacturers (OEMs)
- Research organizations and consulting companies
- TOC analyzer-related associations, organizations, forums, and alliances
- Distributors and traders
- Government bodies such as regulating authorities and policymakers
- Venture capitalists, private equity firms, and startup companies
“The study answers several questions for the target audience, primarily which market segments to focus on in the next 2 to 5 years for prioritizing their efforts and investments.”
Report Scope:
In this report, the market has been segmented into the following categories:
TOC Analyzer Market, by Offering:
- Hardware
- Software
- Services
TOC Analyzer Market, by Type:
- Online
- Laboratory
TOC Analyzer Market, by Technology:
- Ultraviolet (UV) Oxidation
- UV Persulfate Oxidation
- High-Temperature Combustion
- Others
TOC Analyzer Market, by Application:
- High Purity Water
- Water for Injection
- Source Water
- Industrial Process Water
- Wastewater Treatment
- Surface Water
TOC Analyzer Market, by Industry:
- Pharmaceuticals
- Environmental
- Energy and Power
- Semiconductor
- Oil and Gas
- Chemicals
- Food and Beverages
- Others (agriculture, pulp and paper, cement, and metals and mining)
TOC Analyzer Market, by Geography:
- North America (US, Canada, and Mexico)
- Europe (UK, Germany, France, and Rest of Europe)
- Asia Pacific (China, Japan, India, and Rest of APAC)
- Rest of the World (South America, Middle East, and Africa)
Available Customizations:
With the given market data, MarketsandMarkets offers customizations according to the specific requirements of the company. The following customization options are available for the report:
Company Information
Detailed analysis and profiling of additional market players (up to 5)


Growth opportunities and latent adjacency in TOC Analyzer Market