Vacuum Grease Market by Type (Fluorocarbon-based Vacuum Grease, Hydrocarbon-based Vacuum Grease, Silicone-based Vacuum Grease), by Application (Laboratory Equipment, Food Processing, Pharmaceuticals, Aerospace/Aviation, Others), by Region - Global Forecast to 2020


The global vacuum grease market was valued at USD 117.82 Million in 2014, and is projected to reach USD 229.68 Million by 2020, at a CAGR of 11.32% between 2015 and 2020.
The global vacuum grease market has been categorized on the basis of type, application, and region. In terms of value, the fluorocarbon-based vacuum grease segment led the global vacuum grease market in 2014. The vacuum grease market is categorized on the basis of application into laboratory & industrial equipment, food processing, pharmaceuticals, aerospace/aviation, and others. Innovations in pharmaceuticals, academic, industrial, and healthcare industries have increased the demand of vacuum grease in the laboratory & industrial equipment application. The vacuum grease market in the Asia-Pacific region is projected to grow at the highest CAGR during the forecast period, owing to the rising demand of laboratory & industrial equipment and food processing industry. The report on the vacuum grease market considered 2014 as the base year, and the forecast period from 2015 to 2020.
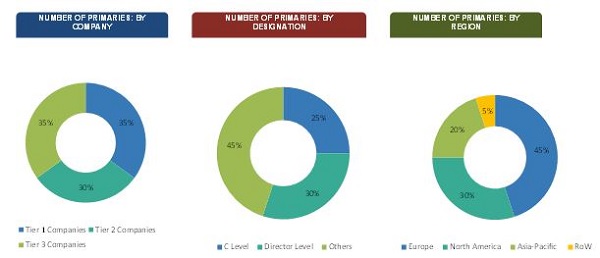
The research methodology used to estimate and forecast the global vacuum grease market begins with capturing data on key vendor revenues through secondary research. The vendor offerings are also taken into consideration to determine the market segmentation. The bottom-up procedure was employed to arrive at the overall market size of the global vacuum grease market. After arriving at the overall market size, the total market was split into several segments and subsegments, which were later verified through primary research by conducting extensive interviews with key personnel, such as CEOs, VPs, directors, and executives. This data triangulation and market breakdown procedures were employed to complete the overall market engineering process and arrive at the exact statistics for all segments and subsegments of the market. The breakdown of profiles of primaries is depicted in the figure below.
To know about the assumptions considered for the study, download the pdf brochure
The vacuum grease market has a diversified ecosystem of upstream players, including raw material suppliers, along with downstream stakeholders, vendors, end users, and government organizations. Key players in this market include The Chemours Company (DuPont) (U.S.), Dow Corning (U.S.), M&I Materials Ltd. (U.K.), Solvay S.A. (Belgium), Castrol Ltd. (U.K.), Ulvac Technologies Inc. (U.S.), Inland Vacuum Industries Inc. (U.S.), Kluber Lubrication (Germany), Fuchs Lubritech GmbH (Germany), Santolubes LLC (U.S.), Supervac Industries (India), and MPT Industries (U.S.)., among others. The government and research organizations, raw material suppliers and distributors, construction companies, and industry associations are considered as critical stakeholders in this study.
Target Audience
- Vacuum grease Producers
- Vacuum grease Traders, Distributors, and Suppliers
- Manufacturers in End-Use Industries
- Associations and Industry Bodies
Scope of the Report: This research report categorizes the global vacuum grease market on the basis of type, application, and region; forecasting volumes and revenues as well as analyzing trends in each of these submarkets.
On the basis of Type, the vacuum grease market is segmented into:
- Fluorocarbon-based vacuum grease
- Hydrocarbon-based vacuum grease
- Silicone-based vacuum grease
On the basis of Application, the vacuum grease market is segmented into:
- Laboratory & Industrial Equipment
- Food Processing
- Pharmaceuticals
- Aerospace/Aviation
- Others
On the basis of Region: The geographic analysis of the global vacuum grease market include regions, such as
- Europe
- North America
- Asia-Pacific
- RoW
The following customization options are available for the report:
- Further breakdown of Asia-Pacific & European vacuum grease markets
- Company information
- Detailed analysis and profiling of additional market players (Up to 3)
The global vacuum grease market was valued at USD 117.82 Million in 2014 and is projected to reach USD 229.68 Million by 2020, at a CAGR of 11.32% from 2015 to 2020. This growth is mainly attributed to the strong laboratory equipment industry in Europe and North America, growth in the food processing industry in China and India and the growth in the global commercial aerospace market.
Among all applications, the laboratory & industrial equipment vacuum grease segment is the fastest-growing application segment in the vacuum grease market. Vacuum grease is a lubricant which has low volatility. It is resistant to alcohols, esters, alkalis, and water. As a sealant, it is used in the joints in vacuum systems. It also helps provide protection from corrosion and fusing, leading to lower wear for components and equipment thus prolonging their life. It is also added to valves, bearings, and O-rings for their smooth functioning. Vacuum grease provides lubrication to laboratory & industrial equipment, binoculars, and telescopes. It has applications in both high-pressure and low-pressure situations and is compatible with metals, plastics, and rubbers.
A wide range of vacuum grease are available in the market. Fluorocarbon-based vacuum grease is the major type of vacuum grease. It is used as a sealant in vacuum systems, and as a lubricant in high-temperature bearings, valves, and O-rings. Hydrocarbon-based vacuum grease is the second-largest type of vacuum grease. It is used on O-rings in rotating pump shafts, hydraulic cylinder pistons, and other systems that need vacuum conditions to operate.
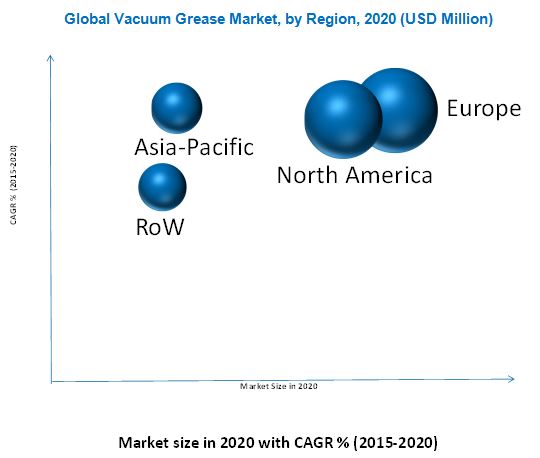
Europe held the largest share in the global vacuum grease market in 2014. The growth in this region mainly attributed high demand for laboratory & industrial equipment in medical care, hospitals, educational institutions, and industries. Aging population and demand for clinical research are the major drivers for laboratory & industrial equipment application in Europe.
Factors inhibiting the growth of the global vacuum grease market include lack of developments by major players and the limited applications of vacuum grease. The Chemours Company (DuPont) (U.S.), Dow Corning (U.S.), M&I Materials Ltd. (U.K.), Solvay S.A. (Belgium), Castrol Ltd. (U.K.), Ulvac Technologies Inc. (U.S.), Inland Vacuum Industries Inc. (U.S.), Kluber Lubrication (Germany), Fuchs Lubritech GmbH (Germany), Santolubes LLC (U.S.), Supervac Industries (India), and MPT Industries (U.S.). are key players operating in the vacuum grease market. M&I Materials Ltd. (U.K.) is engaged in the production of new products in the field of vacuum grease market.
To speak to our analyst for a discussion on the above findings, click Speak to Analyst
 Exclusive indicates content/data unique to MarketsandMarkets and not available with any competitors.
Table of Contents
1 Introduction (Page No. - 13)
1.1 Objectives of the Study
1.2 Market Definition
1.3 Market Scope
1.3.1 Markets Covered
1.3.2 Years Considered
1.4 Currency
1.5 Packaging & Sizing
1.6 Stakeholders
2 Research Methodology (Page No. - 16)
2.1 Research Data
2.2 Market Size Estimation
2.2.1 Market Size
2.2.2 List of Secondary Sources
2.3 Market Breakdown and Data Triangulation
2.4 Market Share Estimation
2.4.1 Key Data From Secondary Sources
2.4.2 Key Data From Primary Sources
2.4.2.1 Key Industry Insights
2.4.3 Assumptions
3 Executive Summary (Page No. - 25)
4 Premium Insights (Page No. - 29)
4.1 Attractive Market Opportunities in the Vacuum Grease Market
4.2 Market: Regional Segments
4.3 Market, By Application
4.4 Market: Developing vs Developed Nations
4.5 Fastest-Growing Markets, By Type
4.6 Life Cycle Analysis, By Region
5 Market Overview (Page No. - 34)
5.1 Introduction
5.2 Evolution
5.3 Market Segmentation
5.3.1 By Type
5.3.2 By Application
5.3.2.1 Laboratory Equipment
5.3.2.2 Food Processing
5.3.2.3 Pharmaceuticals
5.3.2.4 Aerospace/Aviation
5.3.2.5 Others
5.3.3 By Region
5.4 Market Dynamics
5.4.1 Drivers
5.4.1.1 Strong Laboratory Equipment Industry in Europe and North America
5.4.1.2 Growth in Food Processing Industry in India and China
5.4.2 Restraints
5.4.2.1 Limited Applications of Vacuum Grease
5.4.2.2 Low Volume Usage By the End-Use Industries
5.4.3 Opportunities
5.4.3.1 Growth of Laboratory Equipment Market in Asia-Pacific
5.4.3.2 Rise in the Global Commercial Aerospace Market
5.4.4 Challenges
5.4.4.1 Lack of Development By Major Players
5.5 Winning Imperative
5.5.1 Focus on Future Needs of Vacuum Technology
6 Industry Trends (Page No. - 43)
6.1 Introduction
6.2 Porter�s Five Forces Analysis
6.2.1 Bargaining Power of Suppliers
6.2.2 Threat of New Entrants
6.2.3 Threat of Substitutes
6.2.4 Bargaining Power of Buyers
6.2.5 Intensity of Rivalry
7 Vacuum Grease Market, By Type (Page No. - 49)
7.1 Introduction
7.2 Fluorocarbon-Based Vacuum Grease
7.3 Hydrocarbon-Based Vacuum Grease
7.4 Silicone-Based Vacuum Grease
8 Vacuum Grease Market, By Application (Page No. - 55)
8.1 Introduction
8.2 Market Size & Projection
8.3 Laboratory & Industrial Equipment
8.4 Food Processing
8.5 Pharmaceuticals
8.6 Aerospace/Aviation
8.7 Others
9 Vacuum Grease Market, By Region (Page No. - 69)
9.1 Introduction
9.2 Europe
9.2.1 U.K.
9.2.2 France
9.2.3 Germany
9.2.4 Italy
9.2.5 Rest of Europe
9.3 North America
9.3.1 U.S.
9.3.2 Canada
9.3.3 Mexico
9.4 Asia-Pacific
9.4.1 China
9.4.2 Japan
9.4.3 India
9.4.4 Rest of Asia-Pacific
9.5 Rest of the World
9.5.1 Brazil
9.5.2 Argentina
9.5.3 Egypt
9.5.4 Others-RoW
10 Competitive Landscape (Page No. - 117)
10.1 Overview
10.2 Expansion and New Product Launch: the Most Popular Growth Strategies
10.3 Equal Number of Developments Made in Europe and North America, 2011�2015
10.4 Developments Recorded in 2012 and 2015
10.5 M&I Materials and the Chemours Company Were the Most Active Players Between 2011 & 2015
10.6 Competitive Situation & Trends
10.7 Expansion
10.8 New Product Launch
11 Company Profiles (Page No. - 123)
(Company at A Glance, Recent Financials, Products & Services, Strategies & Insights, & Recent Developments)*
11.1 Introduction
11.2 DOW Corning
11.3 The Chemours Company
11.4 M&I Materials Limited
11.5 Solvay S.A.
11.6 Castrol Ltd.
11.7 Kluber Lubrication
11.8 Fuchs Lubritech Gmbh
11.9 Inland Vacuum Industries Inc.
11.10 Ulvac Technologies Inc.
11.11 Santolubes LLC
11.12 Supervac Industries
11.13 Mpt Industries
*Details on Company at A Glance, Recent Financials, Products & Services, Strategies & Insights, & Recent Developments Might Not Be Captured in Case of Unlisted Companies.
12 Appendix (Page No. - 146)
12.1 Discussion Guide
12.2 Introducing RT: Real Time Market Intelligence
12.3 Related Reports
12.4 Available Customizations
List of Tables (112 Tables)
Table 1 Market Size, 2013-2020
Table 2 Market, By Type, 2013-2020 (KT)
Table 3 Market Size, By Type, 2013-2020 (USD MN)
Table 4 Fluorocarbon-Based Vacuum Grease Consumption (KT) and Value (USD MN), 2013-2020
Table 5 Hydrocarbon-Based Vacuum Grease Consumption (KT) and Value (USD MN), 2013-2020
Table 6 Silicone-Based Vacuum Grease Consumption (KT) and Value (USD MN), 2013-2020
Table 7 Market Size, By Application, 2013-2020 (USD MN)
Table 8 Laboratory & Industrial Equipment Market Size (Volume & Value), 2013-2020
Table 9 Laboratory & Industrial Equipment Market Size, By Region, 2013-2020 (KT)
Table 10 Laboratory & Industrial Equipment Market Size, By Region, 2013-2020 (USD MN)
Table 11 Food Processing Market Size (Volume & Value), 2013-2020
Table 12 Food Processing Market Size, By Region, 2013-2020 (KT)
Table 13 Food Processing Market Size, By Geography, 2013-2020 (USD MN)
Table 14 Pharmaceuticals Market Size (Volume & Value), 2013-2020
Table 15 Pharmaceuticals Market Size, By Geography, 2013-2020 (KT)
Table 16 Pharmaceuticals Market Size, By Geography, 2013-2020 (USD MN)
Table 17 Aerospace/Aviation Market Size (Volume & Value), 2013-2020
Table 18 Aerospace/Aviation Market Size, By Region, 2013-2020 (KT)
Table 19 Aerospace/Aviation Market Size, By Region, 2013-2020 (USD MN)
Table 20 Others Market Size (Volume & Value), 2013-2020
Table 21 Others Market Size, By Region, 2013-2020 (KT)
Table 22 Others Market Size, By Region, 2013-2020 (USD MN)
Table 23 By Market Size, By Region, 2013-2020 (KT)
Table 24 By Market Size, By Region, 2013-2020 (USD MN)
Table 25 Europe: Market Size, By Country, 2013�2020 (KT)
Table 26 Europe: Market Size, By Country, 2013�2020 (USD MN)
Table 27 Europe: Market Size, By Type, 2013-2020 (KT)
Table 28 Europe: Market Size, By Type, 2013-2020 (USD MN)
Table 29 Europe: Market Size, By Application, 2013�2020 (KT)
Table 30 Europe: Market Size, By Application, 2013�2020 (USD MN)
Table 31 U.K.: By Market Size, By Type, 2013�2020 (KT)
Table 32 U.K.: By Market Size, By Type, 2013�2020 (USD MN)
Table 33 U.K.: By Market Size, By Application, 2013�2020 (KT)
Table 34 U.K.: By Market Size, By Application, 2013�2020 (USD MN)
Table 35 France: By Market Size, By Type, 2013�2020 (KT)
Table 36 France: By Market Size, By Application, 2013�2020 (KT)
Table 37 France: By Market Size, By Application, 2013�2020 (USD MN)
Table 38 Germany: By Market Size, By Type, 2013�2020 (KT)
Table 39 Germany: By Market Size, By Type, 2013�2020 (USD MN)
Table 40 Germany: By Market Size, By Application, 2013�2020 (KT)
Table 41 Germany: By Market Size, By Application, 2013�2020 (USD MN)
Table 42 Italy: Market Size, By Type, 2013�2020 (KT)
Table 43 Italy: Market Size, By Type, 2013�2020 (USD MN)
Table 44 Italy: Market Size, By Application, 2013�2020 (KT)
Table 45 Italy: Market Size, By Application, 2013�2020 (USD MN)
Table 46 Rest of Europe: By Market Size, By Type, 2013�2020 (KT)
Table 47 Rest of Europe: By Market Size, By Type, 2013�2020 (USD MN)
Table 48 Rest of Europe: By Market Size, By Application, 2013�2020 (KT)
Table 49 Rest of Europe: By Market Size, By Application, 2013�2020 (USD MN)
Table 50 North America: By Market Size, By Region, 2013�2020 (KT)
Table 51 North America: By Market Size, By Region, 2013�2020 (USD MN)
Table 52 North America: By Market Size, By Type, 2013-2020 (KT)
Table 53 North America: By Market Size, By Type, 2013-2020 (USD MN)
Table 54 North America: By Market Size, By Application, 2013�2020 (KT)
Table 55 North America: By Market Size, By Application, 2013�2020 (USD MN)
Table 56 U.S.: Market Size, By Type, 2013�2020 (KT)
Table 57 U.S.: Market Size, By Type, 2013�2020 (USD MN)
Table 58 U.S.: Market Size, By Application, 2013�2020 (KT)
Table 59 U.S.: Market Size, By Application, 2013�2020 (USD MN)
Table 60 Canada: By Market Size, By Type, 2013�2020 (KT)
Table 61 Canada: By Market Size, By Type, 2013�2020 (USD MN)
Table 62 Canada: By Market Size, By Application, 2013�2020 (KT)
Table 63 Canada: By Market Size, By Application, 2013�2020 (USD MN)
Table 64 Mexico: By Market Size, By Type, 2013�2020 (KT)
Table 65 Mexico: By Market Size, By Type, 2013�2020 (USD MN)
Table 66 Mexico: By Market Size, By Application, 2013�2020 (KT)
Table 67 Mexico: By Market Size, By Application, 2013�2020 (USD MN)
Table 68 Asia-Pacific: By Market Size, By Region, 2013�2020 (KT)
Table 69 Asia-Pacific: By Market Size, By Region, 2013�2020 (USD MN)
Table 70 Asia-Pacific: By Market Size, By Type, 2013-2020 (KT)
Table 71 Asia-Pacific: By Market Size, By Type, 2013-2020 (USD MN)
Table 72 Asia-Pacific: By Market Size, By Application, 2013�2020 (KT)
Table 73 Asia-Pacific: By Market Size, By Application, 2013�2020 (USD MN)
Table 74 China: By Market Size, By Type, 2013�2020 (KT)
Table 75 China: By Market Size, By Type, 2013�2020 (USD MN)
Table 76 China: By Market Size, By Application, 2013�2020 (KT)
Table 77 China: By Market Size, By Application, 2013�2020 (USD MN)
Table 78 Japan: By Market Size, By Type, 2013�2020 (KT)
Table 79 Japan: By Market Size, By Type, 2013�2020 (USD MN)
Table 80 Japan: By Market Size, By Application, 2013�2020 (KT)
Table 81 Japan: By Market Size, By Application, 2013�2020 (USD MN)
Table 82 India: Market Size, By Type, 2013�2020 (KT)
Table 83 India: Market Size, By Type, 2013�2020 (USD MN)
Table 84 India: Market Size, By Application, 2013�2020 (KT)
Table 85 India: Market Size, By Application, 2013�2020 (USD MN)
Table 86 Rest of Asia-Pacific: By Market Size, By Type, 2013�2020 (KT)
Table 87 Rest of Asia-Pacific: By Market Size, By Type, 2013�2020 (USD MN)
Table 88 Rest of Asia-Pacific: By Market Size, By Application, 2013�2020 (KT)
Table 89 Rest of Asia-Pacific: By Market Size, By Application, 2013�2020 (USD MN)
Table 90 RoW: By Market Size, By Country, 2013�2020 (KT)
Table 91 RoW: By Market Size, By Country, 2013�2020 (USD MN)
Table 92 RoW: By Market Size, By Type, 2013-2020 (KT)
Table 93 RoW: By Market Size, By Type, 2013-2020 (USD MN)
Table 94 RoW: By Market Size, By Application, 2013�2020 (KT)
Table 95 RoW: By Market Size, By Application, 2013�2020 (USD MN)
Table 96 Brazil: Market Size, By Type, 2013�2020 (KT)
Table 97 Brazil: Market Size, By Type, 2013�2020 (USD MN)
Table 98 Brazil: Market Size, By Application, 2013�2020 (KT)
Table 99 Brazil: Market Size, By Application, 2013�2020 (USD MN)
Table 100 Argentina: By Market Size, By Type, 2013�2020 (KT)
Table 101 Argentina: By Market Size, By Type, 2013�2020 (USD MN)
Table 102 Argentina: By Market Size, By Application, 2013�2020 (KT)
Table 103 Argentina: By Market Size, By Application, 2013�2020 (USD MN)
Table 104 Egypt: Market Size, By Type, 2013�2020 (KT)
Table 105 Egypt: Market Size, By Type, 2013�2020 (USD MN)
Table 106 Egypt: Market Size, By Application, 2013�2020 (USD MN)
Table 107 Others-RoW: By Market Size, By Type, 2013�2020 (KT)
Table 108 Others-RoW: By Market Size, By Type, 2013�2020 (USD MN)
Table 109 Others-RoW: By Market Size, By Application, 2013�2020 (KT)
Table 110 Others-RoW: By Market Size, By Application, 2013�2020 (USD MN)
Table 111 Expansion, 2013�2014
Table 112 New Product Launch, 2012�2015
List of Figures (53 Figures)
Figure 1 Market Segmentation
Figure 2 Market: Research Design
Figure 3 Market Size Estimation Methodology: Bottom-Up Approach
Figure 4 Market Size Estimation Methodology: Top-Down Approach
Figure 5 Breakdown of Primary Interviews: By Company Type, Designation, and Region
Figure 6 Laboratory Equipment Application Segment is Expected to Drive the Global Vacuum Grease Market
Figure 7 Asia-Pacific to Witness Fastest Growth
Figure 8 Europe is the Largest and the Fastest-Growing Vacuum Grease Market in 2015
Figure 9 Vacuum Grease Market Size, By Value
Figure 10 Asia-Pacific to Grow at the Highest CAGR Between 2015 and 2020
Figure 11 Laboratory Equipment Segment Held the Largest Share of the Vacuum Grease Market
Figure 12 The U.S. to Remain the Largest Market Till 2020
Figure 13 Vacuum Grease Market has High Growth Potential in Developed Economies
Figure 14 High Growth Potential in North America for Vacuum Grease Market
Figure 15 Vacuum Grease Market, By Type : 2014
Figure 16 Vacuum Grease Market, By Application
Figure 17 Vacuum Grease Market, By Region
Figure 18 Drivers, Restraints, Opportunities, and Challenges in the Global Vacuum Grease Market
Figure 19 Supply Chain Analysis
Figure 20 Porter�s Five Forces Analysis
Figure 21 Fluorocarbon-Based Vacuum Grease Segment is Expected to Dominate the Vacuum Grease Market During the Forecast Period
Figure 22 Europe to Remain the Market Leader in Fluorocarbon -Based Vacuum Grease in 2020
Figure 23 Europe to Remain the Market Leader in Hydrocarbon-Based Vacuum Grease in 2020
Figure 24 Europe to Remain the Market Leader in Silicone-Based Vacuum Grease Segment Till 2020
Figure 25 Laboratory & Industrial Equipment Segment to Register the Highest Demand During the Forecast Period
Figure 26 Asia-Pacific to Grow at the Highest Rate in the Vacuum Grease Market in Laboratory & Industrial Equipment
Figure 27 North America is Expected to Drive the Vacuum Grease Market in Food Processing Industry
Figure 28 North America is Expected to Drive the Vacuum Grease Market in Pharmaceuticals During the Forecast Period
Figure 29 North America to Remain the Market Leader in the Vacuum Grease Market in Aerospace/Aviation Industry
Figure 30 Others Segment to Grow at the Highest Rate in the European Vacuum Grease Market
Figure 31 Regional Snapshot (2015�2020)�Germany and Italy are the Fastest-Growing Markets
Figure 32 U.K. and Canada Market Holds Highest Growth Potential
Figure 33 Europe Market Snapshot, 2014: the Region has Higher Usage of Fluorocarbon-Based Vacuum Grease Type
Figure 34 North America Market Snapshot, 2014 : the U.S. to Continue to Dominate the Market
Figure 35 Asia-Pacific Market Snapshot, 2014: China and India are the Biggest Players in the Region
Figure 36 RoW Market Snapshot: Brazil is the Most Lucrative Market
Figure 37 Companies Adopted Organic Growth Strategies
Figure 38 Expansion and New Product Launch Made Europe and North America the Most Active Regions
Figure 39 Vacuum Grease Market Developmental Share, 2011�2015
Figure 40 Growth Strategies Share, By Company, 2011�2015
Figure 41 Geographic Revenue Mix of the Top Five Market Players
Figure 42 DOW Corning: Company Snapshot
Figure 43 DOW Corning: SWOT Analysis
Figure 44 The Chemours Company : Company Snapshot
Figure 45 The Chemours Company: SWOT Analysis
Figure 46 M&I Materials Limited: SWOT Analysis
Figure 47 Solvay S.A.: Company Snapshot
Figure 48 Solvay S.A.: SWOT Analysis
Figure 49 Castrol Ltd.: Company Snapshot
Figure 50 Castrol: SWOT Analysis
Figure 51 Kluber Lubrication: Company Snapshot
Figure 52 Fuchs Lubritech GmbH Company Snapshot
Figure 53 Ulvac Technologies Inc.: Company Snapshot


Growth opportunities and latent adjacency in Vacuum Grease Market