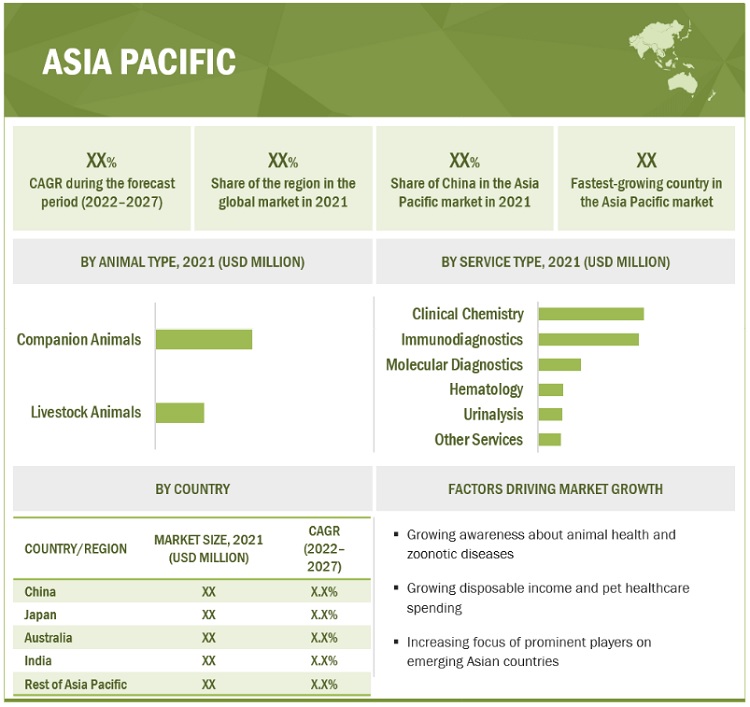
[260 Pages Report] The global veterinary reference laboratory market is projected to reach USD 6.6 billion by 2026 from USD 3.8 billion in 2021, at a CAGR of 11.0% during the forecast period. Factors such as the growth in the companion animal population, rising demand for pet insurance, an increasing number of veterinary practitioners in developed economies, increasing demand for animal-derived food products, and increasing incidence of transboundary and zoonotic diseases are driving the growth of this market. However, growing pet care costs and the increasing demand for POC testing and portable instruments are restraining the growth of this market to some extent.
To know about the assumptions considered for the study, Request for Free Sample Report
There is no compelling evidence to date that any domestic animal, including cats, dogs, and ferrets, readily transmits SARS-CoV-2 to other animals, including humans, under natural conditions. Further, the global number of naturally infected animals is far less than the number of people with COVID-19, indicating that animals, including pets, are not a driver of the COVID-19 pandemic—the pandemic continues to be driven by human-to-human transmission. Due to an increase in the prevalence of COVID-19 across the globe, testing volumes on humans and animals continue to rise. This has also prompted players and reference laboratories to develop new and improved animal tests. In April 2020, IDEXX Laboratories announced the availability of the IDEXX SARS-CoV-2 (COVID-19) RealPCR Test for pets. Similarly, in April 2020, Zoetis developed and initiated feline- and canine-specific real-time PCR tests for SARS-CoV-2 (COVID-19)-specific RNA.
Routine testing of animals for COVID-19 is not recommended by the AVMA, CDC, USDA, American Association of Veterinary Laboratory Diagnosticians (AAVLD), National Association of State Public Health Veterinarians (NASPHV), or the National Assembly of State Animal Health Officials. Because the situation is ever-evolving, public and animal health officials may decide to test certain animals. The decision to test should be made collaboratively between the attending veterinarian and local, state, and/or federal public health and animal health officials.
At the height of the pandemic, many countries stipulated that only urgent or emergency procedures absolutely necessary for the veterinary healthcare of companion animals could take place. Delays in routine care (e.g., vaccination, parasite prevention, etc.) has led to some serious health and welfare problems, as well as an overflow of work after the restrictions were lifted, which, in turn, has created additional delays in the delivery of these services. The number of vet visits drastically reduced in March, April, and May 2020 but started increasing from the third quarter of 2020 with a high growth rate. It is expected to normalize in the second and third quarters of 2021. Hence, the COVID-19 pandemic is expected to have a temporary and minimal impact on the veterinary reference laboratory market during the forecast period.
Over the years, the population of companion animals, such as dogs and cats, has increased significantly. According to the American Pet Products Association (APPA) National Pet Owners Survey 2019–2020, 67% of US households, or about 85 million families, own a pet. Furthermore, according to the European Pet Food Industry Federation (FEDIAF), in 2020, 38% of households (88 million) in Europe had pets. The canine population in the US increased from 69.9 million in 2017 to 89.7 million in 2019, while the feline population increased from 74.05 million in 2017 to 94.2 million in 2019. According to PETS International, Brazil’s pet population for 2018 included 54.2 million dogs, 39.8 million birds, 23.9 million cats, 19.1 million fish, and around 2.3 million small animals. India reported 20 million dogs and 19 million other domestic pets in the country as of 2019. Approximately 600,000 pets are adopted every year in India (Source: India International Pet Trade Fair). Rising urbanization has contributed to the increasing per capita expenditure on animal health due to the high adoption rate of companion animals in the urban population. This, along with growing awareness of animal health, is driving the growth of the veterinary reference laboratory market.
In the last few years, companion animal ownership has witnessed a steady increase, especially in emerging countries such as India, China, and Brazil. Rapid urbanization and growing disposable incomes are some key factors driving pet ownership in these countries. Moreover, a large number of pet owners in these countries are willing to spend more on pet care, specifically for healthcare services.
Over the last few years, companion animal ownership has witnessed a steady increase, especially in emerging countries such as India, China, Brazil, and other APAC and Latin American countries. Rapid urbanization and growing disposable incomes are driving pet ownership in these countries. Many pet owners in these countries are now willing to spend more on pet care. Moreover, the FAO estimates India to be the world’s largest milk producer, with its contribution amounting to around 21% of the global production. However, frequent outbreaks of FMD, influenza, and black quarter infections continue to hamper the health and productivity of these animals in the region, thus propelling the need for routine laboratory services.
Many players from international markets are focused on investing in emerging economies to expand their global presence and ensure revenue growth. This is expected to drive the demand for veterinary reference laboratory services in the coming years.
Emerging economies such as India, China, Brazil, and some Southeast Asian countries are home to a large companion animal population. However, animal health expenditure in these countries is relatively low as compared to the developed countries across North America and Europe. This is mainly due to a lack of awareness among pet owners and veterinarians about the healthcare services available for animals. The companion animal health expenditure in these countries is focused on therapeutic treatments only; diagnostic technologies are not widely used in these countries, owing to their high cost.
The impact of this challenge is exacerbated by the higher focus of companion animal diagnostic product manufacturers on the developed markets in North America and Europe, as compared to developing markets. This is because markets in developed countries are characterized by a wider acceptance of companion animal diagnostics and higher animal health expenditure. Although some global players in the companion animal diagnostics market have undertaken initiatives to increase awareness, the adoption of solutions in these markets is not expected to grow significantly in the next few years.
Although emerging regions showcase a strong growth potential, the lack of awareness will be a key challenge for the growth of the veterinary reference laboratory market in these regions.
The immunodiagnostic services holds the largest share in Veterinary Reference Laboratory Market by service type, in the forecast period
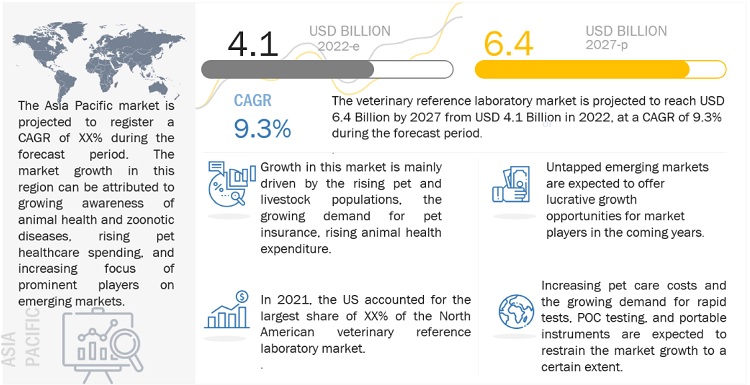
The immunodiagnostic services segment accounted for the largest share of the veterinary reference laboratory market. The large share of this segment can primarily be attributed to the widespread popularity of immunodiagnostics for disease diagnosis, screening of disease progression, and observing patient response to therapy.
The clinical pathology accounted for the largest share of the Veterinary Reference Laboratory Market in 2020. The clinical pathology segment accounted for the largest share of the veterinary reference laboratory market in 2020. The rising volume of pathology tests performed is the major factor driving the demand for diagnostic products and consumables for clinical pathology applications.
The companion animals segment accounted for the largest share of the global Veterinary Reference Laboratory Market. The companion animals accounted for the largest share of the veterinary reference laboratory market. This segment is also projected to register the highest CAGR during the forecast period. The large share and high growth rate of this segment are largely attributed to the growing adoption of companion animals, increasing disposable incomes, growing willingness of companion animal owners to spend more on animal health, and increasing incidence of zoonotic diseases.
North America accounted for the largest share of the global Veterinary Reference Laboratory Market, by region in the forecast period.
North America accounted for the largest share of the veterinary reference laboratory market in 2020. The growth of the North American market can be attributed to the increasing adoption of companion animals, the growing pet insurance industry, rising veterinary healthcare expenditure, and the growing number of veterinary practices. In addition, a majority of players in the veterinary reference laboratory market are based in the US.
To know about the assumptions considered for the study, download the pdf brochure
Key players in the Veterinary Reference Laboratory Market: IDEXX Laboratories, Inc. (US), VCA, Inc. (US), GD Animal Health (Netherlands), Boehringer Ingelheim (Germany), Zoetis Inc. (US), NEOGEN Corporation (US), LABOKLIN GmbH (Germany), SYNLAB International GmbH (Germany), Heska Corporation (US), Virbac (US), Thermo Fisher Scientific, Inc. (US), Texas A&M Veterinary Medical Diagnostic Laboratory (US), University of Minnesota (Veterinary Diagnostic Laboratory) (US), Iowa State University (Veterinary Diagnostic Laboratory) (US), Vetnostics (Australia), ProtaTek International Inc. (US), Animal and Plant Health Agency (UK), Animal Health Diagnostic Center (Cornell University) (US), National Veterinary Services Laboratory USDA-APHIS (US), Washington Animal Disease Diagnostic Laboratory (US), Colorado State University (Veterinary Diagnostic Laboratories) (US), The Pirbright Institute (UK), IDVet (France), Friedrich-Loeffler-Institute (FLI) (Germany), and Kansas State Veterinary Diagnostic Laboratory (US).
Report Metric |
Details |
Market Size available for years |
2019-2026 |
Base Year Considered |
2020 |
Forecast period |
2021-2026 |
Forecast Unit |
Value(USD) |
Segments covered |
Veterinary Reference Laboratory Market: |
Geographies covered |
|
Companies Covered |
IDEXX Laboratories, Inc. (US), VCA, Inc. (US), GD Animal Health (Netherlands), Boehringer Ingelheim (Germany), Zoetis Inc. (US), NEOGEN Corporation (US), LABOKLIN GmbH (Germany), SYNLAB International GmbH (Germany), Heska Corporation (US), Virbac (US), Thermo Fisher Scientific, Inc. (US), Texas A&M Veterinary Medical Diagnostic Laboratory (US), University of Minnesota (Veterinary Diagnostic Laboratory) (US), Iowa State University (Veterinary Diagnostic Laboratory) (US), Vetnostics (Australia), ProtaTek International Inc. (US), Animal and Plant Health Agency (UK), Animal Health Diagnostic Center (Cornell University) (US), National Veterinary Services Laboratory USDA-APHIS (US), Washington Animal Disease Diagnostic Laboratory (US), Colorado State University (Veterinary Diagnostic Laboratories) (US), The Pirbright Institute (UK), IDVet (France), Friedrich-Loeffler-Institute (FLI) (Germany), and Kansas State Veterinary Diagnostic Laboratory (US) |
The research report categorizes the market into the following segments:
Month & Year |
Approach |
SERVICE Type |
SERVICE Name |
dESCRIPTION |
Company NAme |
October 2021 |
Service Launch |
Clinical Pathology |
Cytology-Urine |
The Cytology-Urine test includes a full urinalysis as well as stained slide examination by a clinical pathologist. |
TVMDL (US) |
June 2021 |
Service Launch |
CIVTEST SUIS MHYO Test |
ELISA Test |
The University of Minnesota offers an ELISA test for the detection of antibodies to Mycoplasma hyopneumoniae in the serum samples of pigs |
The University of Minnesota (Veterinary Diagnostic Laboratory) (US) |
August 2020 |
Service Launch |
Hematology |
ProCyte One Hematology Analyzer |
ProCyte delivers breakthrough workflow simplicity and consistent, accurate results at the point of care |
IDEXX Laboratories, Inc. (US) |
May 2020 |
Service Launch |
Molecular Diagnostics |
OPTI SARS-CoV-2 RT-PCR Laboratory Test Kit |
OPTI Medical Systems received Emergency Use Authorization from the US FDA for the OPTI SARS-CoV-2 RNA PCR Test Kit for the detection of the virus causing COVID-19 for veterinary applications |
IDEXX Laboratories, Inc. (US) |
April 2020 |
Service Launch |
Neurologic/Muscular |
RealPCR Test |
IDEXX launched the IDEXX SARS-CoV-2 (COVID-19) RealPCR Test |
IDEXX Laboratories, Inc. (US) |
Month & Year |
APPROACH |
Company 1 |
Company 2 |
Description |
Deal Size |
June 2021 |
Acquisition |
IDEXX Laboratories, Inc. |
ezyVet |
IDEXX acquired ezyVet to further expand its cloud software to raise the standard of care for patients, improve practice efficiency, and enable more effective communication with pet owners |
NA |
September 2021 |
Acquisition |
Heska Corporation (US) |
Biotech Laboratories (US) |
Heska Corporation acquired majority ownership of Biotech Laboratories, a leading manufacturer of rapid assay diagnostic tests, to expand its product offerings in rapid assays |
NA |
January 2021 |
Acquisition |
Heska Corporation (US) |
Lacuna Diagnostics (US) |
This acquisition strengthened the company’s portfolio of point-of-care digital cytology technology and telemedicine services |
NA |
February 2020 |
Acquisition |
Zoetis Inc. (US) |
Ethos Diagnostic Science Labs (US) |
Zoetis’s acquisition of Ethos was aimed at strengthening its offerings in the reference laboratory space |
NA |
November 2020 |
Collaboration |
NEOGEN Corporation (US) |
Transnetyx, Inc. |
This collaboration helped NEOGEN to increase its presence in the animal genomics and diagnostics market |
NA |
MONTH & Year |
TYPE OF DEVELOPMENT |
COMPANY NAME |
DESCRIPTION |
August 2019 |
Expansion |
Boehringer Ingelheim (Germany) |
BI announced the opening of a full-service reference laboratory in China—Boehringer Ingelheim Health Management Centre (HMC). This lab contains serology, molecular, and bacteriology sections and also integrates animal diseases, health diagnostics, and monitoring tools. |
July 2018 |
Expansion |
Heska Corporation (US) |
The company incorporated Heska Australia Pty Ltd. in the state of Victoria to expand its footprint in the Australian veterinary market. |
August 2018 |
Expansion |
IDEXX Laboratories, Inc. (US) |
IDEXX Laboratories expanded its overnight service for rural US veterinary practices with flexible pick-up times by ensuring the delivery of results by the next morning, thus making it extremely convenient for practitioners to arrange pick-ups, get faster results, and immediately start on the treatment process. |
October 2018 |
Expansion |
Thermo Fisher Scientific, Inc (US) |
Thermo Fisher opened a new business center and biorepository in Frederick to help the company meet the growing global demand for diagnostic instruments and other therapies that support patients participating in clinical trials around the world. |
Which are the top industry players in the global Veterinary Reference Laboratory Market?
The top market players in the global Veterinary Reference Laboratory Market are IDEXX Laboratories, Inc. (US), VCA, Inc. (US), GD Animal Health (Netherlands), Boehringer Ingelheim (Germany), Zoetis Inc. (US), NEOGEN Corporation (US), LABOKLIN GmbH (Germany), SYNLAB International GmbH (Germany), Heska Corporation (US), Virbac (US) and Thermo Fisher Scientific, Inc. (US).
Which are the segments that have been included in this report?
This report has the following main segments:
Which geographical region is dominating in the Veterinary Reference Laboratory Market?
The Veterinary Reference Laboratory Market is segmented into five major regions, namely, North America, Europe, the Asia Pacific, Latin America, the Middle East, and Africa. The North America accounted for the largest share of the veterinary reference laboratory market in 2020. The growth of the North American market can be attributed to the increasing adoption of companion animals, the growing pet insurance industry, rising veterinary healthcare expenditure, and the growing number of veterinary practices. In addition, a majority of players in the veterinary reference laboratory market are based in the US.
Which is the leading segment in the Veterinary Reference Laboratory Market, by Service type?
The immunodiagnostic services segment accounted for the largest share of the veterinary reference laboratory market. The large share of this segment can primarily be attributed to the widespread popularity of immunodiagnostics for disease diagnosis, screening of disease progression, and observing patient response to therapy.
What is the current size of the global Veterinary Reference Laboratory Market?
The Veterinary Reference Laboratory Market was valued at an estimated USD 3.8 billion in 2021 and is projected to reach USD 6.6 billion by 2026, at a CAGR of 11.0% during the forecast period. .
To speak to our analyst for a discussion on the above findings, click Speak to Analyst
TABLE OF CONTENTS
1 INTRODUCTION (Page No. - 30)
1.1 OBJECTIVES OF THE STUDY
1.2 MARKET DEFINITION
1.2.1 INCLUSIONS AND EXCLUSIONS
1.3 MARKET SCOPE
1.3.1 MARKETS COVERED
FIGURE 1 VETERINARY REFERENCE LABORATORY MARKET SEGMENTATION
FIGURE 2 VETERINARY REFERENCE LABORATORY MARKET, BY REGION
1.4 YEARS CONSIDERED FOR THE STUDY
1.5 CURRENCY
TABLE 1 STANDARD CURRENCY CONVERSION RATES
1.6 LIMITATIONS
1.7 STAKEHOLDERS
1.8 SUMMARY OF CHANGES
2 RESEARCH METHODOLOGY (Page No. - 36)
2.1 RESEARCH DATA
FIGURE 3 RESEARCH DESIGN
2.1.1 SECONDARY DATA
2.1.1.1 Key data from secondary sources
2.1.2 PRIMARY DATA
FIGURE 4 PRIMARY SOURCES
2.1.2.1 Key data from primary sources
2.1.2.2 Key industry insights
FIGURE 5 BREAKDOWN OF PRIMARY INTERVIEWS: SUPPLY-SIDE AND DEMAND-SIDE PARTICIPANTS
FIGURE 6 BREAKDOWN OF PRIMARY INTERVIEWS: BY COMPANY TYPE, DESIGNATION, AND REGION
2.2 MARKET SIZE ESTIMATION
FIGURE 7 MARKET SIZE ESTIMATION: REVENUE SHARE ANALYSIS
FIGURE 8 REVENUE SHARE ANALYSIS ILLUSTRATION: IDEXX LABORATORIES
FIGURE 9 SUPPLY-SIDE MARKET SIZE ESTIMATION: VETERINARY REFERENCE LABORATORY MARKET (2020)
FIGURE 10 TOP-DOWN APPROACH
FIGURE 11 DRIVERS, RESTRAINTS, OPPORTUNITIES, AND CHALLENGES IN THE VETERINARY REFERENCE LABORATORY MARKET (2021–2026): IMPACT ON MARKET GROWTH & CAGR
FIGURE 12 CAGR PROJECTIONS
2.3 MARKET BREAKDOWN & DATA TRIANGULATION
FIGURE 13 MARKET DATA TRIANGULATION METHODOLOGY
2.4 MARKET SHARE ESTIMATION
2.5 ASSUMPTIONS FOR THE STUDY
3 EXECUTIVE SUMMARY (Page No. - 50)
FIGURE 14 VETERINARY REFERENCE LABORATORY MARKET, BY SERVICE TYPE, 2021 VS. 2026 (USD MILLION)
FIGURE 15 VETERINARY REFERENCE LABORATORY MARKET, BY ANIMAL TYPE, 2021 VS. 2026 (USD MILLION)
FIGURE 16 VETERINARY REFERENCE LABORATORY MARKET, BY APPLICATION, 2021 VS. 2026 (USD MILLION)
FIGURE 17 GEOGRAPHICAL SNAPSHOT OF THE VETERINARY REFERENCE LABORATORY MARKET
4 PREMIUM INSIGHTS (Page No. - 54)
4.1 VETERINARY REFERENCE LABORATORY MARKET OVERVIEW
FIGURE 18 GROWING COMPANION ANIMAL POPULATION TO DRIVE MARKET GROWTH DURING THE FORECAST PERIOD
4.2 ASIA PACIFIC: VETERINARY REFERENCE LABORATORY MARKET, BY SERVICE TYPE & COUNTRY (2020)
FIGURE 19 IMMUNODIAGNOSTICS ACCOUNTED FOR THE LARGEST SHARE OF THE APAC VETERINARY REFERENCE LABORATORY MARKET IN 2020
4.3 VETERINARY REFERENCE LABORATORY MARKET: GEOGRAPHIC GROWTH OPPORTUNITIES
FIGURE 20 CHINA TO REGISTER THE HIGHEST GROWTH IN THE VETERINARY REFERENCE LABORATORY MARKET DURING THE FORECAST PERIOD
4.4 VETERINARY REFERENCE LABORATORY MARKET: REGIONAL MIX
FIGURE 21 NORTH AMERICA WILL CONTINUE TO DOMINATE THE MARKET IN 2026
5 MARKET OVERVIEW (Page No. - 57)
5.1 INTRODUCTION
5.2 MARKET DYNAMICS
FIGURE 22 VETERINARY REFERENCE LABORATORY MARKET: DRIVERS, RESTRAINTS, OPPORTUNITIES, AND CHALLENGES
5.2.1 DRIVERS
5.2.1.1 Growth in the companion animal population
FIGURE 23 PET POPULATION & PET OWNERSHIP, 2017 VS. 2018 VS. 2019
5.2.1.2 Growing demand for pet insurance and increasing pet care expenditure
FIGURE 24 US: PET INDUSTRY EXPENDITURE
TABLE 2 NORTH AMERICA: PET HEALTH INSURANCE MARKET, 2012–2018 (USD MILLION)
5.2.1.3 Increasing number of veterinary practitioners in developed economies
FIGURE 25 NORTH AMERICA: NUMBER OF VETERINARY PRACTITIONERS
FIGURE 26 EUROPE: NUMBER OF VETERINARY PRACTITIONERS
5.2.1.4 Increasing demand for animal-derived food products
TABLE 3 PAST AND PROJECTED TRENDS IN THE CONSUMPTION OF MEAT AND MILK IN DEVELOPED AND DEVELOPING REGIONS
FIGURE 27 ASIA: COUNTRY-LEVEL CONSUMPTION OF ANIMAL-DERIVED FOOD PRODUCTS, 2020 VS. 2030 (THOUSAND METRIC TONS)
FIGURE 28 ASIA: COUNTRY-LEVEL PRODUCTION OF ANIMAL-DERIVED FOOD PRODUCTS, 2020 VS. 2030 (THOUSAND METRIC TONS)
5.2.1.5 Increasing incidence of transboundary and zoonotic diseases
5.2.2 RESTRAINTS
5.2.2.1 Increasing pet care costs
FIGURE 29 ANNUAL ROUTINE VETERINARY VISIT EXPENDITURE: DOGS & CATS
5.2.2.2 Growing demand for rapid tests, POC testing, and portable instruments
5.2.3 OPPORTUNITIES
5.2.3.1 Untapped emerging markets
5.2.3.2 Public-private partnerships in veterinary health
5.2.3.3 Increased use of PCR testing panels to rule out COVID-19 in animals
5.2.4 CHALLENGES
5.2.4.1 Low awareness in emerging markets
5.2.4.2 Shortage of veterinarians in emerging markets
FIGURE 30 NUMBER OF VETERINARY PROFESSIONALS, BY COUNTRY (2016 VS. 2018)
5.2.4.3 Weak functional and infrastructural capacities
6 INDUSTRY INSIGHTS (Page No. - 67)
6.1 TECHNOLOGY ANALYSIS
6.1.1 DEVELOPMENT OF PORTABLE INSTRUMENTS FOR POC DIAGNOSTIC SERVICES
TABLE 4 LAUNCH OF POINT-OF-CARE PORTABLE VETERINARY DIAGNOSTIC TESTS
6.1.2 DEVELOPMENT OF RAPID AND SENSITIVE VETERINARY LABORATORY TESTS
6.2 INDUSTRY TRENDS
6.2.1 ADOPTION OF MULTIPLE TESTING PANELS
TABLE 5 MULTIPLE TESTING PANELS VS. SINGLE TESTING PANELS
6.2.2 OUTSOURCING OF VETERINARY DIAGNOSTIC TESTING SERVICES
6.2.3 INNOVATION IN DIAGNOSTIC PRODUCTS FOR QUALITY SERVICE IMPLEMENTATION
6.3 DISEASE TRENDS
6.3.1 LIVESTOCK ANIMALS
6.3.1.1 Avian influenza (AI)
6.3.1.2 African swine fever (ASF)
6.3.1.3 Bovine babesiosis (BB)
6.3.1.4 Peste des petits ruminants (PPR)
6.3.1.5 West Nile virus (WNV)
6.3.2 COMPANION ANIMALS
6.3.2.1 Zoonotic diseases
TABLE 6 COMMON ZOONOTIC DISEASES SPREAD BY COMPANION ANIMALS ACROSS THE GLOBE
6.3.2.2 Obesity & diabetes
6.4 REGULATORY ANALYSIS
6.5 PRICING ANALYSIS
TABLE 7 PRICING ANALYSIS, 2019 (USD)
6.6 ECOSYSTEM MAPPING
FIGURE 31 VETERINARY REFERENCE LABORATORY MARKET: ECOSYSTEM MARKET MAP
6.7 PATENT ANALYSIS
6.7.1 PATENT PUBLICATION TRENDS FOR VETERINARY REFERENCE LABORATORIES
FIGURE 32 GLOBAL PATENT PUBLICATION TRENDS IN THE VETERINARY REFERENCE LABORATORY MARKET, 2015–2020
6.8 IMPACT OF THE COVID-19 PANDEMIC ON THE VETERINARY REFERENCE LABORATORY MARKET
TABLE 8 GLOBAL SNAPSHOT OF THE REPORTED CASES OF NATURALLY ACQUIRED SARS-COV-2 (COVID-19) INFECTIONS IN ANIMALS
FIGURE 33 MONTHLY VETERINARY PRACTICE ACTIVITY, BY REGION, JANUARY–JUNE 2020
7 VETERINARY REFERENCE LABORATORY MARKET, BY SERVICE TYPE (Page No. - 77)
7.1 INTRODUCTION
TABLE 9 VETERINARY REFERENCE LABORATORY MARKET, BY SERVICE TYPE, 2019–2026 (USD MILLION)
7.1.1 IMPACT OF COVID-19 ON THE TYPE OF TECHNOLOGIES USED
7.2 CLINICAL CHEMISTRY
7.2.1 INCREASING PET HEALTHCARE EXPENDITURE AND THE RISING NUMBER OF SCREENING TESTS PERFORMED TO DRIVE MARKET GROWTH
TABLE 10 VETERINARY REFERENCE LABORATORY MARKET FOR CLINICAL CHEMISTRY, BY COUNTRY, 2019–2026 (USD MILLION)
7.3 HEMATOLOGY
7.3.1 HEMATOLOGY SERVICES ARE USED TO MEASURE BLOOD CELL COUNT AND COAGULATION TIME OF BLOOD IN ANIMALS
TABLE 11 VETERINARY REFERENCE LABORATORY MARKET FOR HEMATOLOGY, BY COUNTRY, 2019–2026 (USD MILLION)
7.4 IMMUNODIAGNOSTICS
7.4.1 LOW COST AND PROCEDURAL COMPLEXITY ARE DRIVING THE GROWTH OF THIS SEGMENT
TABLE 12 VETERINARY REFERENCE LABORATORY MARKET FOR IMMUNODIAGNOSTICS, BY COUNTRY, 2019–2026 (USD MILLION)
7.5 MOLECULAR DIAGNOSTICS
7.5.1 GROWING DEMAND FOR RELIABLE AND RAPID METHODS OF GENETIC DISORDER DETECTION TO DRIVE MARKET GROWTH
TABLE 13 VETERINARY REFERENCE LABORATORY MARKET FOR MOLECULAR DIAGNOSTICS, BY COUNTRY, 2019–2026 (USD MILLION)
7.6 URINALYSIS
7.6.1 RISING OCCURRENCE OF KIDNEY DISEASES IN CATS AND DOGS TO SUPPORT THE GROWTH OF THIS SEGMENT
TABLE 14 VETERINARY REFERENCE LABORATORY MARKET FOR URINALYSIS, BY COUNTRY, 2019–2026 (USD MILLION)
7.7 OTHER SERVICES
TABLE 15 VETERINARY REFERENCE LABORATORY MARKET FOR OTHER SERVICES, BY COUNTRY, 2019–2026 (USD MILLION)
8 VETERINARY REFERENCE LABORATORY MARKET, BY APPLICATION (Page No. - 86)
8.1 INTRODUCTION
TABLE 16 VETERINARY REFERENCE LABORATORY MARKET, BY APPLICATION, 2019–2026 (USD MILLION)
8.1.1 IMPACT OF COVID-19 ACROSS DIFFERENT APPLICATION AREAS
8.2 CLINICAL PATHOLOGY
8.2.1 CLINICAL PATHOLOGY SEGMENT DOMINATES THE VETERINARY REFERENCE LABORATORY APPLICATIONS MARKET
TABLE 17 VETERINARY REFERENCE LABORATORY MARKET FOR CLINICAL PATHOLOGY, BY COUNTRY, 2019–2026 (USD MILLION)
8.3 BACTERIOLOGY
8.3.1 RISING PREVALENCE OF ZOONOTIC DISEASES WILL DRIVE THE MARKET FOR BACTERIOLOGY
TABLE 18 VETERINARY REFERENCE LABORATORY MARKET FOR BACTERIOLOGY, BY COUNTRY, 2019–2026 (USD MILLION)
8.4 PARASITOLOGY
8.4.1 INCREASING PREVALENCE OF PARASITIC DISEASES WILL SUPPORT THE GROWTH OF THIS APPLICATION SEGMENT
TABLE 19 VETERINARY REFERENCE LABORATORY MARKET FOR PARASITOLOGY, BY COUNTRY, 2019–2026 (USD MILLION)
8.5 VIROLOGY
8.5.1 GROWING NUMBER OF VIRAL OUTBREAKS IS CONTRIBUTING TO THE GROWTH OF THIS SEGMENT
TABLE 20 VETERINARY REFERENCE LABORATORY MARKET FOR VIROLOGY, BY COUNTRY, 2019–2026 (USD MILLION)
8.6 PRODUCTIVITY TESTING
8.6.1 INCREASING FOCUS ON ENSURING THE QUALITY OF MILK AND MEAT IS DRIVING THE DEMAND FOR PRODUCTIVITY TESTING
TABLE 21 VETERINARY REFERENCE LABORATORY MARKET FOR PRODUCTIVITY TESTING, BY COUNTRY, 2019–2026 (USD MILLION)
8.7 PREGNANCY TESTING
8.7.1 FOCUS ON BREEDING AND HERD MANAGEMENT PROGRAMS WILL DRIVE THE GROWTH OF THIS SEGMENT
TABLE 22 VETERINARY REFERENCE LABORATORY MARKET FOR PREGNANCY TESTING, BY COUNTRY, 2019–2026 (USD MILLION)
8.8 TOXICOLOGY TESTING
8.8.1 REGULATION OF ANIMAL HEALTH TO AVOID FEED AND ANIMAL-DERIVED FOOD CONTAMINATION IS DRIVING MARKET GROWTH
TABLE 23 VETERINARY REFERENCE LABORATORY MARKET FOR TOXICOLOGY, BY COUNTRY, 2019–2026 (USD MILLION)
9 VETERINARY REFERENCE LABORATORY MARKET, BY ANIMAL TYPE (Page No. - 95)
9.1 INTRODUCTION
TABLE 24 VETERINARY REFERENCE LABORATORY MARKET, BY ANIMAL TYPE, 2019–2026 (USD MILLION)
9.1.1 IMPACT OF COVID-19 ON TESTING IN ANIMALS
9.2 COMPANION ANIMALS
TABLE 25 POPULATION OF SMALL COMPANION ANIMALS, BY COUNTRY, 2012–2019 (MILLION)
TABLE 26 VETERINARY REFERENCE LABORATORY MARKET FOR COMPANION ANIMALS, BY TYPE, 2019–2026 (USD MILLION)
TABLE 27 VETERINARY REFERENCE LABORATORY MARKET FOR COMPANION ANIMALS, BY COUNTRY, 2019–2026 (USD MILLION)
9.2.1 DOGS
9.2.1.1 Increasing incidence of zoonotic, chronic, and parasitic diseases in dogs to drive the growth of this market segment
FIGURE 34 NUMBER OF PET DOGS IN CHINA FROM 2013 TO 2022 (IN MILLION)
TABLE 28 VETERINARY REFERENCE LABORATORY MARKET FOR DOGS, BY COUNTRY, 2019–2026 (USD MILLION)
9.2.2 CATS
9.2.2.1 Rising prevalence of infectious diseases in cats to drive the growth of this market segment
TABLE 29 VETERINARY REFERENCE LABORATORY MARKET FOR CATS, BY COUNTRY, 2019–2026 (USD MILLION)
9.2.3 HORSES
9.2.3.1 Global equine population has witnessed slow growth in recent years
TABLE 30 VETERINARY REFERENCE LABORATORY MARKET FOR HORSES, BY COUNTRY, 2019–2026 (USD MILLION)
9.2.4 OTHER COMPANION ANIMALS
TABLE 31 NUMBER OF US HOUSEHOLDS THAT OWN A PET, BY TYPE OF ANIMAL (2020)
TABLE 32 VETERINARY REFERENCE LABORATORY MARKET FOR OTHER COMPANION ANIMALS, BY COUNTRY, 2019–2026 (USD MILLION)
9.3 LIVESTOCK ANIMALS
TABLE 33 POPULATION OF LARGE ANIMALS IN THE US, 2010–2018 (MILLION)
TABLE 34 VETERINARY REFERENCE LABORATORY MARKET FOR LIVESTOCK ANIMALS, BY TYPE, 2019–2026 (USD MILLION)
TABLE 35 VETERINARY REFERENCE LABORATORY MARKET FOR LIVESTOCK ANIMALS, BY COUNTRY, 2019–2026 (USD MILLION)
9.3.1 CATTLE
9.3.1.1 Early diagnosis is crucial as cattle contribute more than 85% to the global milk supply
TABLE 36 VETERINARY REFERENCE LABORATORY MARKET FOR CATTLE, BY COUNTRY, 2019–2026 (USD MILLION)
9.3.2 PIGS
9.3.2.1 Growing need to check disease outbreaks to drive the growth of this market segment
TABLE 37 VETERINARY REFERENCE LABORATORY MARKET FOR PIGS, BY COUNTRY, 2019–2026 (USD MILLION)
9.3.3 POULTRY
9.3.3.1 Increasing focus on animal-derived protein sources from poultry will drive the growth of this market segment
FIGURE 35 GLOBAL POULTRY MEAT PRODUCTION, 2016 VS. 2017 VS. 2018 (MILLION METRIC TONS)
TABLE 38 VETERINARY REFERENCE LABORATORY MARKET FOR POULTRY, BY COUNTRY, 2019–2026 (USD MILLION)
9.3.4 SHEEP AND GOATS
9.3.4.1 Increasing prevalence of diseases in sheep and goats to drive the growth of this market segment
TABLE 39 VETERINARY REFERENCE LABORATORY MARKET FOR SHEEP AND GOATS, BY COUNTRY, 2019–2026 (USD MILLION)
9.3.5 OTHER LIVESTOCK ANIMALS
TABLE 40 VETERINARY REFERENCE LABORATORY MARKET FOR OTHER LIVESTOCK ANIMALS, BY COUNTRY, 2019–2026 (USD MILLION)
10 VETERINARY REFERENCE LABORATORY MARKET, BY REGION (Page No. - 112)
10.1 INTRODUCTION
FIGURE 36 INDIA TO REGISTER THE HIGHEST GROWTH RATE IN THE VETERINARY REFERENCE LABORATORY MARKET DURING THE FORECAST PERIOD
TABLE 41 VETERINARY REFERENCE LABORATORY MARKET, BY COUNTRY, 2019–2026 (USD MILLION)
10.2 NORTH AMERICA
FIGURE 37 EXPECTED GROWTH IN THE NUMBER OF VETERINARIANS IN NORTH AMERICA
FIGURE 38 NORTH AMERICA: VETERINARY REFERENCE LABORATORY MARKET SNAPSHOT
TABLE 42 NORTH AMERICA: VETERINARY REFERENCE LABORATORY MARKET, BY COUNTRY, 2019–2026 (USD MILLION)
TABLE 43 NORTH AMERICA: VETERINARY REFERENCE LABORATORY MARKET, BY SERVICE TYPE, 2019–2026 (USD MILLION)
TABLE 44 NORTH AMERICA: VETERINARY REFERENCE LABORATORY MARKET, BY ANIMAL TYPE, 2019–2026 (USD MILLION)
TABLE 45 NORTH AMERICA: VETERINARY REFERENCE LABORATORY MARKET FOR COMPANION ANIMALS, BY TYPE, 2019–2026 (USD MILLION)
TABLE 46 NORTH AMERICA: VETERINARY REFERENCE LABORATORY MARKET FOR LIVESTOCK ANIMALS, BY TYPE, 2019–2026 (USD MILLION)
TABLE 47 NORTH AMERICA: VETERINARY REFERENCE LABORATORY MARKET, BY APPLICATION, 2019–2026 (USD MILLION)
10.2.1 US
10.2.1.1 The US dominated the veterinary reference laboratory market in North America
TABLE 48 US: FOOD-PRODUCING ANIMAL POPULATION, 2001–2019 (MILLION)
FIGURE 39 US: PET OWNERSHIP INDICATORS, 2017–2018
TABLE 49 US: PRIVATE CLINICAL PRACTICES, BY ANIMAL TYPE, 2014–2019
TABLE 50 US: VETERINARY REFERENCE LABORATORY MARKET, BY SERVICE TYPE, 2019–2026 (USD MILLION)
TABLE 51 US: VETERINARY REFERENCE LABORATORY MARKET, BY ANIMAL TYPE, 2019–2026 (USD MILLION)
TABLE 52 US: VETERINARY REFERENCE LABORATORY MARKET FOR COMPANION ANIMALS, BY TYPE, 2019–2026 (USD MILLION)
TABLE 53 US: VETERINARY REFERENCE LABORATORY MARKET FOR LIVESTOCK ANIMALS, BY TYPE, 2019–2026 (USD MILLION)
TABLE 54 US: VETERINARY REFERENCE LABORATORY MARKET, BY APPLICATION, 2019–2026 (USD MILLION)
10.2.2 CANADA
10.2.2.1 Increasing population of livestock animals and adoption of pets to drive market growth in Canada
TABLE 55 COMPANION ANIMAL POPULATION IN CANADA, 2016–2020 (MILLION)
TABLE 56 CANADA: LARGE ANIMAL POPULATION, 2001–2019 (MILLION)
TABLE 57 CANADA: VETERINARY REFERENCE LABORATORY MARKET, BY SERVICE TYPE, 2019–2026 (USD MILLION)
TABLE 58 CANADA: VETERINARY REFERENCE LABORATORY MARKET, BY ANIMAL TYPE, 2019–2026 (USD MILLION)
TABLE 59 CANADA: VETERINARY REFERENCE LABORATORY MARKET FOR COMPANION ANIMALS, BY TYPE, 2019–2026 (USD MILLION)
TABLE 60 CANADA: VETERINARY REFERENCE LABORATORY MARKET FOR LIVESTOCK ANIMALS, BY TYPE, 2019–2026 (USD MILLION)
TABLE 61 CANADA: VETERINARY REFERENCE LABORATORY MARKET, BY APPLICATION, 2019–2026 (USD MILLION)
10.3 EUROPE
FIGURE 40 EU-27: LIVESTOCK POPULATION, 2012–2019 (MILLION)
TABLE 62 EUROPE: NUMBER OF VETERINARIANS, 2012–2019
FIGURE 41 EUROPE: VETERINARY REFERENCE LABORATORY MARKET SNAPSHOT
TABLE 63 EUROPE: VETERINARY REFERENCE LABORATORY MARKET, BY COUNTRY, 2019–2026 (USD MILLION)
TABLE 64 EUROPE: VETERINARY REFERENCE LABORATORY MARKET, BY SERVICE TYPE, 2019–2026 (USD MILLION)
TABLE 65 EUROPE: VETERINARY REFERENCE LABORATORY MARKET, BY ANIMAL TYPE, 2019–2026 (USD MILLION)
TABLE 66 EUROPE: VETERINARY REFERENCE LABORATORY MARKET FOR COMPANION ANIMALS, BY TYPE, 2019–2026 (USD MILLION)
TABLE 67 EUROPE: VETERINARY REFERENCE LABORATORY MARKET FOR LIVESTOCK ANIMALS, BY TYPE, 2019–2026 (USD MILLION)
TABLE 68 EUROPE: VETERINARY REFERENCE LABORATORY MARKET, BY APPLICATION, 2019–2026 (USD MILLION)
10.3.1 UK
10.3.1.1 The UK dominates the veterinary reference laboratory market in Europe
TABLE 69 UK: COMPANION ANIMAL POPULATION, 2010–2019 (MILLION)
TABLE 70 UK: NUMBER OF VETERINARIANS, 2014 VS. 2019
TABLE 71 UK: VETERINARY REFERENCE LABORATORY MARKET, BY SERVICE TYPE, 2019–2026 (USD MILLION)
TABLE 72 UK: VETERINARY REFERENCE LABORATORY MARKET, BY ANIMAL TYPE, 2019–2026 (USD MILLION)
TABLE 73 UK: VETERINARY REFERENCE LABORATORY MARKET FOR COMPANION ANIMALS, BY TYPE, 2019–2026 (USD MILLION)
TABLE 74 UK: VETERINARY REFERENCE LABORATORY MARKET FOR LIVESTOCK ANIMALS, BY TYPE, 2019–2026 (USD MILLION)
TABLE 75 UK: VETERINARY REFERENCE LABORATORY MARKET, BY APPLICATION, 2019–2026 (USD MILLION)
10.3.2 GERMANY
10.3.2.1 The majority of veterinary practices in Germany collaborate with reference laboratories for testing services
TABLE 76 GERMANY: COMPANION ANIMAL POPULATION, 2016–2019 (MILLION)
TABLE 77 GERMANY: NUMBER OF VETERINARIANS, 2014 VS. 2019
TABLE 78 GERMANY: VETERINARY REFERENCE LABORATORY MARKET, BY SERVICE TYPE, 2019–2026 (USD MILLION)
TABLE 79 GERMANY: VETERINARY REFERENCE LABORATORY MARKET, BY ANIMAL TYPE, 2019–2026 (USD MILLION)
TABLE 80 GERMANY: VETERINARY REFERENCE LABORATORY MARKET FOR COMPANION ANIMALS, BY TYPE, 2019–2026 (USD MILLION)
TABLE 81 GERMANY: VETERINARY REFERENCE LABORATORY MARKET FOR LIVESTOCK ANIMALS, BY TYPE, 2019–2026 (USD MILLION)
TABLE 82 GERMANY: VETERINARY REFERENCE LABORATORY MARKET, BY APPLICATION, 2019–2026 (USD MILLION)
10.3.3 FRANCE
10.3.3.1 Rising pet ownership rate is one of the major drivers for market growth in France
TABLE 83 FRANCE: COMPANION ANIMAL POPULATION, 2010–2019 (MILLION)
TABLE 84 FRANCE: LIVESTOCK ANIMAL POPULATION, 2016–2019 (MILLION)
TABLE 85 FRANCE: NUMBER OF VETERINARIANS, 2014 VS. 2017
TABLE 86 FRANCE: VETERINARY REFERENCE LABORATORY MARKET, BY SERVICE TYPE, 2019–2026 (USD MILLION)
TABLE 87 FRANCE: VETERINARY REFERENCE LABORATORY MARKET, BY ANIMAL TYPE, 2019–2026 (USD MILLION)
TABLE 88 FRANCE: VETERINARY REFERENCE LABORATORY MARKET FOR COMPANION ANIMALS, BY TYPE, 2019–2026 (USD MILLION)
TABLE 89 FRANCE: VETERINARY REFERENCE LABORATORY MARKET FOR LIVESTOCK ANIMALS, BY TYPE, 2019–2026 (USD MILLION)
TABLE 90 FRANCE: VETERINARY REFERENCE LABORATORY MARKET, BY APPLICATION, 2019–2026 (USD MILLION)
10.3.4 ITALY
10.3.4.1 Disease outbreaks and rising meat consumption indicate demand for testing facilities in Italy
TABLE 91 ITALY: NUMBER OF VETERINARIANS, 2012 VS. 2017
TABLE 92 ITALY: VETERINARY REFERENCE LABORATORY MARKET, BY SERVICE TYPE, 2019–2026 (USD MILLION)
TABLE 93 ITALY: VETERINARY REFERENCE LABORATORY MARKET, BY ANIMAL TYPE, 2019–2026 (USD MILLION)
TABLE 94 ITALY: VETERINARY REFERENCE LABORATORY MARKET FOR COMPANION ANIMALS, BY TYPE, 2019–2026 (USD MILLION)
TABLE 95 ITALY: VETERINARY REFERENCE LABORATORY MARKET FOR LIVESTOCK ANIMALS, BY TYPE, 2019–2026 (USD MILLION)
TABLE 96 ITALY: VETERINARY REFERENCE LABORATORY MARKET, BY APPLICATION, 2019–2026 (USD MILLION)
10.3.5 SPAIN
10.3.5.1 Increasing number of veterinary practices and willingness to spend on animal healthcare to propel market growth
TABLE 97 SPAIN: COMPANION ANIMAL POPULATION, 2016–2019 (MILLION)
TABLE 98 SPAIN: LIVESTOCK ANIMAL POPULATION, 2016–2019 (MILLION)
TABLE 99 SPAIN: VETERINARY REFERENCE LABORATORY MARKET, BY SERVICE TYPE, 2019–2026 (USD MILLION)
TABLE 100 SPAIN: VETERINARY REFERENCE LABORATORY MARKET, BY ANIMAL TYPE, 2019–2026 (USD MILLION)
TABLE 101 SPAIN: VETERINARY REFERENCE LABORATORY MARKET FOR COMPANION ANIMALS, BY TYPE, 2019–2026 (USD MILLION)
TABLE 102 SPAIN: VETERINARY REFERENCE LABORATORY MARKET FOR LIVESTOCK ANIMALS, BY TYPE, 2019–2026 (USD MILLION)
TABLE 103 SPAIN: VETERINARY REFERENCE LABORATORY MARKET, BY APPLICATION, 2019–2026 (USD MILLION)
10.3.6 REST OF EUROPE
TABLE 104 ROE: COMPANION ANIMAL OWNERSHIP, BY COUNTRY, 2019 (MILLION)
TABLE 105 ROE: LIVESTOCK ANIMAL POPULATION, BY COUNTRY, 2019 (MILLION)
TABLE 106 ROE: NUMBER OF VETERINARIANS AND PARAVETERINARIANS, 2010 VS. 2019
TABLE 107 ROE: VETERINARY REFERENCE LABORATORY MARKET, BY SERVICE TYPE, 2019–2026 (USD MILLION)
TABLE 108 ROE: VETERINARY REFERENCE LABORATORY MARKET, BY ANIMAL TYPE, 2019–2026 (USD MILLION)
TABLE 109 ROE: VETERINARY REFERENCE LABORATORY MARKET FOR COMPANION ANIMALS, BY TYPE, 2019–2026 (USD MILLION)
TABLE 110 ROE: VETERINARY REFERENCE LABORATORY MARKET FOR LIVESTOCK ANIMALS, BY TYPE, 2019–2026 (USD MILLION)
TABLE 111 ROE: VETERINARY REFERENCE LABORATORY MARKET, BY APPLICATION, 2019–2026 (USD MILLION)
10.4 ASIA PACIFIC
FIGURE 42 ASIA PACIFIC: VETERINARY REFERENCE LABORATORY MARKET SNAPSHOT
TABLE 112 APAC: VETERINARY REFERENCE LABORATORY MARKET, BY COUNTRY, 2019–2026 (USD MILLION)
TABLE 113 APAC: VETERINARY REFERENCE LABORATORY MARKET, BY SERVICE TYPE, 2019–2026 (USD MILLION)
TABLE 114 APAC: VETERINARY REFERENCE LABORATORY MARKET, BY ANIMAL TYPE, 2019–2026 (USD MILLION)
TABLE 115 APAC: VETERINARY REFERENCE LABORATORY MARKET FOR COMPANION ANIMALS, BY TYPE, 2019–2026 (USD MILLION)
TABLE 116 APAC: VETERINARY REFERENCE LABORATORY MARKET FOR LIVESTOCK ANIMALS, BY TYPE, 2019–2026 (USD MILLION)
TABLE 117 APAC: VETERINARY REFERENCE LABORATORY MARKET, BY APPLICATION, 2019–2026 (USD MILLION)
10.4.1 CHINA
10.4.1.1 China dominates the Asia Pacific market
TABLE 118 CHINA: LIVESTOCK POPULATION, 2010–2019 (MILLION)
TABLE 119 CHINA: VETERINARY REFERENCE LABORATORY MARKET, BY SERVICE TYPE, 2019–2026 (USD MILLION)
TABLE 120 CHINA: VETERINARY REFERENCE LABORATORY MARKET, BY ANIMAL TYPE, 2019–2026 (USD MILLION)
TABLE 121 CHINA: VETERINARY REFERENCE LABORATORY MARKET FOR COMPANION ANIMALS, BY TYPE, 2019–2026 (USD MILLION)
TABLE 122 CHINA: VETERINARY REFERENCE LABORATORY MARKET FOR LIVESTOCK ANIMALS, BY TYPE, 2019–2026 (USD MILLION)
TABLE 123 CHINA: VETERINARY REFERENCE LABORATORY MARKET, BY APPLICATION, 2019–2026 (USD MILLION)
10.4.2 JAPAN
10.4.2.1 Rising demand for diagnosing zoonotic diseases in imported pet breeds is expected to drive market growth
TABLE 124 PRODUCTION, CONSUMPTION, IMPORT, AND EXPORT OF ANIMAL-DERIVED FOOD PRODUCTS IN JAPAN, 2000 VS. 2030 (THOUSAND METRIC TONS)
TABLE 125 JAPAN: VETERINARY REFERENCE LABORATORY MARKET, BY SERVICE TYPE, 2019–2026 (USD MILLION)
TABLE 126 JAPAN: VETERINARY REFERENCE LABORATORY MARKET, BY ANIMAL TYPE, 2019–2026 (USD MILLION)
TABLE 127 JAPAN: VETERINARY REFERENCE LABORATORY MARKET FOR COMPANION ANIMALS, BY TYPE, 2019–2026 (USD MILLION)
TABLE 128 JAPAN: VETERINARY REFERENCE LABORATORY MARKET FOR LIVESTOCK ANIMALS, BY TYPE, 2019–2026 (USD MILLION)
TABLE 129 JAPAN: VETERINARY REFERENCE LABORATORY MARKET, BY APPLICATION, 2019–2026 (USD MILLION)
10.4.3 INDIA
10.4.3.1 India is an untapped market with huge growth potential
TABLE 130 INDIA: LIVESTOCK POPULATION, 2007–2019 (MILLION)
TABLE 131 INDIA: PRODUCTION AND CONSUMPTION OF ANIMAL-DERIVED FOOD PRODUCTS, 2000 VS. 2030 (THOUSAND METRIC TONS)
TABLE 132 INDIA: VETERINARY REFERENCE LABORATORY MARKET, BY SERVICE TYPE, 2019–2026 (USD MILLION)
TABLE 133 INDIA: VETERINARY REFERENCE LABORATORY MARKET, BY ANIMAL TYPE, 2019–2026 (USD MILLION)
TABLE 134 INDIA: VETERINARY REFERENCE LABORATORY MARKET FOR COMPANION ANIMALS, BY TYPE, 2019–2026 (USD MILLION)
TABLE 135 INDIA: VETERINARY REFERENCE LABORATORY MARKET FOR LIVESTOCK ANIMALS, BY TYPE, 2019–2026 (USD MILLION)
TABLE 136 INDIA: VETERINARY REFERENCE LABORATORY MARKET, BY APPLICATION, 2019–2026 (USD MILLION)
10.4.4 AUSTRALIA
10.4.4.1 Australia is one of the largest consumers of beef & mutton in the world
TABLE 137 AUSTRALIA: LIVESTOCK POPULATION, BY COUNTRY, 2010–2019 (MILLION)
TABLE 138 AUSTRALIA: VETERINARY REFERENCE LABORATORY MARKET, BY SERVICE TYPE, 2019–2026 (USD MILLION)
TABLE 139 AUSTRALIA: VETERINARY REFERENCE LABORATORY MARKET, BY ANIMAL TYPE, 2019–2026 (USD MILLION)
TABLE 140 AUSTRALIA: VETERINARY REFERENCE LABORATORY MARKET FOR COMPANION ANIMALS, BY TYPE, 2019–2026 (USD MILLION)
TABLE 141 AUSTRALIA: VETERINARY REFERENCE LABORATORY MARKET FOR LIVESTOCK ANIMALS, BY TYPE, 2019–2026 (USD MILLION)
TABLE 142 AUSTRALIA: VETERINARY REFERENCE LABORATORY MARKET, BY APPLICATION, 2019–2026 (USD MILLION)
10.4.5 REST OF APAC
TABLE 143 ROAPAC: LIVESTOCK POPULATION, BY COUNTRY, 2010–2019 (MILLION)
TABLE 144 ROAPAC: VETERINARY REFERENCE LABORATORY MARKET, BY SERVICE TYPE, 2019–2026 (USD MILLION)
TABLE 145 ROAPAC: VETERINARY REFERENCE LABORATORY MARKET, BY ANIMAL TYPE, 2019–2026 (USD MILLION)
TABLE 146 ROAPAC: VETERINARY REFERENCE LABORATORY MARKET FOR COMPANION ANIMALS, BY TYPE, 2019–2026 (USD MILLION)
TABLE 147 ROAPAC: VETERINARY REFERENCE LABORATORY MARKET FOR LIVESTOCK ANIMALS, BY TYPE, 2019–2026 (USD MILLION)
TABLE 148 ROAPAC: VETERINARY REFERENCE LABORATORY MARKET, BY APPLICATION, 2019–2026 (USD MILLION)
10.5 LATIN AMERICA
10.5.1 RISING BEEF EXPORTS AND GROWING PET ADOPTION HAVE DRIVEN MARKET GROWTH IN LATAM
TABLE 149 LATIN AMERICA: LIVESTOCK POPULATION, BY COUNTRY, 2010–2019 (MILLION)
TABLE 150 LATIN AMERICA: NUMBER OF VETERINARIANS AND PARAVETERINARIANS, 2010 VS. 2019
TABLE 151 LATIN AMERICA: VETERINARY REFERENCE LABORATORY MARKET, BY SERVICE TYPE, 2019–2026 (USD MILLION)
TABLE 152 LATIN AMERICA: VETERINARY REFERENCE LABORATORY MARKET, BY ANIMAL TYPE, 2019–2026 (USD MILLION)
TABLE 153 LATIN AMERICA: VETERINARY REFERENCE LABORATORY MARKET FOR COMPANION ANIMALS, BY TYPE, 2019–2026 (USD MILLION)
TABLE 154 LATIN AMERICA: VETERINARY REFERENCE LABORATORY MARKET FOR LIVESTOCK ANIMALS, BY TYPE, 2019–2026 (USD MILLION)
TABLE 155 LATIN AMERICA: VETERINARY REFERENCE LABORATORY MARKET, BY APPLICATION, 2019–2026 (USD MILLION)
10.6 MIDDLE EAST & AFRICA
10.6.1 RELUCTANCE TO SPEND ON PET HEALTH HAS SLOWED THE PACE OF MARKET GROWTH
TABLE 156 MIDDLE EAST: LIVESTOCK ANIMAL POPULATION, 2010 VS. 2019
TABLE 157 AFRICA: FOOD-PRODUCING ANIMAL POPULATION, 2012–2019 (MILLION)
TABLE 158 AFRICA: NUMBER OF VETERINARIANS AND PARAVETERINARIANS, 2010–2018
TABLE 159 MEA: VETERINARY REFERENCE LABORATORY MARKET, BY SERVICE TYPE, 2019–2026 (USD MILLION)
TABLE 160 MEA: VETERINARY REFERENCE LABORATORY MARKET, BY ANIMAL TYPE, 2019–2026 (USD MILLION)
TABLE 161 MEA: VETERINARY REFERENCE LABORATORY MARKET FOR COMPANION ANIMALS, BY TYPE, 2019–2026 (USD MILLION)
TABLE 162 MEA: VETERINARY REFERENCE LABORATORY MARKET FOR LIVESTOCK ANIMALS, BY TYPE, 2019–2026 (USD MILLION)
TABLE 163 MEA: VETERINARY REFERENCE LABORATORY MARKET, BY APPLICATION, 2019–2026 (USD MILLION)
11 COMPETITIVE LANDSCAPE (Page No. - 170)
11.1 INTRODUCTION
FIGURE 43 KEY MARKET DEVELOPMENTS (JANUARY 2018 TO NOVEMBER 2021)
11.2 REVENUE ANALYSIS OF KEY MARKET PLAYERS
FIGURE 44 REVENUE ANALYSIS OF KEY PLAYERS OPERATING IN THE VETERINARY REFERENCE LABORATORY MARKET
11.3 MARKET SHARE ANALYSIS (FOR COMPANION ANIMALS)
FIGURE 45 VETERINARY REFERENCE LABORATORY MARKET SHARE, BY KEY PLAYER, 2020
11.4 COMPETITIVE SCENARIO
11.4.1 SERVICE LAUNCHES
TABLE 164 VETERINARY REFERENCE LABORATORY MARKET: SERVICE LAUNCHES (JANUARY 2018 TO NOVEMBER 2021)
11.4.2 DEALS
TABLE 165 VETERINARY REFERENCE LABORATORY MARKET: DEALS (JANUARY 2018 TO NOVEMBER 2021)
11.4.3 OTHER DEVELOPMENTS
TABLE 166 VETERINARY REFERENCE LABORATORY MARKET: OTHER DEVELOPMENTS (JANUARY 2018 TO NOVEMBER 2021)
11.5 COMPETITIVE BENCHMARKING
11.6 VETERINARY REFERENCE LABORATORY MARKET: R&D EXPENDITURE
11.6.1 R&D EXPENDITURE OF KEY PLAYERS IN THE VETERINARY REFERENCE LABORATORY MARKET (2019 VS. 2020)
11.7 COMPANY EVALUATION MATRIX
11.7.1 STARS
11.7.2 EMERGING LEADERS
11.7.3 PERVASIVE PLAYERS
11.7.4 EMERGING COMPANIES
FIGURE 46 VETERINARY REFERENCE LABORATORY MARKET: GLOBAL COMPANY EVALUATION MATRIX
11.8 COMPETITIVE LEADERSHIP MAPPING (SMES/START-UPS)
11.8.1 PROGRESSIVE COMPANIES
11.8.2 STARTING BLOCKS
11.8.3 RESPONSIVE COMPANIES
11.8.4 DYNAMIC COMPANIES
FIGURE 47 VETERINARY REFERENCE LABORATORY MARKET: COMPANY EVALUATION MATRIX FOR SMES/START-UPS
12 COMPANY PROFILES (Page No. - 187)
12.1 INTRODUCTION
TABLE 167 MAJOR PUBLIC, PRIVATE, AND GOVERNMENT-AIDED PLAYERS IN THE VETERINARY REFERENCE LABORATORIES MARKET
12.2 KEY PLAYERS
(Business Overview, Products Offered, Recent Developments, and MnM View (Key strengths/Right to Win, Strategic Choices Made, and Weaknesses and Competitive Threats))*
12.2.1 IDEXX LABORATORIES, INC.
TABLE 168 IDEXX LABORATORIES, INC.: BUSINESS OVERVIEW
FIGURE 48 COMPANY SNAPSHOT: IDEXX LABORATORIES, INC. (2020)
12.2.2 VCA, INC. (A PART OF MARS PETCARE)
TABLE 169 VCA, INC.: BUSINESS OVERVIEW
12.2.3 BOEHRINGER INGELHEIM
TABLE 170 BOEHRINGER INGELHEIM: BUSINESS OVERVIEW
FIGURE 49 COMPANY SNAPSHOT: BOEHRINGER INGELHEIM (2020)
12.2.4 GD ANIMAL HEALTH
TABLE 171 GD ANIMAL HEALTH: BUSINESS OVERVIEW
12.2.5 ZOETIS INC.
TABLE 172 ZOETIS INC.: BUSINESS OVERVIEW
FIGURE 50 COMPANY SNAPSHOT: ZOETIS INC. (2020)
12.2.6 NEOGEN CORPORATION
TABLE 173 NEOGEN CORPORATION: BUSINESS OVERVIEW
FIGURE 51 COMPANY SNAPSHOT: NEOGEN CORPORATION (2020)
12.2.7 LABOKLIN GMBH
TABLE 174 LABOKLIN GMBH: BUSINESS OVERVIEW
12.2.8 SYNLAB INTERNATIONAL GMBH
TABLE 175 SYNLAB INTERNATIONAL GMBH: BUSINESS OVERVIEW
12.2.9 HESKA CORPORATION
TABLE 176 HESKA CORPORATION: BUSINESS OVERVIEW
FIGURE 52 COMPANY SNAPSHOT: HESKA CORPORATION (2020)
12.2.10 VIRBAC
TABLE 177 VIRBAC: BUSINESS OVERVIEW
FIGURE 53 COMPANY SNAPSHOT: VIRBAC (2020)
12.3 OTHER PLAYERS
12.3.1 THERMO FISHER SCIENTIFIC, INC.
TABLE 178 THERMO FISHER SCIENTIFIC, INC.: BUSINESS OVERVIEW
FIGURE 54 COMPANY SNAPSHOT: THERMO FISHER SCIENTIFIC, INC. (2020)
12.3.2 TEXAS A&M VETERINARY MEDICAL DIAGNOSTIC LABORATORY
TABLE 179 TVMDL: BUSINESS OVERVIEW
12.3.3 UNIVERSITY OF MINNESOTA (VETERINARY DIAGNOSTIC LABORATORY)
TABLE 180 UNIVERSITY OF MINNESOTA’S VETERINARY DIAGNOSTIC LABORATORY: BUSINESS OVERVIEW
12.3.4 IOWA STATE UNIVERSITY (VETERINARY DIAGNOSTIC LABORATORY)
TABLE 181 IOWA STATE UNIVERSITY’S VETERINARY DIAGNOSTIC LABORATORY: BUSINESS OVERVIEW
12.3.5 VETNOSTICS
12.3.6 IDVET
12.3.7 PROTATEK INTERNATIONAL INC.
12.3.8 ANIMAL AND PLANT HEALTH AGENCY
12.3.9 ANIMAL HEALTH DIAGNOSTIC CENTER (CORNELL UNIVERSITY)
12.3.10 NATIONAL VETERINARY SERVICES LABORATORY USDA-APHIS
12.3.11 WASHINGTON ANIMAL DISEASE DIAGNOSTIC LABORATORY (WADDL)
12.3.12 COLORADO STATE UNIVERSITY (VETERINARY DIAGNOSTIC LABORATORIES)
12.3.13 THE PIRBRIGHT INSTITUTE
12.3.14 FRIEDRICH-LOEFFLER-INSTITUT (FLI)
12.3.15 KANSAS STATE VETERINARY DIAGNOSTIC LABORATORY
*Details on Business Overview, Products Offered, Recent Developments, and MnM View (Key strengths/Right to Win, Strategic Choices Made, and Weaknesses and Competitive Threats) might not be captured in case of unlisted companies.
13 APPENDIX (Page No. - 251)
13.1 DISCUSSION GUIDE
13.2 KNOWLEDGE STORE: MARKETSANDMARKETS’ SUBSCRIPTION PORTAL
13.3 AVAILABLE CUSTOMIZATIONS
13.4 RELATED REPORTS
13.5 AUTHOR DETAILS
This study involved the extensive use of both primary and secondary sources. The research process involved the study of various factors affecting the industry to identify the segmentation types, industry trends, key players, competitive landscape, key market dynamics, and key player strategies.
The secondary research process involves the widespread use of secondary sources, directories, databases (such as Bloomberg Business, Factiva, and D&B Hoovers), white papers, annual reports, companies house documents, investor presentations, and SEC filings of companies. Secondary research was used to identify and collect information useful for the extensive, technical, market-oriented, and commercial study of the veterinary reference laboratory market. It was also used to obtain important information about the key players and market classification & segmentation according to industry trends to the bottom-most level, and key developments related to market and technology perspectives. A database of the key industry leaders was also prepared using secondary research.
In the primary research process, various sources from both the supply and demand sides were interviewed to obtain qualitative and quantitative information for this report. The veterinary reference laboratory market comprises several stakeholders such as veterinary reference laboratory service manufacturers and distributors and regulatory organizations. The demand side of this market is characterized by Veterinary reference laboratory personnel, hospitals & clinics personnel, veterinarians, researchers and animal farms.
Various primary sources from both, the supply and demand sides of the market were interviewed to obtain qualitative and quantitative information.
Primary research was conducted to validate the market segmentation, identify key players in the market, and gather insights on key industry trends & key market dynamics.
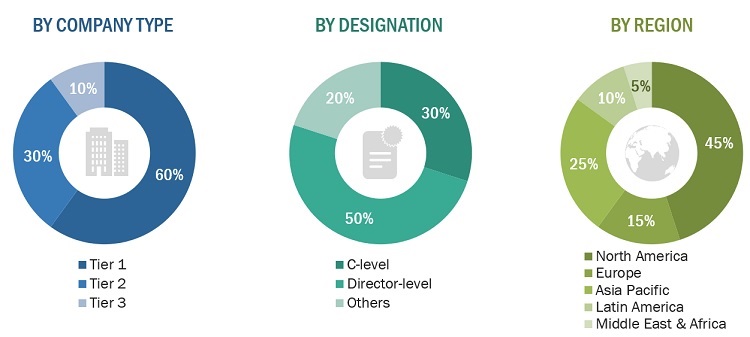
A breakdown of the primary respondents for veterinary reference laboratory market is provided below:
To know about the assumptions considered for the study, download the pdf brochure
The market size estimates and forecasts provided in this study are derived through a mix of the bottom-up approach (segmental analysis of major segments) and top-down approach (assessment of utilization/adoption/penetration trends, by service type, application, by animal type, and by region).
After arriving at the market size, the total veterinary reference laboratory market was divided into several segments. To complete the overall market engineering process and arrive at the exact statistics for all segments, data triangulation, and market breakdown procedures were employed, wherever applicable.
With the given market data, MarketsandMarkets offers customizations as per the company’s specific needs. The following customization options are available for the report:
Growth opportunities and latent adjacency in Veterinary Reference Laboratory Market