Companion Animal Diagnostics Market by Technology (Immunodiagnostic, Clinical Biochemistry, Molecular Diagnostics, Hematology), Application (Clinical Pathology, Bacteriology, Virology), Animal, End User (Diagnostics Labs, Clinics) & Region - Global Forecast to 2027
The global companion animal diagnostics market in terms of revenue was estimated to be worth $2.4 billion in 2022 and is poised to reach $3.8 billion by 2027, growing at a CAGR of 9.6% from 2022 to 2027. The new research study consists of an industry trend analysis of the market. The new research study consists of industry trends, pricing analysis, patent analysis, conference and webinar materials, key stakeholders, and buying behaviour in the market. The global market offers significant growth opportunities for market players. Market growth can largely be attributed to the increasing companion animal population, increasing incidence of transboundary and zoonotic diseases, rising demand for pet insurance, growing animal health expenditure, and rising number of veterinary practitioners and income levels in developed economies. On the other hand, increasing pet care costs are expected to restrain the growth of this market to a certain extent. The growing demand for rapid tests and portable instruments for point-of-care (POC) services alongside the use of advanced technologies, such as machine learning, in improving disease diagnosis offer growth opportunities for players in the companion animal diagnostics market. On the other hand, a lack of animal health awareness and a shortage of veterinarians in emerging markets pose significant challenges in the market.
To know about the assumptions considered for the study, Request for Free Sample Report
Companion Animal Diagnostics Market Dynamics:
DRIVER: Rising demand for pet insurance and growing animal health expenditure
Spending on pet healthcare, which includes the purchase of pet food, supplies/over-the-counter medications, veterinary care, pet insurance policies, and other services (such as companion animal diagnostic services), has increased significantly in recent years. A large number of pet owners, especially in major markets across North America and Europe, are purchasing pet insurance because of the significant growth in pet care expenditure in recent years.
The North American Pet Health Insurance Association (NAPHIA) reported that the pet health insurance sector in the US and Canada posted a combined gross premium of USD 1.99 billion in 2020, up from USD 1.56 billion in 2019, which is an increase of 27.5%. In North America, the total number of pets insured reached 3.45 million at the end of 2020 from 2.82 million in 2019. In the US, the total insurance paid for embedded wellness (includes diagnostics), accidents, and illnesses in dogs and cats was USD 1.855 billion in 2020.
RESTRAINT: Rising pet care costs
In the last ten years, pet care costs have increased significantly. According to the APPA 2020 report, veterinary care is the second-highest source of spending in the pet care community. The US, for example, spent over USD 31.4 billion on veterinary care and related products sales in 2020. This is expected to reach USD 32.3 billion in 2021. PetMD also reported that low-to-medium pet care costs had reached USD 250 to USD 4,500 in veterinary practices, with a high-end procedure priced anywhere between USD 5,000 and USD 20,000.
According to the APPA National Pet Owners Survey 2021–2022, the average household in the US spent USD 242 on routine vet visits for dogs (USD 212 in 2019) and USD 178 for cats in 2021-2022. (USD 160 in 2019). The average range of diagnostic revenue per clinical visit in the US was around USD 85?90 in 2020. This is mainly due to the availability of advanced monitoring, diagnostic, and therapeutic procedures in veterinary practices, which, though effective, come with high price tags. Advanced products and procedures play a significant role in treatments; however, the cost of materials and equipment used in these procedures is very high. For instance, diagnostic procedures for identifying sensitivity to antimicrobials, or the presence of infection using PCR or any other advanced technologies, are costlier than the actual treatment. Hence, pet owners and veterinarians are reluctant to invest so much for diagnostic purposes.
Although the pet insurance market is expanding, the number of animals covered for treatments is still very low. As a result, animal owners generally bear the majority of the cost of treatments. In addition, according to the Society for Practicing Veterinary Surgeons, along with the increasing pet insurance, the cost of veterinary treatment is rising by about 12% a year. The number of consultations with veterinary specialists for pet care is another factor responsible for the increasing pet healthcare costs. Furthermore, the lower income in this profession compared to other advanced-degree professions such as dentistry and law puts pressure on veterinary professionals to increase their fees. High pet care costs directly impact the number of visits by pet owners to veterinary facilities, thereby restraining the growth of this market.
OPPORTUNITY: Growing demand for rapid tests and portable instruments for point-of-care diagnostic services
In the past few years, portable diagnostic instruments for point-of-care (PoC) services have emerged as a critical component for diagnosing animal diseases. Major players in the companion animal diagnostics market focus on launching portable instruments for field veterinarians. Portable systems are used extensively in remote locations such as the patient’s home or shelter home, as well as during an emergency. The growing adoption of such instruments is mainly due to the rising demand among veterinarians to conduct on-field diagnosis and their ease of use in transferring data from one department to the other within large veterinary hospitals and academic & research institutes.
Rapid tests are also gaining popularity among end users, owing to advantages such as ease of use, specificity, reproducibility, and low cost. This has, correspondingly, driven companies to increase their focus on introducing rapid tests in the market that can deliver definitive results in less than 24 hours or even during the course of the initial examination of the animal. The growing demand for new technologies that can ensure rapid result generation and real-time convenience of diagnosis is expected to provide significant growth opportunities for players operating in this market.
CHALLENGE: Shortage of veterinary practitioners in developing countries
The global animal healthcare industry is marked by a shortage of skilled veterinarians and pathologists. This is particularly evident in the emerging markets across the Asia Pacific and Latin America, which show a huge gap in the demand and supply of veterinary professionals. According to the World Animal Health Information Database (2017), there were 180,821 veterinary professionals in India. The general norm is to have at least one veterinary doctor for every 5,000 animals. India requires at least 110,000–120,000 professionals. Similar shortages are observed in developing countries of Brazil and China. The shortage of veterinarians is expected to challenge the growth of the animal health industry, inclusive of the companion animal diagnostics market.
Currently, the lack of skilled veterinarians and diagnostic infrastructure, especially in developing countries, is one of the major factors limiting the uptake of advanced diagnostic solutions among veterinarians. The high cost of advanced diagnostic tests is another major barrier to its widespread adoption.
Clinical Biochemistry segment holds largest share in the companion animal diagnostics industry
The companion animal diagnostics market is segmented into clinical biochemistry, immunodiagnostics, hematology, urinalysis, molecular diagnostics, and other companion animal diagnostic technologies on the basis of technologies. The clinical biochemistry segment holds the largest share of of the market in 2021. Diseases and disorders evaluated using this technology can range from studying kidney function, diabetes, electrolyte & hormone evaluation, and liver function to evaluate systemic inflammation caused by infectious agents such as bacteria, viruses, and parasites. The clinical biochemistry market is segmented into clinical chemistry analysis, glucose monitoring, and blood gas electrolyte analysis.
Dog segment holds the largest share of by animal type of companion animal diagnostics industry
The companion animal diagnostics market is segmented into dogs, cats, horses, and other companion animals based on the animal type. Companion animal diagnostics for dogs holds the largest share of of this market. The large share and high growth in this segment is attributed to factors such as the increasing dog population and ownership rate, an increasing prevalence of zoonotic diseases, and increase in adoption of canine pet insurnace in the US.
The diagnostics laboratories holds the largest share of the companion animal diagnostics industry
The companion animal diagnostics market is segmented into diagnostic laboratories, veterinary hospitals & clinics, research institutes & universities,and home care settings based on the end user type. The diagnostic laboratories segment holds the largest share of of this market in 2021. The large share of this segment owing to a large number of samples received for analysis in these laboratories from small and large animal practices.
North America accounted for the largest share of the companion animal diagnostics industry
The companion animal diagnostics market is segmented into North America, Europe, Asia Pacific, Latin America, the Middle East, and Africa based on the region type. North America holds largest share of of the market in 2021. The large share of this segment can be attributed to the increasing animal population, growing pet insurance, and rising animal health expenditure in North America.
To know about the assumptions considered for the study, download the pdf brochure
Key players in this market are adopting several organic and inorganic growth strategies (such as product launches, agreements, collaborations, acquisitions, and expansions). Some major players in this market are Idexx Laboratories, INC. (US), Zoetis, INC. (US), Heska Corporation (US), Thermo Fisher Scientific, INC. (US), Biomérieux SA (France), Virbac (France), Neogen Corporation (US), Fujifilm Holdings Corporation (Japan), Indical Bioscience GmbH (Germany), Idvet (France), Randox Laboratories, LTD. (UK), Shenzhen Mindray Animal Medical Technology Co., Ltd. (China), and BioNote, Inc (South Korea).
Scope of the Companion Animal Diagnostics Industry:
Report Metric |
Details |
Market Revenue in 2022 |
$2.4 billion |
Estimated Value by 2027 |
$3.8 billion |
Revenue Rate |
Poised to grow at a CAGR of 9.6% |
Market Driver |
Rising demand for pet insurance and growing animal health expenditure |
Market Opportunity |
Growing demand for rapid tests and portable instruments for point-of-care diagnostic services |
The research report companion Animal Diagnostics Market to forecast revenue and analyze trends in each of the following submarkets:
By Technology
- Immunodiagnostics
- Clinical Biochemistry
- Hematology
- Urinalysis
- Molecular Diagnostics
- Other Companion Animal Diagnostics Technologies
By Application
- Clinical Pathology
- Bacteriology
- Virology
- Parasitology
- Other Applications
By Animal
- Dog
- Cat
- Horse
- Other Companion Animals
By End User
- Diagnostics Laboratories
- Veterinary Clinics and Hospitals
- Research Institute and Universities
- Home-care Settings
By Region
-
North America
- US
- Canada
-
Europe
- Germany
- France
- UK
- Italy
- Spain
- Benelux
- Rest of Europe
-
Asia Pacific
- Japan
- China
- India
- Australia
- Rest of APAC
-
Latin America
- Brazil
- Mexico
- Rest of LATAM
- Middle East
- Africa
Recent Developments Companion Animal Diagnostics Industry
- In December 2021, NEOGEN acquired Genetic Veterinary Sciences, Inc., which expanded the opportunities for the global genomics business of NEOGEN Corporation.
- In September 2021, Heska Corporation acquired Biotech Laboratories. This acquisition strengthened the company’s portfolio of Rapid Assay Point of Care Diagnostics.
- In January 2021, this acquisition strengthened the company’s portfolio of point-of-care digital cytology technology and telemedicine services.
Frequently Asked Questions (FAQ):
What is the projected market revenue value of the companion animal diagnostics market?
The companion animal diagnostics market boasts a total revenue value of $3.8 billion by 2027.
What is the estimated growth rate (CAGR) of the companion animal diagnostics market?
The global companion animal diagnostics market has an estimated compound annual growth rate (CAGR) of 9.6% and a revenue size in the region of $2.4 billion in 2022.
To speak to our analyst for a discussion on the above findings, click Speak to Analyst
TABLE OF CONTENTS
1 INTRODUCTION (Page No. - 49)
1.1 STUDY OBJECTIVES
1.2 MARKET DEFINITION
1.3 STUDY SCOPE
1.3.1 MARKETS COVERED – BY TYPE
1.3.2 MARKETS COVERED – BY REGION
1.3.3 YEARS CONSIDERED
1.4 CURRENCY
TABLE 1 STANDARD CURRENCY CONVERSION RATES
1.5 LIMITATIONS
1.6 STAKEHOLDERS
1.7 SUMMARY OF CHANGES
2 RESEARCH METHODOLOGY (Page No. - 55)
2.1 RESEARCH DATA
FIGURE 1 RESEARCH DESIGN
2.1.1 SECONDARY DATA
2.1.1.1 Key data from secondary sources
2.1.2 PRIMARY DATA
FIGURE 2 PRIMARY SOURCES
2.1.2.1 Key data from primary sources
2.1.2.2 Key industry insights
FIGURE 3 BREAKDOWN OF PRIMARY INTERVIEWS: SUPPLY SIDE AND DEMAND SIDE PARTICIPANTS
FIGURE 4 BREAKDOWN OF PRIMARY INTERVIEWS: SUPPLY SIDE PARTICIPANTS, BY COMPANY TYPE, DESIGNATION, AND REGION
FIGURE 5 BREAKDOWN OF PRIMARY INTERVIEWS: DEMAND SIDE PARTICIPANTS, BY END USER, DESIGNATION, AND REGION
2.2 MARKET SIZE ESTIMATION
FIGURE 6 REVENUE SHARE ANALYSIS ILLUSTRATION: IDEXX LABORATORIES, INC.
FIGURE 7 SUPPLY SIDE ANALYSIS OF TOP COMPANIES (2021)
FIGURE 8 CAGR PROJECTIONS OF DRIVERS, RESTRAINTS, OPPORTUNITIES, AND CHALLENGES OF MARKET (2022–2027)
FIGURE 9 TOP-DOWN APPROACH
2.3 MARKET BREAKDOWN & DATA TRIANGULATION
FIGURE 10 MARKET DATA TRIANGULATION METHODOLOGY
2.4 MARKET SHARE ESTIMATION
2.5 RESEARCH ASSUMPTIONS
2.6 RISK ASSESSMENT
TABLE 2 RISK ASSESSMENT: COMPANION ANIMAL DIAGNOSTICS MARKET
3 EXECUTIVE SUMMARY (Page No. - 68)
FIGURE 11 COMPANION ANIMAL DIAGNOSTICS MARKET, BY TECHNOLOGY, 2022 VS. 2027 (USD MILLION)
FIGURE 12 COMPANION ANIMAL DIAGNOSTICS MARKET, BY APPLICATION, 2022 VS. 2027 (USD MILLION)
FIGURE 13 COMPANION ANIMAL DIAGNOSTICS MARKET, BY ANIMAL TYPE, 2022 VS. 2027 (USD MILLION)
FIGURE 14 COMPANION ANIMAL DIAGNOSTICS MARKET, BY END USER, 2022 VS. 2027 (USD MILLION)
FIGURE 15 GEOGRAPHIC SNAPSHOT: COMPANION ANIMAL DIAGNOSTICS MARKET
4 PREMIUM INSIGHTS (Page No. - 73)
4.1 COMPANION ANIMAL DIAGNOSTICS MARKET OVERVIEW
FIGURE 16 GROWING COMPANION ANIMAL POPULATION TO DRIVE MARKET GROWTH
4.2 REGIONAL MIX: COMPANION ANIMAL DIAGNOSTICS MARKET
FIGURE 17 ASIA PACIFIC TO REGISTER CAGR OF 10.1% DURING FORECAST PERIOD
4.3 ASIA PACIFIC: MARKET, BY TECHNOLOGY AND COUNTRY (2021)
FIGURE 18 CHINA TO HOLD LARGEST SHARE OF ASIA PACIFIC MARKET IN 2021
4.4 MARKET: GEOGRAPHIC GROWTH OPPORTUNITIES
FIGURE 19 AUSTRALIA AND MEXICO TO GROW AT HIGHEST RATE DURING FORECAST PERIOD
4.5 MARKET: DEVELOPED VS. DEVELOPING MARKETS
FIGURE 20 DEVELOPING MARKETS TO REGISTER HIGHER GROWTH RATE
5 MARKET OVERVIEW (Page No. - 78)
5.1 INTRODUCTION
5.2 MARKET DYNAMICS
FIGURE 21 COMPANION ANIMAL DIAGNOSTICS MARKET: DRIVERS, RESTRAINTS, OPPORTUNITIES, AND CHALLENGES
5.2.1 DRIVERS
5.2.1.1 Increasing companion animal population
TABLE 3 PET POPULATION, BY ANIMAL, 2014–2020 (MILLION)
5.2.1.2 Rising demand for pet insurance and growing animal health expenditure
TABLE 4 AVERAGE PREMIUMS PAID IN US, 2019 VS. 2020
FIGURE 22 US: PET INDUSTRY EXPENDITURE, 2010–2020
TABLE 5 NORTH AMERICA: PET HEALTH INSURANCE MARKET (2012–2016) (USD MILLION)
5.2.1.3 Growing number of veterinary practitioners and their rising income levels in developed countries
TABLE 6 NUMBER OF VETERINARIANS AND PARAVETERINARIANS IN DEVELOPED COUNTRIES, 2012–2018
5.2.2 RESTRAINTS
5.2.2.1 Rising pet care costs
5.2.3 OPPORTUNITIES
5.2.3.1 Increased use of PCR testing panels to rule out COVID-19 virus in animals
5.2.3.2 Growing demand for rapid tests and portable instruments for point-of-care diagnostic services
5.2.3.3 Use of advanced technologies to improve disease diagnosis accuracy in companion animals
5.2.4 CHALLENGES
5.2.4.1 Shortage of veterinary practitioners in developing countries
TABLE 7 NUMBER OF VETERINARY PROFESSIONALS, BY COUNTRY, 2005 VS. 2014 VS. 2018
5.3 INDUSTRY TRENDS
5.3.1 ADOPTION OF MULTIPLE TESTING PANELS
TABLE 8 MULTIPLE TESTING PANELS VS. SINGLE TESTING PANELS
5.3.2 OUTSOURCING OF VETERINARY DIAGNOSTIC TESTING SERVICES
5.3.3 GROWING CONSOLIDATION IN COMPANION ANIMAL DIAGNOSTICS INDUSTRY
TABLE 9 MAJOR ACQUISITIONS IN COMPANION ANIMAL DIAGNOSTICS INDUSTRY
5.4 DISEASE TRENDS
5.4.1 ZOONOTIC DISEASES
TABLE 10 COMMON ZOONOTIC DISEASES SPREAD BY COMPANION ANIMALS GLOBALLY
5.4.2 OBESITY AND DIABETES
5.5 TECHNOLOGICAL ANALYSIS
5.5.1 KEY TECHNOLOGY
5.5.1.1 Development of portable instruments for POC diagnostic services
TABLE 11 PONT-OF-CARE PORTABLE VETERINARY DIAGNOSTIC INSTRUMENTS
5.5.2 ADJACENT TECHNOLOGY
5.5.2.1 Development of rapid and sensitive veterinary diagnostic kits
5.6 PRICING ANALYSIS
TABLE 12 REGIONAL PRICING ANALYSIS OF VETERINARY ANALYZERS, 2019 (USD)
5.7 IMPACT OF COVID-19 ON MARKET
TABLE 13 GLOBAL SNAPSHOT OF REPORTED CASES OF NATURALLY ACQUIRED SARS-COV-2 (COVID-19) INFECTIONS IN ANIMALS
FIGURE 23 MONTHLY VETERINARY PRACTICE ACTIVITY, BY REGION, JANUARY–JUNE 2020
5.8 TRENDS/DISRUPTIONS IMPACTING CUSTOMERS’ BUSINESSES (YC-YCC) IN MARKET
FIGURE 24 YC–YCC SHIFT IN MARKET
5.9 VALUE CHAIN ANALYSIS
FIGURE 25 MARKET: VALUE CHAIN ANALYSIS
5.10 ECOSYSTEM MARKET MAP
FIGURE 26 MARKET: ECOSYSTEM PARTICIPANTS
FIGURE 27 COMPANION ANIMAL DIAGNOSTICS MARKET: ECOSYSTEM MARKET MAP
5.11 PORTER’S FIVE FORCES ANALYSIS
TABLE 14 MARKET: PORTER’S FIVE FORCES ANALYSIS
5.11.1 THREAT OF NEW ENTRANTS
5.11.2 THREAT OF SUBSTITUTES
5.11.3 BARGAINING POWER OF SUPPLIERS
5.11.4 BARGAINING POWER OF BUYERS
5.11.5 INTENSITY OF COMPETITIVE RIVALRY
5.12 SUPPLY CHAIN ANALYSIS
FIGURE 28 MARKET: SUPPLY CHAIN ANALYSIS
5.13 REGULATORY ANALYSIS
5.13.1 US
5.13.2 EUROPE
5.14 PATENT ANALYSIS
5.14.1 PATENT PUBLICATION TRENDS FOR COMPANION ANIMAL DIAGNOSTICS
FIGURE 29 PATENT PUBLICATION TRENDS (2011–APRIL 2022)
5.14.2 INSIGHTS: JURISDICTION AND TOP APPLICANT ANALYSIS
FIGURE 30 TOP APPLICANTS & OWNERS (COMPANIES/INSTITUTIONS) FOR COMPANION ANIMAL DIAGNOSTICS DIAGNOSTIC PATENTS (JANUARY 2011–APRIL 2022)
FIGURE 31 TOP APPLICANT COUNTRIES/REGIONS FOR COMPANION ANIMAL DIAGNOSTICS PATENTS (JANUARY 2011–APRIL 2022)
5.15 KEY CONFERENCES & EVENTS DURING 2021-2023
TABLE 15 MARKET: DETAILED LIST OF CONFERENCES & EVENTS
5.16 KEY STAKEHOLDERS & BUYING CRITERIA
5.16.1 KEY STAKEHOLDERS IN BUYING PROCESS
FIGURE 32 INFLUENCE OF STAKEHOLDERS IN BUYING PROCESS FOR TOP 3 APPLICATIONS
TABLE 16 INFLUENCE OF STAKEHOLDERS IN BUYING PROCESS FOR TOP 3 APPLICATIONS
5.16.2 BUYING CRITERIA
FIGURE 33 KEY BUYING CRITERIA FOR TOP 3 APPLICATIONS
TABLE 17 KEY BUYING CRITERIA FOR TOP 3 APPLICATIONS
6 MARKET, BY TECHNOLOGY (Page No. - 107)
6.1 INTRODUCTION
TABLE 18 COMPANION ANIMAL DIAGNOSTICS MARKET, BY TECHNOLOGY, 2020–2027 (USD MILLION)
6.1.1 IMPACT OF COVID-19 ON TECHNOLOGY TYPE
6.2 CLINICAL BIOCHEMISTRY
TABLE 19 KEY VETERINARY CLINICAL BIOCHEMISTRY PRODUCTS AVAILABLE IN MARKET
TABLE 20 CLINICAL BIOCHEMISTRY MARKET, BY TYPE, 2020–2027 (USD MILLION)
TABLE 21 CLINICAL BIOCHEMISTRY MARKET, BY COUNTRY, 2020–2027 (USD MILLION)
6.2.1 CLINICAL CHEMISTRY ANALYSIS
TABLE 22 KEY CLINICAL CHEMISTRY ANALYSIS PRODUCTS AVAILABLE IN MARKET
TABLE 23 CLINICAL CHEMISTRY ANALYSIS MARKET, BY PRODUCT, 2020–2027 (USD MILLION)
TABLE 24 CLINICAL CHEMISTRY ANALYSIS MARKET, BY COUNTRY, 2020–2027 (USD MILLION)
6.2.1.1 Reagents, clips, and cartridges
6.2.1.1.1 Increasing pet healthcare expenditure and rising number of screening tests performed to drive market growth
TABLE 25 CLINICAL CHEMISTRY REAGENTS, CLIPS, AND CARTRIDGES MARKET, BY COUNTRY, 2020–2027 (USD MILLION)
6.2.1.2 Analyzers
6.2.1.2.1 Increasing installations of clinical chemistry analyzers to drive market growth
TABLE 26 CLINICAL CHEMISTRY ANALYZERS MARKET, BY COUNTRY, 2020–2027 (USD MILLION)
6.2.2 GLUCOSE MONITORING
TABLE 27 KEY GLUCOSE MONITORING PRODUCTS AVAILABLE IN MARKET
TABLE 28 GLUCOSE MONITORING MARKET, BY PRODUCT, 2020–2027 (USD MILLION)
TABLE 29 GLUCOSE MONITORING MARKET, BY COUNTRY, 2020–2027 (USD MILLION)
6.2.2.1 Blood glucose strips
6.2.2.1.1 Blood glucose strips to account for largest share of market in 2021
TABLE 30 BLOOD GLUCOSE STRIPS MARKET, BY COUNTRY, 2020–2027 (USD MILLION)
6.2.2.2 Glucose monitors
6.2.2.2.1 Use of glucose monitors to help in diagnostic and therapeutic decisions
TABLE 31 GLUCOSE MONITORS MARKET, BY COUNTRY, 2020–2027 (USD MILLION)
6.2.2.3 Urine glucose strips
6.2.2.3.1 Urine glucose strips to measure glucose and ketone concentration in urine
TABLE 32 LIST OF KEY URINE GLUCOSE STRIPS AVAILABLE IN MARKET
TABLE 33 URINE GLUCOSE STRIPS MARKET, BY COUNTRY, 2020–2027 (USD MILLION)
6.2.3 BLOOD GAS ELECTROLYTE ANALYSIS
TABLE 34 BLOOD GAS ELECTROLYTE ANALYSIS MARKET, BY PRODUCT, 2020–2027 (USD MILLION)
TABLE 35 BLOOD GAS ELECTROLYTE ANALYSIS MARKET, BY COUNTRY, 2020–2027 (USD MILLION)
6.2.3.1 Reagents, clips, and cartridges
6.2.3.1.1 Easy availability of animal species-specific preloaded reagent clips to support market growth
TABLE 36 BLOOD GAS & ELECTROLYTE REAGENT CLIPS & CARTRIDGES MARKET, BY COUNTRY, 2020–2027 (USD MILLION)
6.2.3.2 Blood gas & electrolyte analyzers
6.2.3.2.1 Blood gas and electrolyte analyzers to determine oxygen and carbon dioxide amounts in blood
TABLE 37 BLOOD GAS & ELECTROLYTE ANALYZERS MARKET, BY COUNTRY, 2020–2027 (USD MILLION)
6.3 IMMUNODIAGNOSTICS
TABLE 38 LIST OF KEY COMPANION ANIMAL IMMUNODIAGNOSTIC PRODUCTS AVAILABLE IN MARKET
TABLE 39 IMMUNODIAGNOSTICS MARKET, BY PRODUCT, 2020–2027 (USD MILLION)
TABLE 40 IMMUNODIAGNOSTICS MARKET, BY COUNTRY, 2020–2027 (USD MILLION)
6.3.1 LATERAL FLOW ASSAYS
TABLE 41 LATERAL FLOW ASSAYS MARKET, BY PRODUCT, 2020–2027 (USD MILLION)
TABLE 42 LATERAL FLOW ASSAYS MARKET, BY COUNTRY, 2020–2027 (USD MILLION)
6.3.1.1 Rapid tests
6.3.1.1.1 Rising prevalence of infectious diseases to drive lateral flow rapid tests adoption
TABLE 43 LATERAL FLOW KITS: ADVANTAGES & DISADVANTAGES
TABLE 44 KEY PLAYERS OFFERING LATERAL TEST KITS
TABLE 45 LATERAL FLOW RAPID TESTS MARKET, BY COUNTRY, 2020–2027 (USD MILLION)
6.3.1.2 Strip readers (Lateral flow readers)
6.3.1.2.1 Lateral flow readers to be adopted in in-house testing centers
TABLE 46 LATERAL FLOW STRIP READERS MARKET, BY COUNTRY, 2020–2027 (USD MILLION)
6.3.2 ELISA TESTS
6.3.2.1 Elisa kits to be adopted for viral disease testing in companion animals
TABLE 47 ELISA: ADVANTAGES & DISADVANTAGES
TABLE 48 KEY PLAYERS OFFERING ELISA KITS
TABLE 49 ELISA TESTS MARKET, BY COUNTRY, 2020–2027 (USD MILLION)
6.3.3 ALLERGEN-SPECIFIC IMMUNODIAGNOSTIC TESTS
6.3.3.1 Growing number of allergy cases in pets to drive market growth
TABLE 50 ALLERGEN-SPECIFIC IMMUNODIAGNOSTICS TEST KITS AVAILABLE
TABLE 51 ALLERGEN-SPECIFIC IMMUNODIAGNOSTIC TESTS MARKET, BY COUNTRY, 2020–2027 (USD MILLION)
6.3.4 IMMUNOASSAY ANALYZERS
6.3.4.1 Large number of samples can be loaded into immunoassay analyzers to determine immunoassay tests results
TABLE 52 KEY PLAYERS OFFERING IMMUNOASSAY ANALYZERS
TABLE 53 IMMUNOASSAY ANALYZERS MARKET, BY COUNTRY, 2020–2027 (USD MILLION)
6.3.5 OTHER IMMUNODIAGNOSTIC PRODUCTS
TABLE 54 KEY PLAYERS OFFERING IMMUNOASSAY REAGENTS & CONSUMABLES
TABLE 55 OTHER IMMUNODIAGNOSTIC PRODUCTS MARKET, BY COUNTRY, 2020–2027 (USD MILLION)
6.4 HEMATOLOGY
TABLE 56 KEY HEMATOLOGY PRODUCTS AVAILABLE
TABLE 57 HEMATOLOGY MARKET, BY PRODUCT, 2020–2027 (USD MILLION)
TABLE 58 HEMATOLOGY MARKET, BY COUNTRY, 2020–2027 (USD MILLION)
6.4.1 CARTRIDGES
6.4.1.1 Hematology cartridges to measure hematocrit and hemoglobin levels in animal blood samples
TABLE 59 HEMATOLOGY CARTRIDGES MARKET, BY COUNTRY, 2020–2027 (USD MILLION)
6.4.2 ANALYZERS
6.4.2.1 Hematology analyzers to measure blood cell count and coagulation time of blood
TABLE 60 HEMATOLOGY ANALYZERS MARKET, BY COUNTRY, 2020–2027 (USD MILLION)
6.5 URINALYSIS
TABLE 61 LIST OF KEY URINALYSIS PRODUCTS AVAILABLE
TABLE 62 URINALYSIS MARKET, BY PRODUCT, 2020–2027 (USD MILLION)
TABLE 63 URINALYSIS MARKET, BY COUNTRY, 2020–2027 (USD MILLION)
6.5.1 CLIPS & CARTRIDGES/PANELS
6.5.1.1 Clips and cartridges/panels to measure multiple electrolytes and metabolites kidney diseases and urinary tract infections detection
TABLE 64 URINALYSIS CLIPS & CARTRIDGES/PANELS MARKET, BY COUNTRY, 2020–2027 (USD MILLION)
6.5.2 URINE ANALYZERS
6.5.2.1 Technological advancements to support market growth
TABLE 65 URINE ANALYZERS MARKET, BY COUNTRY, 2020–2027 (USD MILLION)
6.5.3 URINE TEST STRIPS
6.5.3.1 Urine test strips to qualitatively evaluate urine parameters
TABLE 66 URINE TEST STRIPS MARKET, BY COUNTRY, 2020–2027 (USD MILLION)
6.6 MOLECULAR DIAGNOSTICS
TABLE 67 MOLECULAR DIAGNOSTICS MARKET, BY PRODUCT, 2020–2027 (USD MILLION)
TABLE 68 MOLECULAR DIAGNOSTICS MARKET, BY COUNTRY, 2020–2027 (USD MILLION)
6.6.1 POLYMERASE CHAIN REACTION TESTS
6.6.1.1 Increased laboratory usage of PCR in proteomics and genomics to support market growth
TABLE 69 LIST OF POLYMERASE CHAIN REACTION TESTS AVAILABLE
TABLE 70 PCR TESTS MARKET, BY COUNTRY, 2020–2027 (USD MILLION)
6.6.2 MICROARRAYS
6.6.2.1 Growing applications of biochips in infectious diseases identification to propel market growth
TABLE 71 LIST OF MICROARRAYS TESTS AVAILABLE
TABLE 72 MICROARRAYS MARKET, BY COUNTRY, 2020–2027 (USD MILLION)
6.6.3 OTHER MOLECULAR DIAGNOSTIC PRODUCTS
TABLE 73 OTHER MOLECULAR DIAGNOSTIC PRODUCTS MARKET, BY COUNTRY, 2020–2027 (USD MILLION)
6.7 OTHER COMPANION ANIMAL DIAGNOSTIC TECHNOLOGIES
TABLE 74 OTHER COMPANION ANIMAL DIAGNOSTIC TECHNOLOGIES MARKET, BY COUNTRY, 2020–2027 (USD MILLION)
7 MARKET, BY APPLICATION (Page No. - 154)
7.1 INTRODUCTION
TABLE 75 COMPANION ANIMAL DIAGNOSTICS MARKET, BY APPLICATION, 2020–2027 (USD MILLION)
7.2 CLINICAL PATHOLOGY
7.2.1 INCREASING PET HEALTH SCREENING AND DISEASE DIAGNOSIS TO MAKE CLINICAL PATHOLOGY LARGEST APPLICATION SEGMENT
TABLE 76 MARKET FOR CLINICAL PATHOLOGY, BY COUNTRY, 2020–2027 (USD MILLION)
7.3 BACTERIOLOGY
7.3.1 RISING PREVALENCE OF ZOONOTIC DISEASES TO DRIVE MARKET GROWTH
TABLE 77 MARKET FOR BACTERIOLOGY, BY COUNTRY, 2020–2027 (USD MILLION)
7.4 VIROLOGY
7.4.1 RISING NUMBER OF VIRAL OUTBREAKS TO SUPPORT MARKET GROWTH
TABLE 78 MARKET FOR VIROLOGY, BY COUNTRY, 2020–2027 (USD MILLION)
7.5 PARASITOLOGY
7.5.1 INCREASING PREVALENCE OF PARASITIC DISEASES TO SUPPORT MARKET GROWTH
TABLE 79 MARKET FOR PARASITOLOGY, BY COUNTRY, 2020–2027 (USD MILLION)
7.6 OTHER APPLICATIONS
TABLE 80 MARKET FOR OTHER APPLICATIONS, BY COUNTRY, 2020–2027 (USD MILLION)
8 MARKET, BY ANIMAL TYPE (Page No. - 161)
8.1 INTRODUCTION
TABLE 81 COMPANION ANIMAL DIAGNOSTICS MARKET, BY ANIMAL TYPE, 2020–2027 (USD MILLION)
8.2 DOGS
8.2.1 RISING PET DOG POPULATION TO DRIVE MARKET GROWTH
TABLE 82 DOG POPULATION, BY COUNTRY, 2018–2020 (MILLION)
TABLE 83 MARKET FOR DOGS, BY COUNTRY, 2020–2027 (USD MILLION)
8.3 CATS
8.3.1 GROWING RESEARCH INTO FELINE HEALTHCARE AND WELLBEING TO SUPPORT MARKET GROWTH
TABLE 84 CAT POPULATION, BY COUNTRY, 2018-2020 (MILLION)
TABLE 85 MARKET FOR CATS, BY COUNTRY, 2020–2027 (USD MILLION)
8.4 HORSES
8.4.1 GROWING AWARENESS ABOUT EQUINE HEALTH TO DRIVE MARKET GROWTH
TABLE 86 MARKET FOR HORSES, BY COUNTRY, 2020–2027 (USD MILLION)
8.5 OTHER COMPANION ANIMALS
TABLE 87 MARKET FOR OTHER ANIMALS, BY COUNTRY, 2020–2027 (USD MILLION)
9 MARKET, BY END USER (Page No. - 170)
9.1 INTRODUCTION
TABLE 88 COMPANION ANIMAL DIAGNOSTICS MARKET, BY END USER, 2020–2027 (USD MILLION)
9.2 DIAGNOSTIC LABORATORIES
9.2.1 DIAGNOSTIC LABORATORIES TO RECEIVE LARGE SAMPLE VOLUME FOR DIAGNOSIS
TABLE 89 MARKET FOR DIAGNOSTIC LABORATORIES, BY COUNTRY, 2020–2027 (USD MILLION)
9.3 VETERINARY HOSPITALS & CLINICS
9.3.1 VETERINARY HOSPITALS & CLINICS TO BE FIRST POINTS OF CONTACT FOR PET OWNERS
TABLE 90 BASIC ANNUAL EXPENSES FOR CATS AND DOGS IN THE US IN 2021-2022 (USD)
TABLE 91 MARKET FOR VETERINARY HOSPITALS & CLINICS, BY COUNTRY, 2020–2027 (USD MILLION)
9.4 RESEARCH INSTITUTES & UNIVERSITIES
9.4.1 INCREASING INDUSTRY-ACADEMIA COLLABORATIONS TO PROPEL MARKET GROWTH
TABLE 92 MARKET FOR RESEARCH INSTITUTES & UNIVERSITIES, BY COUNTRY, 2020–2027 (USD MILLION)
9.5 HOME-CARE SETTINGS
9.5.1 IMPROVED CARE AND COST CONTROL TO DRIVE POC DIAGNOSTICS ADOPTION IN HOME CARE SETTINGS
TABLE 93 MARKET FOR HOME-CARE SETTINGS, BY COUNTRY, 2020–2027 (USD MILLION)
10 MARKET, BY REGION (Page No. - 178)
10.1 INTRODUCTION
TABLE 94 COMPANION ANIMAL DIAGNOSTICS MARKET, BY REGION, 2020–2027 (USD MILLION)
10.2 NORTH AMERICA
FIGURE 34 NORTH AMERICA: MARKET SNAPSHOT
TABLE 95 NORTH AMERICA: MARKET, BY COUNTRY, 2020–2027 (USD MILLION)
TABLE 96 NORTH AMERICA: MARKET, BY TECHNOLOGY, 2020–2027 (USD MILLION)
TABLE 97 NORTH AMERICA: IMMUNODIAGNOSTICS MARKET, BY PRODUCT, 2020–2027 (USD MILLION)
TABLE 98 NORTH AMERICA: LATERAL FLOW ASSAY MARKET, BY PRODUCT, 2020–2027 (USD MILLION)
TABLE 99 NORTH AMERICA: CLINICAL BIOCHEMISTRY MARKET, BY TYPE, 2020–2027 (USD MILLION)
TABLE 100 NORTH AMERICA: CLINICAL CHEMISTRY ANALYSIS MARKET, BY PRODUCT, 2020–2027 (USD MILLION)
TABLE 101 NORTH AMERICA: GLUCOSE MONITORING MARKET, BY PRODUCT, 2020–2027 (USD MILLION)
TABLE 102 NORTH AMERICA: BLOOD GAS ELECTROLYTE ANALYSIS MARKET, BY PRODUCT, 2020–2027 (USD MILLION)
TABLE 103 NORTH AMERICA: HEMATOLOGY MARKET, BY PRODUCT, 2020–2027 (USD MILLION)
TABLE 104 NORTH AMERICA: URINALYSIS MARKET, BY PRODUCT, 2020–2027 (USD MILLION)
TABLE 105 NORTH AMERICA: MOLECULAR DIAGNOSTICS MARKET, BY PRODUCT, 2020–2027 (USD MILLION)
TABLE 106 NORTH AMERICA: MARKET, BY ANIMAL TYPE, 2020–2027 (USD MILLION)
TABLE 107 NORTH AMERICA: MARKET, BY APPLICATION, 2020–2027 (USD MILLION)
TABLE 108 NORTH AMERICA: MARKET, BY END USER, 2020–2027 (USD MILLION)
10.2.1 US
10.2.1.1 US to dominate MARKET in North America
TABLE 109 US: PRIVATE CLINICAL PRACTICES FOR COMPANION ANIMAL, 2016 VS. 2020
FIGURE 35 US: EXPENDITURE ON VET VISITS
TABLE 110 US: MARKET, BY TECHNOLOGY, 2020–2027 (USD MILLION)
TABLE 111 US: IMMUNODIAGNOSTICS MARKET, BY PRODUCT, 2020–2027 (USD MILLION)
TABLE 112 US: LATERAL FLOW ASSAYS MARKET, BY PRODUCT, 2020–2027 (USD MILLION)
TABLE 113 US: CLINICAL BIOCHEMISTRY MARKET, BY TYPE, 2020–2027 (USD MILLION)
TABLE 114 US: CLINICAL CHEMISTRY ANALYSIS MARKET, BY PRODUCT, 2020–2027 (USD MILLION)
TABLE 115 US: GLUCOSE MONITORING MARKET, BY PRODUCT, 2020–2027 (USD MILLION)
TABLE 116 US: BLOOD GAS ELECTROLYTE ANALYSIS MARKET, BY PRODUCT, 2020–2027 (USD MILLION)
TABLE 117 US: HEMATOLOGY MARKET, BY PRODUCT, 2020–2027 (USD MILLION)
TABLE 118 US: URINALYSIS MARKET, BY PRODUCT, 2020–2027 (USD MILLION)
TABLE 119 US: MOLECULAR DIAGNOSTICS MARKET, BY PRODUCT, 2020–2027 (USD MILLION)
TABLE 120 US: MARKET, BY ANIMAL TYPE, 2020–2027 (USD MILLION)
TABLE 121 US: MARKET, BY APPLICATION, 2020–2027 (USD MILLION)
TABLE 122 US: MARKET, BY END USER, 2020–2027 (USD MILLION)
10.2.2 CANADA
10.2.2.1 Awareness of pet health to propel market growth
TABLE 123 CANADA: MARKET, BY TECHNOLOGY, 2020–2027 (USD MILLION)
TABLE 124 CANADA: IMMUNODIAGNOSTICS MARKET, BY PRODUCT, 2020–2027 (USD MILLION)
TABLE 125 CANADA: LATERAL FLOW ASSAYS MARKET, BY PRODUCT, 2020–2027 (USD MILLION)
TABLE 126 CANADA: CLINICAL BIOCHEMISTRY MARKET, BY TYPE, 2020–2027 (USD MILLION)
TABLE 127 CANADA: CLINICAL CHEMISTRY ANALYSIS MARKET, BY PRODUCT, 2020–2027 (USD MILLION)
TABLE 128 CANADA: GLUCOSE MONITORING MARKET, BY PRODUCT, 2020–2027 (USD MILLION)
TABLE 129 CANADA: BLOOD GAS ELECTROLYTE ANALYSIS MARKET, BY PRODUCT, 2020–2027 (USD MILLION)
TABLE 130 CANADA: HEMATOLOGY MARKET, BY PRODUCT, 2020–2027 (USD MILLION)
TABLE 131 CANADA: URINALYSIS MARKET, BY PRODUCT, 2020–2027 (USD MILLION)
TABLE 132 CANADA: MOLECULAR DIAGNOSTICS MARKET, BY PRODUCT, 2020–2027 (USD MILLION)
TABLE 133 CANADA: MARKET, BY ANIMAL TYPE, 2020–2027 (USD MILLION)
TABLE 134 CANADA: MARKET, BY APPLICATION, 2020–2027 (USD MILLION)
TABLE 135 CANADA: MARKET, BY END USER, 2020–2027 (USD MILLION)
10.3 EUROPE
FIGURE 36 EUROPE: MARKET SNAPSHOT
TABLE 136 EUROPE: MARKET, BY COUNTRY, 2020–2027 (USD MILLION)
TABLE 137 EUROPE: MARKET, BY TECHNOLOGY, 2020–2027 (USD MILLION)
TABLE 138 EUROPE: IMMUNODIAGNOSTICS MARKET, BY PRODUCT, 2020–2027 (USD MILLION)
TABLE 139 EUROPE: LATERAL FLOW ASSAYS MARKET, BY PRODUCT, 2020–2027 (USD MILLION)
TABLE 140 EUROPE: CLINICAL BIOCHEMISTRY MARKET, BY TYPE, 2020–2027 (USD MILLION)
TABLE 141 EUROPE: CLINICAL CHEMISTRY ANALYSIS MARKET, BY PRODUCT, 2020–2027 (USD MILLION)
TABLE 142 EUROPE: GLUCOSE MONITORING MARKET, BY PRODUCT, 2020–2027 (USD MILLION)
TABLE 143 EUROPE: BLOOD GAS ELECTROLYTE ANALYSIS MARKET, BY PRODUCT, 2020–2027 (USD MILLION)
TABLE 144 EUROPE: HEMATOLOGY MARKET, BY PRODUCT, 2020–2027 (USD MILLION)
TABLE 145 EUROPE: URINALYSIS MARKET, BY PRODUCT, 2020–2027 (USD MILLION)
TABLE 146 EUROPE: MOLECULAR DIAGNOSTICS MARKET, BY PRODUCT, 2020–2027 (USD MILLION)
TABLE 147 EUROPE: MARKET, BY ANIMAL TYPE, 2020–2027 (USD MILLION)
TABLE 148 EUROPE: MARKET, BY APPLICATION, 2020–2027 (USD MILLION)
TABLE 149 EUROPE: MARKET, BY END USER, 2020–2027 (USD MILLION)
10.3.1 GERMANY
10.3.1.1 Germany to dominate European MARKET
TABLE 150 GERMANY: PET POPULATION (CATS AND DOGS), 2017 VS. 2020 (MILLION)
TABLE 151 GERMANY: MARKET, BY TECHNOLOGY, 2020–2027 (USD MILLION)
TABLE 152 GERMANY: IMMUNODIAGNOSTICS MARKET, BY PRODUCT, 2020–2027 (USD MILLION)
TABLE 153 GERMANY: LATERAL FLOW ASSAYS MARKET, BY PRODUCT, 2020–2027 (USD MILLION)
TABLE 154 GERMANY: CLINICAL BIOCHEMISTRY MARKET, BY TYPE, 2020–2027 (USD MILLION)
TABLE 155 GERMANY: CLINICAL CHEMISTRY ANALYSIS MARKET, BY PRODUCT, 2020–2027 (USD MILLION)
TABLE 156 GERMANY: GLUCOSE MONITORING MARKET, BY PRODUCT, 2020–2027 (USD MILLION)
TABLE 157 GERMANY: BLOOD GAS ELECTROLYTE ANALYSIS MARKET, BY PRODUCT, 2020–2027 (USD MILLION)
TABLE 158 GERMANY: HEMATOLOGY MARKET, BY PRODUCT, 2020–2027 (USD MILLION)
TABLE 159 GERMANY: URINALYSIS MARKET, BY PRODUCT, 2020–2027 (USD MILLION)
TABLE 160 GERMANY: MOLECULAR DIAGNOSTICS MARKET, BY PRODUCT, 2020–2027 (USD MILLION)
TABLE 161 GERMANY: MARKET, BY ANIMAL TYPE, 2020–2027 (USD MILLION)
TABLE 162 GERMANY: MARKET, BY APPLICATION, 2020–2027 (USD MILLION)
TABLE 163 GERMANY: MARKET, BY END USER, 2020–2027 (USD MILLION)
10.3.2 UK
10.3.2.1 Stable increase in pet ownership and preventive measures against animal diseases to drive market growth
TABLE 164 UK: PET POPULATION (CATS AND DOGS), 2017 TO 2020 (MILLION)
TABLE 165 UK: MARKET, BY TECHNOLOGY, 2020–2027 (USD MILLION)
TABLE 166 UK: IMMUNODIAGNOSTICS MARKET, BY PRODUCT, 2020–2027 (USD MILLION)
TABLE 167 UK: LATERAL FLOW ASSAYS MARKET, BY PRODUCT, 2020–2027 (USD MILLION)
TABLE 168 UK: CLINICAL BIOCHEMISTRY MARKET, BY TYPE, 2020–2027 (USD MILLION)
TABLE 169 UK: CLINICAL CHEMISTRY ANALYSIS MARKET, BY PRODUCT, 2020–2027 (USD MILLION)
TABLE 170 UK: GLUCOSE MONITORING MARKET, BY PRODUCT, 2020–2027 (USD MILLION)
TABLE 171 UK: BLOOD GAS ELECTROLYTE ANALYSIS MARKET, BY PRODUCT, 2020–2027 (USD MILLION)
TABLE 172 UK: HEMATOLOGY MARKET, BY PRODUCT, 2020–2027 (USD MILLION)
TABLE 173 UK: URINALYSIS MARKET, BY PRODUCT, 2020–2027 (USD MILLION)
TABLE 174 UK: MOLECULAR DIAGNOSTICS MARKET, BY PRODUCT, 2020–2027 (USD MILLION)
TABLE 175 UK: MARKET, BY ANIMAL TYPE, 2020–2027 (USD MILLION)
TABLE 176 UK: MARKET, BY APPLICATION, 2020–2027 (USD MILLION)
TABLE 177 UK: MARKET, BY END USER, 2020–2027 (USD MILLION)
10.3.3 FRANCE
10.3.3.1 Technological expertise and innovations to attract market players
TABLE 178 FRANCE: PET POPULATION (DOGS AND CATS), 2017 TO 2020 (MILLION)
TABLE 179 FRANCE: MARKET, BY TECHNOLOGY, 2020–2027 (USD MILLION)
TABLE 180 FRANCE: IMMUNODIAGNOSTICS MARKET, BY PRODUCT, 2020–2027 (USD MILLION)
TABLE 181 FRANCE: LATERAL FLOW ASSAYS MARKET, BY PRODUCT, 2020–2027 (USD MILLION)
TABLE 182 FRANCE: CLINICAL BIOCHEMISTRY MARKET, BY TYPE, 2020–2027 (USD MILLION)
TABLE 183 FRANCE: CLINICAL CHEMISTRY ANALYSIS MARKET, BY PRODUCT, 2020–2027 (USD MILLION)
TABLE 184 FRANCE: GLUCOSE MONITORING MARKET, BY PRODUCT, 2020–2027 (USD MILLION)
TABLE 185 FRANCE: BLOOD GAS ELECTROLYTE ANALYSIS MARKET, BY PRODUCT, 2020–2027 (USD MILLION)
TABLE 186 FRANCE: HEMATOLOGY MARKET, BY PRODUCT, 2020–2027 (USD MILLION)
TABLE 187 FRANCE: URINALYSIS MARKET, BY PRODUCT, 2020–2027 (USD MILLION)
TABLE 188 FRANCE: MOLECULAR DIAGNOSTICS MARKET, BY PRODUCT, 2020–2027 (USD MILLION)
TABLE 189 FRANCE: MARKET, BY ANIMAL TYPE, 2020–2027 (USD MILLION)
TABLE 190 FRANCE: MARKET, BY APPLICATION, 2020–2027 (USD MILLION)
TABLE 191 FRANCE: MARKET, BY END USER, 2020–2027 (USD MILLION)
10.3.4 ITALY
10.3.4.1 Increased pet adoption and better availability of pet products through large-scale outlets to support market growth
TABLE 192 ITALY: PET POPULATION (CATS AND DOGS), 2017 TO 2020 (MILLION)
TABLE 193 ITALY: MARKET, BY TECHNOLOGY, 2020–2027 (USD MILLION)
TABLE 194 ITALY: IMMUNODIAGNOSTICS MARKET, BY PRODUCT, 2020–2027 (USD MILLION)
TABLE 195 ITALY: LATERAL FLOW ASSAYS MARKET, BY PRODUCT, 2020–2027 (USD MILLION)
TABLE 196 ITALY: CLINICAL BIOCHEMISTRY MARKET, BY TYPE, 2020–2027 (USD MILLION)
TABLE 197 ITALY: CLINICAL CHEMISTRY ANALYSIS MARKET, BY PRODUCT, 2020–2027 (USD MILLION)
TABLE 198 ITALY: GLUCOSE MONITORING MARKET, BY PRODUCT, 2020–2027 (USD MILLION)
TABLE 199 ITALY: BLOOD GAS ELECTROLYTE ANALYSIS MARKET, BY PRODUCT, 2020–2027 (USD MILLION)
TABLE 200 ITALY: HEMATOLOGY MARKET, BY PRODUCT, 2020–2027 (USD MILLION)
TABLE 201 ITALY: URINALYSIS MARKET, BY PRODUCT, 2020–2027 (USD MILLION)
TABLE 202 ITALY: MOLECULAR DIAGNOSTICS MARKET, BY PRODUCT, 2020–2027 (USD MILLION)
TABLE 203 ITALY: MARKET, BY ANIMAL TYPE, 2020–2027 (USD MILLION)
TABLE 204 ITALY: MARKET, BY APPLICATION, 2020–2027 (USD MILLION)
TABLE 205 ITALY: MARKET, BY END USER, 2020–2027 (USD MILLION)
10.3.5 SPAIN
10.3.5.1 Rising animal health expenditure and growing number of veterinary facilities to drive market growth
TABLE 206 SPAIN: PET POPULATION (DOGS AND CATS), 2017 TO 2020 (MILLION)
TABLE 207 SPAIN: MARKET, BY TECHNOLOGY, 2020–2027 (USD MILLION)
TABLE 208 SPAIN: IMMUNODIAGNOSTICS MARKET, BY PRODUCT, 2020–2027 (USD MILLION)
TABLE 209 SPAIN: LATERAL FLOW ASSAYS MARKET, BY PRODUCT, 2020–2027 (USD MILLION)
TABLE 210 SPAIN: CLINICAL BIOCHEMISTRY MARKET, BY TYPE, 2020–2027 (USD MILLION)
TABLE 211 SPAIN: CLINICAL CHEMISTRY ANALYSIS MARKET, BY PRODUCT, 2020–2027 (USD MILLION)
TABLE 212 SPAIN: GLUCOSE MONITORING MARKET, BY PRODUCT, 2020–2027 (USD MILLION)
TABLE 213 SPAIN: BLOOD GAS ELECTROLYTE ANALYSIS MARKET, BY PRODUCT, 2020–2027 (USD MILLION)
TABLE 214 SPAIN: HEMATOLOGY MARKET, BY PRODUCT, 2020–2027 (USD MILLION)
TABLE 215 SPAIN: URINALYSIS MARKET, BY PRODUCT, 2020–2027 (USD MILLION)
TABLE 216 SPAIN: MOLECULAR DIAGNOSTICS MARKET, BY PRODUCT, 2020–2027 (USD MILLION)
TABLE 217 SPAIN: MARKET, BY ANIMAL TYPE, 2020–2027 (USD MILLION)
TABLE 218 SPAIN: MARKET, BY APPLICATION, 2020–2027 (USD MILLION)
TABLE 219 SPAIN: MARKET, BY END USER, 2020–2027 (USD MILLION)
10.3.6 BENELUX
10.3.6.1 Increasing pet population in Benelux to drive market growth
TABLE 220 BENELUX: MARKET, BY TECHNOLOGY, 2020–2027 (USD MILLION)
TABLE 221 BENELUX: IMMUNODIAGNOSTICS MARKET, BY PRODUCT, 2020–2027 (USD MILLION)
TABLE 222 BENELUX: LATERAL FLOW ASSAYS MARKET, BY PRODUCT, 2020–2027 (USD MILLION)
TABLE 223 BENELUX: CLINICAL BIOCHEMISTRY MARKET, BY TYPE, 2020–2027 (USD MILLION)
TABLE 224 BENELUX: CLINICAL CHEMISTRY ANALYSIS MARKET, BY PRODUCT, 2020–2027 (USD MILLION)
TABLE 225 BENELUX: GLUCOSE MONITORING MARKET, BY PRODUCT, 2020–2027 (USD MILLION)
TABLE 226 BENELUX: BLOOD GAS ELECTROLYTE ANALYSIS MARKET, BY PRODUCT, 2020–2027 (USD MILLION)
TABLE 227 BENELUX: HEMATOLOGY MARKET, BY PRODUCT, 2020–2027 (USD MILLION)
TABLE 228 BENELUX: URINALYSIS MARKET, BY PRODUCT, 2020–2027 (USD MILLION)
TABLE 229 BENELUX: MOLECULAR DIAGNOSTICS MARKET, BY PRODUCT, 2020–2027 (USD MILLION)
TABLE 230 BENELUX: MARKET, BY ANIMAL TYPE, 2020–2027 (USD MILLION)
TABLE 231 BENELUX: MARKET, BY APPLICATION, 2020–2027 (USD MILLION)
TABLE 232 BENELUX: MARKET, BY END USER, 2020–2027 (USD MILLION)
10.3.7 REST OF EUROPE
TABLE 233 ROE: MARKET, BY TECHNOLOGY, 2020–2027 (USD MILLION)
TABLE 234 ROE: IMMUNODIAGNOSTICS MARKET, BY PRODUCT, 2020–2027 (USD MILLION)
TABLE 235 ROE: LATERAL FLOW ASSAYS MARKET, BY PRODUCT, 2020–2027 (USD MILLION)
TABLE 236 ROE: CLINICAL BIOCHEMISTRY MARKET, BY TYPE, 2020–2027 (USD MILLION)
TABLE 237 ROE: CLINICAL CHEMISTRY ANALYSIS MARKET, BY PRODUCT, 2020–2027 (USD MILLION)
TABLE 238 ROE: GLUCOSE MONITORING MARKET, BY PRODUCT, 2020–2027 (USD MILLION)
TABLE 239 ROE: BLOOD GAS ELECTROLYTE ANALYSIS MARKET, BY PRODUCT, 2020–2027 (USD MILLION)
TABLE 240 ROE: HEMATOLOGY MARKET, BY PRODUCT, 2020–2027 (USD MILLION)
TABLE 241 ROE: URINALYSIS MARKET, BY PRODUCT, 2020–2027 (USD MILLION)
TABLE 242 ROE: MOLECULAR DIAGNOSTICS MARKET, BY PRODUCT, 2020–2027 (USD MILLION)
TABLE 243 ROE: MARKET, BY ANIMAL TYPE, 2020–2027 (USD MILLION)
TABLE 244 ROE: MARKET, BY APPLICATION, 2020–2027 (USD MILLION)
TABLE 245 ROE: MARKET, BY END USER, 2020–2027 (USD MILLION)
10.4 ASIA PACIFIC
FIGURE 37 ASIA PACIFIC: MARKET SNAPSHOT
TABLE 246 ASIA PACIFIC: MARKET, BY COUNTRY, 2020–2027 (USD MILLION)
TABLE 247 ASIA PACIFIC: MARKET, BY TECHNOLOGY, 2020–2027 (USD MILLION)
TABLE 248 ASIA PACIFIC: IMMUNODIAGNOSTICS MARKET, BY PRODUCT, 2020–2027 (USD MILLION)
TABLE 249 ASIA PACIFIC: LATERAL FLOW ASSAYS MARKET, BY PRODUCT, 2020–2027 (USD MILLION)
TABLE 250 ASIA PACIFIC: CLINICAL BIOCHEMISTRY MARKET, BY TYPE, 2020–2027 (USD MILLION)
TABLE 251 ASIA PACIFIC: CLINICAL CHEMISTRY ANALYSIS MARKET, BY PRODUCT, 2020–2027 (USD MILLION)
TABLE 252 ASIA PACIFIC: GLUCOSE MONITORING MARKET, BY PRODUCT, 2020–2027 (USD MILLION)
TABLE 253 ASIA PACIFIC: BLOOD GAS ELECTROLYTE ANALYSIS MARKET, BY PRODUCT, 2020–2027 (USD MILLION)
TABLE 254 ASIA PACIFIC: HEMATOLOGY MARKET, BY PRODUCT, 2020–2027 (USD MILLION)
TABLE 255 ASIA PACIFIC: URINALYSIS MARKET, BY PRODUCT, 2020–2027 (USD MILLION)
TABLE 256 ASIA PACIFIC: MOLECULAR DIAGNOSTICS MARKET, BY PRODUCT, 2020–2027 (USD MILLION)
TABLE 257 ASIA PACIFIC: MARKET, BY ANIMAL TYPE, 2020–2027 (USD MILLION)
TABLE 258 ASIA PACIFIC: MARKET, BY APPLICATION, 2020–2027 (USD MILLION)
TABLE 259 ASIA PACIFIC: MARKET, BY END USER, 2020–2027 (USD MILLION)
10.4.1 CHINA
10.4.1.1 China to dominate Asia Pacific MARKET
TABLE 260 CHINA: MARKET, BY TECHNOLOGY, 2020–2027 (USD MILLION)
TABLE 261 CHINA: IMMUNODIAGNOSTICS MARKET, BY PRODUCT, 2020–2027 (USD MILLION)
TABLE 262 CHINA: LATERAL FLOW ASSAYS MARKET, BY PRODUCT, 2020–2027 (USD MILLION)
TABLE 263 CHINA: CLINICAL BIOCHEMISTRY MARKET, BY TYPE, 2020–2027 (USD MILLION)
TABLE 264 CHINA: CLINICAL CHEMISTRY ANALYSIS MARKET, BY PRODUCT, 2020–2027 (USD MILLION)
TABLE 265 CHINA: GLUCOSE MONITORING MARKET, BY PRODUCT, 2020–2027 (USD MILLION)
TABLE 266 CHINA: BLOOD GAS ELECTROLYTE ANALYSIS MARKET, BY PRODUCT, 2020–2027 (USD MILLION)
TABLE 267 CHINA: HEMATOLOGY MARKET, BY PRODUCT, 2020–2027 (USD MILLION)
TABLE 268 CHINA: URINALYSIS MARKET, BY PRODUCT, 2020–2027 (USD MILLION)
TABLE 269 CHINA: MOLECULAR DIAGNOSTICS MARKET, BY PRODUCT, 2020–2027 (USD MILLION)
TABLE 270 CHINA: MARKET, BY ANIMAL TYPE, 2020–2027 (USD MILLION)
TABLE 271 CHINA: MARKET, BY APPLICATION, 2020–2027 (USD MILLION)
TABLE 272 CHINA: MARKET, BY END USER, 2020–2027 (USD MILLION)
10.4.2 JAPAN
10.4.2.1 Rising demand for imported pet breeds to drive market growth
TABLE 273 JAPAN: MARKET, BY TECHNOLOGY, 2020–2027 (USD MILLION)
TABLE 274 JAPAN: IMMUNODIAGNOSTICS MARKET, BY PRODUCT, 2020–2027 (USD MILLION)
TABLE 275 JAPAN: LATERAL FLOW ASSAYS MARKET, BY PRODUCT, 2020–2027 (USD MILLION)
TABLE 276 JAPAN: CLINICAL BIOCHEMISTRY MARKET, BY TYPE, 2020–2027 (USD MILLION)
TABLE 277 JAPAN: CLINICAL CHEMISTRY ANALYSIS MARKET, BY PRODUCT, 2020–2027 (USD MILLION)
TABLE 278 JAPAN: GLUCOSE MONITORING MARKET, BY PRODUCT, 2020–2027 (USD MILLION)
TABLE 279 JAPAN: BLOOD GAS ELECTROLYTE ANALYSIS MARKET, BY PRODUCT, 2020–2027 (USD MILLION)
TABLE 280 JAPAN: HEMATOLOGY MARKET, BY PRODUCT, 2020–2027 (USD MILLION)
TABLE 281 JAPAN: URINALYSIS MARKET, BY PRODUCT, 2020–2027 (USD MILLION)
TABLE 282 JAPAN: MOLECULAR DIAGNOSTICS MARKET, BY PRODUCT, 2020–2027 (USD MILLION)
TABLE 283 JAPAN: MARKET, BY ANIMAL TYPE, 2020–2027 (USD MILLION)
TABLE 284 JAPAN: MARKET, BY APPLICATION, 2020–2027 (USD MILLION)
TABLE 285 JAPAN: MARKET, BY END USER, 2020–2027 (USD MILLION)
10.4.3 INDIA
10.4.3.1 Untapped market with large growth potential in companion animal diagnostics to support segment growth
TABLE 286 INDIA: MARKET, BY TECHNOLOGY, 2020–2027 (USD MILLION)
TABLE 287 INDIA: IMMUNODIAGNOSTICS MARKET, BY PRODUCT, 2020–2027 (USD MILLION)
TABLE 288 INDIA: LATERAL FLOW ASSAYS MARKET, BY PRODUCT, 2020–2027 (USD MILLION)
TABLE 289 INDIA: CLINICAL BIOCHEMISTRY MARKET, BY TYPE, 2020–2027 (USD MILLION)
TABLE 290 INDIA: CLINICAL CHEMISTRY ANALYSIS MARKET, BY PRODUCT, 2020–2027 (USD MILLION)
TABLE 291 INDIA: GLUCOSE MONITORING MARKET, BY PRODUCT, 2020–2027 (USD MILLION)
TABLE 292 INDIA: BLOOD GAS ELECTROLYTE ANALYSIS MARKET, BY PRODUCT, 2020–2027 (USD MILLION)
TABLE 293 INDIA: HEMATOLOGY MARKET, BY PRODUCT, 2020–2027 (USD MILLION)
TABLE 294 INDIA: URINALYSIS MARKET, BY PRODUCT, 2020–2027 (USD MILLION)
TABLE 295 INDIA: MOLECULAR DIAGNOSTICS MARKET, BY PRODUCT, 2020–2027 (USD MILLION)
TABLE 296 INDIA: MARKET, BY ANIMAL TYPE, 2020–2027 (USD MILLION)
TABLE 297 INDIA: MARKET, BY APPLICATION, 2020–2027 (USD MILLION)
TABLE 298 INDIA: MARKET, BY END USER, 2020–2027 (USD MILLION)
10.4.4 AUSTRALIA
10.4.4.1 Rising pet insurance and pet health expenditure to drive market growth
TABLE 299 AUSTRALIA: MARKET, BY TECHNOLOGY, 2020–2027 (USD MILLION)
TABLE 300 AUSTRALIA: IMMUNODIAGNOSTICS MARKET, BY PRODUCT, 2020–2027 (USD MILLION)
TABLE 301 AUSTRALIA: LATERAL FLOW ASSAYS MARKET, BY PRODUCT, 2020–2027 (USD MILLION)
TABLE 302 AUSTRALIA: CLINICAL BIOCHEMISTRY MARKET, BY TYPE, 2020–2027 (USD MILLION)
TABLE 303 AUSTRALIA: CLINICAL CHEMISTRY ANALYSIS MARKET, BY PRODUCT, 2020–2027 (USD MILLION)
TABLE 304 AUSTRALIA: GLUCOSE MONITORING MARKET, BY PRODUCT, 2020–2027 (USD MILLION)
TABLE 305 AUSTRALIA: BLOOD GAS ELECTROLYTE ANALYSIS MARKET, BY PRODUCT, 2020–2027 (USD MILLION)
TABLE 306 AUSTRALIA: HEMATOLOGY MARKET, BY PRODUCT, 2020–2027 (USD MILLION)
TABLE 307 AUSTRALIA: URINALYSIS MARKET, BY PRODUCT, 2020–2027 (USD MILLION)
TABLE 308 AUSTRALIA: MOLECULAR DIAGNOSTICS MARKET, BY PRODUCT, 2020–2027 (USD MILLION)
TABLE 309 AUSTRALIA: MARKET, BY ANIMAL TYPE, 2020–2027 (USD MILLION)
TABLE 310 AUSTRALIA: MARKET, BY APPLICATION, 2020–2027 (USD MILLION)
TABLE 311 AUSTRALIA: MARKET, BY END USER, 2020–2027 (USD MILLION)
10.4.5 REST OF ASIA PACIFIC
TABLE 312 REST OF ASIA PACIFIC: MARKET, BY TECHNOLOGY, 2020–2027 (USD MILLION)
TABLE 313 REST OF ASIA PACIFIC: IMMUNODIAGNOSTICS MARKET, BY PRODUCT, 2020–2027 (USD MILLION)
TABLE 314 REST OF ASIA PACIFIC: LATERAL FLOW ASSAYS MARKET, BY PRODUCT, 2020–2027 (USD MILLION)
TABLE 315 REST OF ASIA PACIFIC: CLINICAL BIOCHEMISTRY MARKET, BY TYPE, 2020–2027 (USD MILLION)
TABLE 316 REST OF ASIA PACIFIC: CLINICAL CHEMISTRY ANALYSIS MARKET, BY PRODUCT, 2020–2027 (USD MILLION)
TABLE 317 REST OF ASIA PACIFIC: GLUCOSE MONITORING MARKET, BY PRODUCT, 2020–2027 (USD MILLION)
TABLE 318 REST OF ASIA PACIFIC: BLOOD GAS ELECTROLYTE ANALYSIS MARKET, BY PRODUCT, 2020–2027 (USD MILLION)
TABLE 319 REST OF ASIA PACIFIC: HEMATOLOGY MARKET, BY PRODUCT, 2020–2027 (USD MILLION)
TABLE 320 REST OF ASIA PACIFIC: URINALYSIS MARKET, BY PRODUCT, 2020–2027 (USD MILLION)
TABLE 321 REST OF ASIA PACIFIC: MOLECULAR DIAGNOSTICS MARKET, BY PRODUCT, 2020–2027 (USD MILLION)
TABLE 322 REST OF ASIA PACIFIC: MARKET, BY ANIMAL TYPE, 2020–2027 (USD MILLION)
TABLE 323 REST OF ASIA PACIFIC: MARKET, BY APPLICATION, 2020–2027 (USD MILLION)
TABLE 324 REST OF ASIA PACIFIC: MARKET, BY END USER, 2020–2027 (USD MILLION)
10.5 LATIN AMERICA
TABLE 325 LATIN AMERICA: MARKET, BY COUNTRY, 2020–2027 (USD MILLION)
TABLE 326 LATIN AMERICA: MARKET, BY TECHNOLOGY, 2020–2027 (USD MILLION)
TABLE 327 LATIN AMERICA: IMMUNODIAGNOSTICS MARKET, BY PRODUCT, 2020–2027 (USD MILLION)
TABLE 328 LATIN AMERICA: LATERAL FLOW ASSAYS MARKET, BY PRODUCT, 2020–2027 (USD MILLION)
TABLE 329 LATIN AMERICA: CLINICAL BIOCHEMISTRY MARKET, BY TYPE, 2020–2027 (USD MILLION)
TABLE 330 LATIN AMERICA: CLINICAL CHEMISTRY ANALYSIS MARKET, BY PRODUCT, 2020–2027 (USD MILLION)
TABLE 331 LATIN AMERICA: GLUCOSE MONITORING MARKET, BY PRODUCT, 2020–2027 (USD MILLION)
TABLE 332 LATIN AMERICA: BLOOD GAS ELECTROLYTE ANALYSIS MARKET, BY PRODUCT, 2020–2027 (USD MILLION)
TABLE 333 LATIN AMERICA: HEMATOLOGY MARKET, BY PRODUCT, 2020–2027 (USD MILLION)
TABLE 334 LATIN AMERICA: URINALYSIS MARKET, BY PRODUCT, 2020–2027 (USD MILLION)
TABLE 335 LATIN AMERICA: MOLECULAR DIAGNOSTICS MARKET, BY PRODUCT, 2020–2027 (USD MILLION)
TABLE 336 LATIN AMERICA: MARKET, BY ANIMAL TYPE, 2020–2027 (USD MILLION)
TABLE 337 LATIN AMERICA MARKET, BY APPLICATION, 2020–2027 (USD MILLION)
TABLE 338 LATIN AMERICA: MARKET, BY END USER, 2020–2027 (USD MILLION)
10.5.1 BRAZIL
10.5.1.1 Brazil to possess third-largest pet population globally
TABLE 339 BRAZIL: MARKET, BY TECHNOLOGY, 2020–2027 (USD MILLION)
TABLE 340 BRAZIL: IMMUNODIAGNOSTICS MARKET, BY PRODUCT, 2020–2027 (USD MILLION)
TABLE 341 BRAZIL: LATERAL FLOW ASSAYS MARKET, BY PRODUCT, 2020–2027 (USD MILLION)
TABLE 342 BRAZIL: CLINICAL BIOCHEMISTRY MARKET, BY TYPE, 2020–2027 (USD MILLION)
TABLE 343 BRAZIL: CLINICAL CHEMISTRY ANALYSIS MARKET, BY PRODUCT, 2020–2027 (USD MILLION)
TABLE 344 BRAZIL: GLUCOSE MONITORING MARKET, BY PRODUCT, 2020–2027 (USD MILLION)
TABLE 345 BRAZIL: BLOOD GAS ELECTROLYTE ANALYSIS MARKET, BY PRODUCT, 2020–2027 (USD MILLION)
TABLE 346 BRAZIL: HEMATOLOGY MARKET, BY PRODUCT, 2020–2027 (USD MILLION)
TABLE 347 BRAZIL: URINALYSIS MARKET, BY PRODUCT, 2020–2027 (USD MILLION)
TABLE 348 BRAZIL: MOLECULAR DIAGNOSTICS MARKET, BY PRODUCT, 2020–2027 (USD MILLION)
TABLE 349 BRAZIL: MARKET, BY ANIMAL TYPE, 2020–2027 (USD MILLION)
TABLE 350 BRAZIL: MARKET, BY APPLICATION, 2020–2027 (USD MILLION)
TABLE 351 BRAZIL: MARKET, BY END USER, 2020–2027 (USD MILLION)
10.5.2 MEXICO
10.5.2.1 Mexico to hold second-highest position in Latin American pet care market
TABLE 352 MEXICO: MARKET, BY TECHNOLOGY, 2020–2027 (USD MILLION)
TABLE 353 MEXICO: IMMUNODIAGNOSTICS MARKET, BY PRODUCT, 2020–2027 (USD MILLION)
TABLE 354 MEXICO: LATERAL FLOW ASSAYS MARKET, BY PRODUCT, 2020–2027 (USD MILLION)
TABLE 355 MEXICO: CLINICAL BIOCHEMISTRY MARKET, BY TYPE, 2020–2027 (USD MILLION)
TABLE 356 MEXICO: CLINICAL CHEMISTRY ANALYSIS MARKET, BY PRODUCT, 2020–2027 (USD MILLION)
TABLE 357 MEXICO: GLUCOSE MONITORING MARKET, BY PRODUCT, 2020–2027 (USD MILLION)
TABLE 358 MEXICO: BLOOD GAS ELECTROLYTE ANALYSIS MARKET, BY PRODUCT, 2020–2027 (USD MILLION)
TABLE 359 MEXICO: HEMATOLOGY MARKET, BY PRODUCT, 2020–2027 (USD MILLION)
TABLE 360 MEXICO: URINALYSIS MARKET, BY PRODUCT, 2020–2027 (USD MILLION)
TABLE 361 MEXICO: MOLECULAR DIAGNOSTICS MARKET, BY PRODUCT, 2020–2027 (USD MILLION)
TABLE 362 MEXICO: MARKET, BY ANIMAL TYPE, 2020–2027 (USD MILLION)
TABLE 363 MEXICO: MARKET, BY APPLICATION, 2020–2027 (USD MILLION)
TABLE 364 MEXICO: MARKET, BY END USER, 2020–2027 (USD MILLION)
10.5.3 REST OF LATIN AMERICA
TABLE 365 REST OF LATIN AMERICA: MARKET, BY TECHNOLOGY, 2020–2027 (USD MILLION)
TABLE 366 REST OF LATIN AMERICA: IMMUNODIAGNOSTICS MARKET, BY PRODUCT, 2020–2027 (USD MILLION)
TABLE 367 REST OF LATIN AMERICA: LATERAL FLOW ASSAYS MARKET, BY PRODUCT, 2020–2027 (USD MILLION)
TABLE 368 REST OF LATIN AMERICA: CLINICAL BIOCHEMISTRY MARKET, BY TYPE, 2020–2027 (USD MILLION)
TABLE 369 REST OF LATIN AMERICA: CLINICAL CHEMISTRY ANALYSIS MARKET, BY PRODUCT, 2020–2027 (USD MILLION)
TABLE 370 REST OF LATIN AMERICA: GLUCOSE MONITORING MARKET, BY PRODUCT, 2020–2027 (USD MILLION)
TABLE 371 REST OF LATIN AMERICA: BLOOD GAS ELECTROLYTE ANALYSIS MARKET, BY PRODUCT, 2020–2027 (USD MILLION)
TABLE 372 REST OF LATIN AMERICA: HEMATOLOGY MARKET, BY PRODUCT, 2020–2027 (USD MILLION)
TABLE 373 REST OF LATIN AMERICA: URINALYSIS MARKET, BY PRODUCT, 2020–2027 (USD MILLION)
TABLE 374 REST OF LATIN AMERICA: MOLECULAR DIAGNOSTICS MARKET, BY PRODUCT, 2020–2027 (USD MILLION)
TABLE 375 REST OF LATIN AMERICA: MARKET, BY ANIMAL TYPE, 2020–2027 (USD MILLION)
TABLE 376 REST OF LATIN AMERICA: MARKET, BY APPLICATION, 2020–2027 (USD MILLION)
TABLE 377 REST OF LATIN AMERICA: MARKET, BY END USER, 2020–2027 (USD MILLION)
10.6 MIDDLE EAST
10.6.1 RELUCTANCE TO SPEND ON PET HEALTH TO HINDER MARKET GROWTH
TABLE 378 MIDDLE EAST: MARKET, BY TECHNOLOGY, 2020–2027 (USD MILLION)
TABLE 379 MIDDLE EAST: IMMUNODIAGNOSTICS MARKET, BY PRODUCT, 2020–2027 (USD MILLION)
TABLE 380 MIDDLE EAST: LATERAL FLOW ASSAYS MARKET, BY PRODUCT, 2020–2027 (USD MILLION)
TABLE 381 MIDDLE EAST: CLINICAL BIOCHEMISTRY MARKET, BY TYPE, 2020–2027 (USD MILLION)
TABLE 382 MIDDLE EAST: CLINICAL CHEMISTRY ANALYSIS MARKET, BY PRODUCT, 2020–2027 (USD MILLION)
TABLE 383 MIDDLE EAST: GLUCOSE MONITORING MARKET, BY PRODUCT, 2020–2027 (USD MILLION)
TABLE 384 MIDDLE EAST: BLOOD GAS ELECTROLYTE ANALYSIS MARKET, BY PRODUCT, 2020–2027 (USD MILLION)
TABLE 385 MIDDLE EAST: HEMATOLOGY MARKET, BY PRODUCT, 2020–2027 (USD MILLION)
TABLE 386 MIDDLE EAST: URINALYSIS MARKET, BY PRODUCT, 2020–2027 (USD MILLION)
TABLE 387 MIDDLE EAST: MOLECULAR DIAGNOSTICS MARKET, BY PRODUCT, 2020–2027 (USD MILLION)
TABLE 388 MIDDLE EAST: MARKET, BY ANIMAL TYPE, 2020–2027 (USD MILLION)
TABLE 389 MIDDLE EAST: MARKET, BY APPLICATION, 2020–2027 (USD MILLION)
TABLE 390 MIDDLE EAST: MARKET, BY END USER, 2020–2027 (USD MILLION)
10.7 AFRICA
10.7.1 DISEASES IN IMPORTED BREEDS TO DRIVE MARKET GROWTH
TABLE 391 AFRICA: MARKET, BY TECHNOLOGY, 2020–2027 (USD MILLION)
TABLE 392 AFRICA: IMMUNODIAGNOSTICS MARKET, BY PRODUCT, 2020–2027 (USD MILLION)
TABLE 393 AFRICA: LATERAL FLOW ASSAYS MARKET, BY PRODUCT, 2020–2027 (USD MILLION)
TABLE 394 AFRICA: CLINICAL BIOCHEMISTRY MARKET, BY TYPE, 2020–2027 (USD MILLION)
TABLE 395 AFRICA: CLINICAL CHEMISTRY ANALYSIS MARKET, BY PRODUCT, 2020–2027 (USD MILLION)
TABLE 396 AFRICA: GLUCOSE MONITORING MARKET, BY PRODUCT, 2020–2027 (USD MILLION)
TABLE 397 AFRICA: BLOOD GAS ELECTROLYTE ANALYSIS MARKET, BY PRODUCT, 2020–2027 (USD MILLION)
TABLE 398 AFRICA: HEMATOLOGY MARKET, BY PRODUCT, 2020–2027 (USD MILLION)
TABLE 399 AFRICA: URINALYSIS MARKET, BY PRODUCT, 2020–2027 (USD MILLION)
TABLE 400 AFRICA: MOLECULAR DIAGNOSTICS MARKET, BY PRODUCT, 2020–2027 (USD MILLION)
TABLE 401 AFRICA: MARKET, BY ANIMAL TYPE, 2020–2027 (USD MILLION)
TABLE 402 AFRICA: MARKET, BY APPLICATION, 2020–2027 (USD MILLION)
TABLE 403 AFRICA: MARKET, BY END USER, 2020–2027 (USD MILLION)
11 COMPETITIVE LANDSCAPE (Page No. - 311)
11.1 OVERVIEW
11.2 KEY PLAYER STRATEGIES
11.3 REVENUE SHARE ANALYSIS OF TOP MARKET PLAYERS
FIGURE 38 REVENUE ANALYSIS OF TOP PLAYERS IN MARKET
11.4 COMPANION ANIMAL DIAGNOSTICS MARKET SHARE ANALYSIS
FIGURE 39 MARKET SHARE ANALYSIS, BY KEY PLAYER, 2021
11.5 COMPANY EVALUATION QUADRANT
11.5.1 STARS
11.5.2 EMERGING LEADERS
11.5.3 PERVASIVE PLAYERS
11.5.4 PARTICIPANTS
FIGURE 40 COMPANION ANIMAL DIAGNOSTICS MARKET: COMPANY EVALUATION QUADRANT (2021)
11.6 COMPANY EVALUATION QUADRANT FOR STARTUPS
11.6.1 PROGRESSIVE COMPANIES
11.6.2 DYNAMIC COMPANIES
11.6.3 STARTING BLOCKS
11.6.4 RESPONSIVE COMPANIES
FIGURE 41 MARKET: COMPANY EVALUATION QUADRANT FOR STARTUPS (2021)
11.7 COMPANY PRODUCT FOOTPRINT
TABLE 404 TECHNOLOGY FOOTPRINT OF MAJOR PLAYERS
TABLE 405 ANIMAL TYPE FOOTPRINT OF MAJOR PLAYERS
TABLE 406 END USER FOOTPRINT OF MAJOR PLAYERS
TABLE 407 GEOGRAPHIC FOOTPRINT OF MAJOR PLAYERS
11.8 COMPETITIVE SCENARIO
11.8.1 DEALS
TABLE 408 KEY DEALS, JANUARY 2019 TO MARCH 2022
11.8.2 PRODUCT LAUNCHES
11.8.3 OTHER DEVELOPMENTS
12 COMPANY PROFILES (Page No. - 327)
12.1 KEY PLAYERS
(Business Overview, Products/Services/Solutions Offered, MnM View, Key Strengths and Right to Win, Strategic Choices Made, Weaknesses and Competitive Threats, Recent Developments)*
12.1.1 IDEXX LABORATORIES, INC.
TABLE 409 IDEXX LABORATORIES, INC.: BUSINESS OVERVIEW
FIGURE 42 IDEXX LABORATORIES, INC.: COMPANY SNAPSHOT
12.1.2 ZOETIS INC.
TABLE 410 ZOETIS, INC.: BUSINESS OVERVIEW
FIGURE 43 ZOETIS, INC.: COMPANY SNAPSHOT
12.1.3 HESKA CORPORATION
TABLE 411 HESKA CORPORATION: BUSINESS OVERVIEW
FIGURE 44 HESKA CORPORATION: COMPANY SNAPSHOT
12.1.4 THERMO FISHER SCIENTIFIC INC.
TABLE 412 THERMO FISHER SCIENTIFIC INC.: BUSINESS OVERVIEW
FIGURE 45 THERMO FISHER SCIENTIFIC INC.: COMPANY SNAPSHOT
12.1.5 BIOMÉRIEUX SA
TABLE 413 BIOMÉRIEUX SA: BUSINESS OVERVIEW
FIGURE 46 BIOMÉRIEUX SA: COMPANY SNAPSHOT
12.1.6 VIRBAC
TABLE 414 VIRBAC: BUSINESS OVERVIEW
FIGURE 47 VIRBAC: COMPANY SNAPSHOT
12.1.7 NEOGEN CORPORATION
TABLE 415 NEOGEN CORPORATION: BUSINESS OVERVIEW
FIGURE 48 NEOGEN CORPORATION: COMPANY SNAPSHOT
12.1.8 FUJIFILM HOLDINGS CORPORATION
TABLE 416 FUJIFILM HOLDINGS CORPORATION: BUSINESS OVERVIEW
FIGURE 49 FUJIFILM HOLDINGS CORPORATION: COMPANY SNAPSHOT
12.1.9 INDICAL BIOSCIENCE GMBH
TABLE 417 INDICAL BIOSCIENCE GMBH: BUSINESS OVERVIEW
12.1.10 IDVET
TABLE 418 IDVET: BUSINESS OVERVIEW
12.1.11 RANDOX LABORATORIES, LTD.
TABLE 419 RANDOX LABORATORIES, LTD.: BUSINESS OVERVIEW
12.1.12 SHENZHEN MINDRAY ANIMAL MEDICAL TECHNOLOGY CO., LTD.
TABLE 420 SHENZHEN MINDRAY ANIMAL MEDICAL TECHNOLOGY CO., LTD.: BUSINESS OVERVIEW
12.1.13 BIONOTE, INC.
TABLE 421 BIONOTE, INC.: BUSINESS OVERVIEW
12.2 OTHER PLAYERS
12.2.1 SKYLA CORPORATION
TABLE 422 SKYLA CORPORATION: BUSINESS OVERVIEW
12.2.2 EUROIMMUN MEDIZINISCHE LABORDIAGNOSTIKA AG
TABLE 423 EUROIMMUN MEDIZINISCHE LABORDIAGNOSTIKA AG.: BUSINESS OVERVIEW
12.2.3 URIT MEDICAL ELECTRONIC CO., LTD.
TABLE 424 URIT MEDICAL ELECTRONICS CO., LTD.: BUSINESS OVERVIEW
12.2.4 EUROLYSER DIAGNOSTICA GMBH
TABLE 425 EUROLYSER DIAGNOSTICA GMBH: BUSINESS OVERVIEW
12.2.5 NOVA BIOMEDICAL
TABLE 426 NOVA BIOMEDICAL: BUSINESS OVERVIEW
12.2.6 FASSISI GMBH
TABLE 427 FASSISI GMBH: BUSINESS OVERVIEW
12.2.7 SWISSAVANS AG
TABLE 428 SWISSAVANS AG: BUSINESS OVERVIEW
12.2.8 ALVEDIA
TABLE 429 ALVEDIA: BUSINESS OVERVIEW
12.2.9 MEGACOR VETERINARY DIAGNOSTICS
TABLE 430 MEGACOR VETERINARY DIAGNOSTICS: BUSINESS OVERVIEW
12.2.10 BIOPANDA REAGENTS LTD
TABLE 431 BIOPANDA REAGENTS LTD: BUSINESS OVERVIEW
12.2.11 ANIPOC LTD
TABLE 432 ANIPOC LTD: BUSINESS OVERVIEW
12.2.12 RING BIOTECHNOLOGY CO LTD.
TABLE 433 RING BIOTECHNOLOGY CO LTD.: BUSINESS OVERVIEW
*Business Overview, Products/Services/Solutions Offered, MnM View, Key Strengths and Right to Win, Strategic Choices Made, Weaknesses and Competitive Threats, Recent Developments might not be captured in case of unlisted companies.
13 APPENDIX (Page No. - 382)
13.1 DISCUSSION GUIDE
13.2 KNOWLEDGE STORE: MARKETSANDMARKETS’ SUBSCRIPTION PORTAL
13.3 AVAILABLE CUSTOMIZATIONS
13.4 RELATED REPORTS
13.5 AUTHOR DETAILS
The report presents a detailed assessment of the companion animal diagnostics market, along with qualitative inputs and insights from MarketsandMarkets. This research study involved the extensive use of both primary and secondary sources. Various factors affecting the industry were studied to identify segmentation types; industry trends; key players; the competitive landscape of the market; and key market dynamics (such as drivers, restraints, opportunities, and challenges)
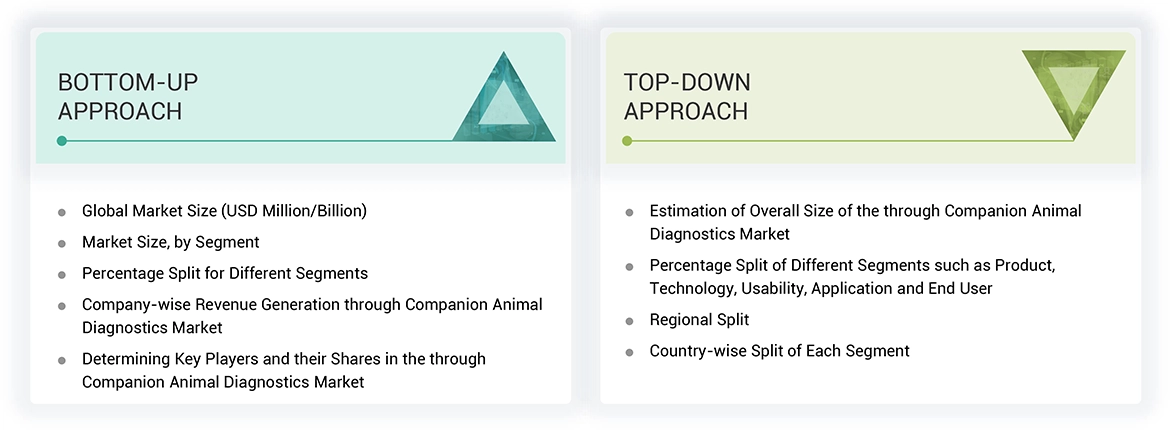
The following illustrative figure shows the market research methodology applied in making this report on the companion animal diagnostics market.
Secondary Research
This research study involved the usage of comprehensive secondary sources; directories; databases such as Bloomberg Business, Factiva, and Dun & Bradstreet; white papers; annual reports; company house documents; investor presentations; and SEC filings of companies. Secondary research was used to identify and collect information useful for the extensive, technical, market-oriented, and commercial study of the companion animal diagnostics market. It was also used to obtain important information about the key players, market classification, and segmentation according to industry trends to the bottom-most level and key developments related to market and technology perspectives. A database of the key industry leaders was also prepared using secondary research.
Primary Research
In the primary research process, various sources from both the supply and demand sides were interviewed to obtain qualitative and quantitative information for this report. Primary sources from the supply side include industry experts such as CEOs, vice presidents, marketing and sales directors, technology and innovation directors, and related key executives from various key companies and organizations operating in the companion animal diagnostics market.
Market Size Estimation
The total size of the companion animal diagnostics market was arrived at after data triangulation from two different approaches, as mentioned below. After each approach, the weighted average of all approaches was taken based on the level of assumptions used in each approach.
Bottom-up Approach: Revenues of individual companies were gathered from public sources and databases. Shares of the companion animal diagnostics businesses of leading players were gathered from secondary sources to the extent available. In certain cases, the share of the business unit was ascertained after a detailed analysis of various parameters, including product portfolio, market positioning, selling price, and geographic reach and strength. Individual shares or revenue estimates were validated through expert interviews.
Country level Analysis: The size of the companion animal diagnostics market was obtained from the annual presentations of leading players and secondary data available in the public domain. The share of technologies in the companion animal diagnostics market was obtained from secondary data and validated by primary participants to arrive at the total companion animal diagnostics market. Primary participants further validated the numbers.
Primary Interviews: As a part of the primary research process, individual respondent insights on the market size and growth were taken during the interview (regional and global, as applicable). All the responses were collated, and a weighted average was taken to derive a probabilistic estimate of the market size and growth rate.
Geographic market assessment (by region & country): The geographic assessment was conducted using the following approaches:
Approach 1: Geographic revenue contributions/splits of leading players in the market (wherever available) and the respective growth trends
Approach 2: Geographic adoption trends for individual product segments, by technology, and growth prospects for each segment (assumptions and indicative estimates validated from primary interviews)
At each point, assumptions and approaches were validated through industry experts contacted during primary research. Considering the limitations of data available from secondary research, revenue estimates for individual companies (for the overall companion animal diagnostics market and geographic market assessment) were ascertained based on a detailed analysis of their respective product offerings, geographic reach/strength (direct or through distributors or suppliers), and shares of the leading players in a particular region or country.
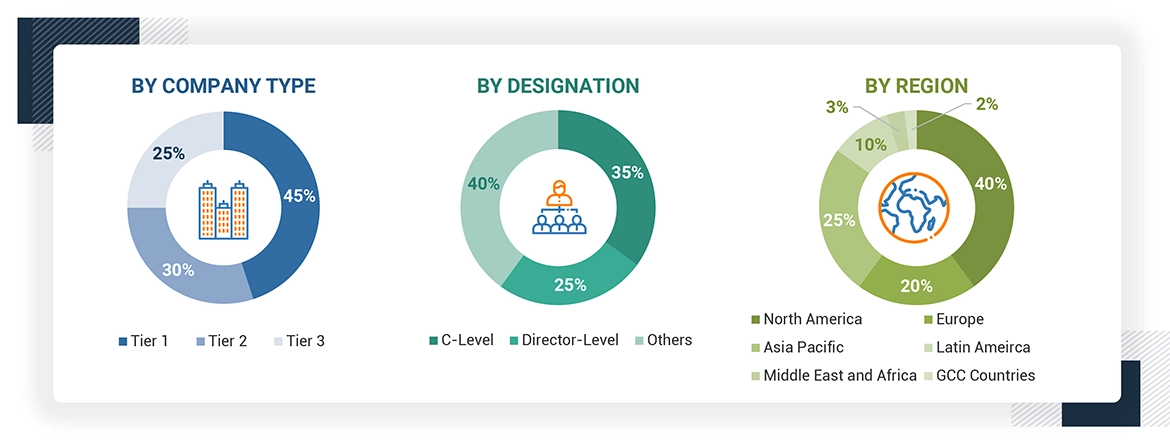
A breakdown of the primary respondents for companion animl diagnostics (supply side) market is provided below:
To know about the assumptions considered for the study, download the pdf brochure
Data Triangulation
After arriving at the market size, the total market was divided into several segments and subsegments. To complete the overall market engineering process and arrive at the exact statistics for all segments and subsegments, data triangulation and market breakdown procedures were employed, wherever applicable. The following figure shows the market validation, source structure, and data triangulation methodology implemented in the market engineering process.
Approach to derive the market size and estimate market growth
The market rankings for leading players were ascertained after a detailed assessment of their revenues from the companion animal diagnostics business using secondary data available through paid and unpaid sources. Owing to data limitations, in certain cases, the revenue share was arrived at after a detailed assessment of the product portfolios of major companies and their respective sales performance. At each point, this data was validated through primary interviews with industry experts.
Objectives of the Study
- To define, describe, and forecast the companion animal diagnostics market by technology, application, animal type, end user, and region
- To provide detailed information about factors influencing the market growth (such as drivers, restraints, opportunities, and challenges)
- To strategically analyze micromarkets with respect to individual growth trends, prospects, and contributions to the overall companion animal diagnostics market
- To analyze market opportunities for stakeholders and provide details of the competitive landscape of key players in the companion animal diagnostics market
- To forecast the size of the companion animal diagnostics market in key regional segments, namely, North America, Europe, the Asia Pacific, Latin America, and the Middle East & Africa
- To profile key players in the companion animal diagnostics market and comprehensively analyze their core competencies
- To track and analyze competitive developments such as mergers, acquisitions, product & technology development, and R&D activities of leading players in the companion animal diagnostics market
Available Customizations
With the given market data, MarketsandMarkets offers customizations as per your company’s specific needs. The following customization options are available for the report:
Geographic Analysis
- Further breakdown of the RoE companion animal diagnostics market into Sweden, Russia, Austria, Finland, and others
- Further breakdown of the RoLATAM companion animal diagnostics market into Argentina, Colombia, Chile, and others
- Further breakdown of the Benelux companion animal diagnostics market into Belgium, the Netherlands, and Luxembourg
Competitive Landscape Assessment
- Market share analysis for the APAC region, which provides market shares of the top 3–5 key players in the companion animal diagnostics market.
- Competitive leadership mapping for established players in the US
Growth opportunities and latent adjacency in Companion Animal Diagnostics Market