Virtual Fitting Room Market by Component (Hardware (Prefabricated & Customized), Software and Services), End-User (Physical Store & Virtual Store), Use Cases (Apparel, Eye Wear, Jewelry & Watches, Beauty & Cosmetics), Region - Global Forecast to 2024


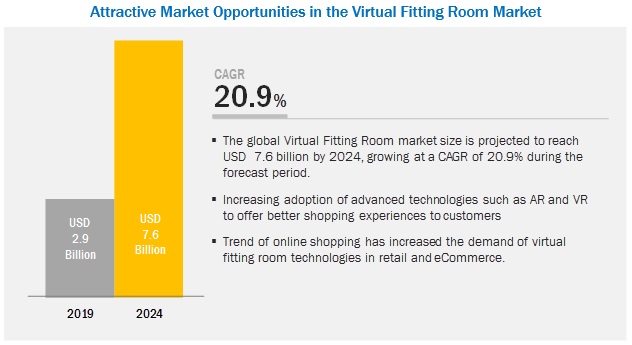
[118 Pages Report] MarketsandMarkets expects the global virtual fitting room market to grow from USD 2.9 billion in 2019 to USD 7.6 billion by 2024, at a CAGR of 20.9% during the forecast period. Growing number of smartphone users, improved customer experiences, and increased adoption of technologies are expected to drive the market.
In the virtual fitting room market by use cases, apparel to grow at the highest CAGR during the forecast period
Retail and eCommerce companies are focused on making a lot of investment in virtual fitting room solutions to reduce inventory cost, inefficiency, and time wastage. By deploying virtual fitting room platform into the operations, retail and eCommerce companies can offer personalized ads to individual users based on their online activity. Moreover, it enables personalized retargeting and buying and selling of individual page views in real time.
In the virtual fitting room market by component, the software segment is expected to hold the largest market size during the forecast period
By component, the market is segmented into hardware, software, and services. Among these, software is expected to hold the largest market size during the forecast period due to the increasing adoption of software tools and platforms is the market.
In the virtual fitting room market by services, support services segment to grow at a higher CAGR during the forecast period
Based on services, the market is segmented into consulting, integration, and support. In the market, support services are growing at a fast pace, as it is becoming a powerful service to engage the target audience. Support services can be provided to retailers across eCommerce and in mobile applications. The growing time spent by users for online shopping and surfing the Internet on mobile and other devices is inspiring various retailers to invest in the virtual fitting room services.
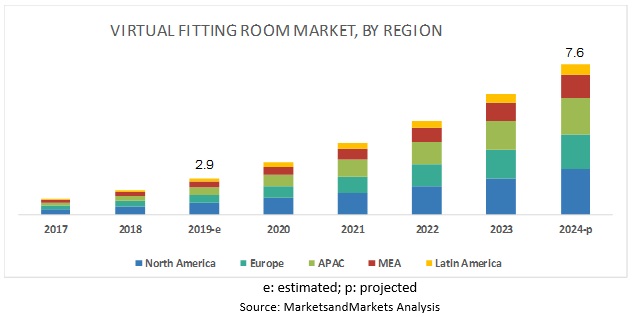
North America to hold the largest market size during the forecast period
North America is expected to hold the largest market size in the global virtual fitting room market, as the region has a maximum number of smartphone users. Furthermore, the time spent by these users on shopping online is also increasing; hence, to target these large number of customers, retailers are focusing on deploying virtual fitting room solutions into their operations. Whereas, APAC is expected to grow at the fastest rate during the forecast period. The growth across the region is due to the increasing adoption of advanced technologies among retail and fashion industries; the region is expected to witness significant growth during the forecast period.
Some of the major virtual fitting room vendors include Zugara (US), Total Immersion (France), True Fit (US), Metail (UK), 3D-A-PORTER (UK), Magic Mirror (UK), AstraFit (US), Fit Analytics (Germany), Visualook (Spain), ELSE Corp (Italy), FXGear (Korea), Sizebay (Brazil), triMirror (US), MemoMi (US), SenseMi (UAE), Fision Technologies (Switzerland), and Coitor IT Tech (India). These companies have adopted various organic and inorganic growth strategies, such as new product launches, product enhancements, partnerships, agreements, to further expand their presence in the global market.
Metail is one of the key players in the market. Moreover, the company is undertaking various growth strategies to stay competitive in this market. In the virtual fitting room market, Metail is undertaking partnership strategies to compete with various solution providers. For instance, in May 2017, Metail partnered with Princess Polly, the fastest-growing fashion brand. This partnership helped Metail enter the Australian market and enabled shoppers to try clothes online.
Zugara is one of the key players in the virtual fitting room market that primarily offers virtual fitting rooms and generates maximum revenue from the same. The company uses augmented reality and computer vision technologies to solve user interaction. Moreover, the company has key patents in the AR space. Zugara is constantly looking at how they can integrate different technologies with AR and VR platforms to create innovative use cases. The company has its resellers present across the globe to sell its products.
Scope of the Report
|
Report Metrics |
Details |
|
Market size available for years |
2017�2024 |
|
Base year considered |
2018 |
|
Forecast period |
2019�2024 |
|
Forecast units |
Million (USD) |
|
Segments covered |
Components, End User, Use Cases, and Regions |
|
Geographies covered |
North America, Europe, APAC, MEA, and Latin America |
|
Companies covered |
Zugara (US), Total Immersion (France), True Fit (US), Metail (UK), 3D-A-PORTER (UK), Magic Mirror (UK), AstraFit (US), Fit Analytics (Germany), Visualook (Spain), ELSE Corp (Italy), FXGear (Korea), Sizebay (Brazil), triMirror (US), MemoMi (US), SenseMi (UAE), Fision Technologies (Switzerland), and Coitor IT Tech (India) |
This research report categorizes the virtual fitting room market based on use cases, components, end user, , and region.
Based on Use Case, the market has the following segments:
- Apparel
- Accessories
- Eye Wear
- Jewelry and Watches
- Beauty and Cosmetics
- Others (Footwear, furniture, and decor)
Based on Component, the virtual fitting room market has the following segments:
- Hardware
- Software
- Services
Based on End User, the market has the following segments:
- Physical store
- Virtual Store
Based on Regions, the market has the following segments:
- North America
- Europe
- APAC
- MEA
- Latin America
Critical questions the report answers:
- What are the current trends in the virtual fitting room market driving the demand for technological advancements?
- What are the regulations that are impacting the market and use cases of various vendors providing virtual fitting room solution and platforms?
- What are various developments undertaken by key players in the market and competitive analysis of vendors?
- How is the adoption of virtual fitting room across the various region?
- What are the major use cases in the virtual fitting room market?
Frequently Asked Questions (FAQ):
What is Virtual Fitting Room?
What are the top companies providing Virtual Fitting Room solutions and services?
What is the impact for technologies such as AR and VR in virtual fitting room market?
Who are major end users of virtual fitting room?
To speak to our analyst for a discussion on the above findings, click Speak to Analyst
 Exclusive indicates content/data unique to MarketsandMarkets and not available with any competitors.
Table of Contents
1 Introduction (Page No. - 14)
1.1 Objectives of the Study
1.2 Market Definition
1.3 Market Scope
1.3.1 Market Segmentation
1.3.2 Regions Covered
1.4 Years Considered for the Study
1.5 Currency Considered
1.6 Stakeholders
2 Introduction (Page No. - 18)
2.1 Research Data
2.1.1 Secondary Data
2.1.2 Primary Data
2.1.2.1 Breakup of Primary Profiles
2.1.2.2 Key Industry Insights
2.2 Market Breakup and Data Triangulation
2.3 Market Size Estimation
2.3.1 Top-Down Approach
2.3.2 Bottom-Up Approach
2.4 Market Forecast
2.5 Research Assumptions
2.6 Limitations of the Study
3 Executive Summary (Page No. - 25)
4 Premium Insights (Page No. - 29)
4.1 Attractive Market Opportunities in the Market
4.2 Market: Top 3 Use Cases
4.3 Market: By Region
4.4 Market in North America, By End User and Region
5 Market Overview (Page No. - 32)
5.1 Introduction
5.2 Market Dynamics
5.2.1 Drivers
5.2.1.1 Increasing Adoption of Advanced Technologies, Such as AR and VR, to Offer Better Shopping Experience to Customers
5.2.1.2 Increasing Focus on R&D Activities
5.2.1.3 Trend of Online Shopping Increasing the Demand for Virtual Fitting Room Technologies in Retail and eCommerce
5.2.2 Restraints
5.2.2.1 Complexities in Real-Time Control
5.2.3 Opportunities
5.2.3.1 Increasing Number of Partnerships
5.2.3.2 Growing Number of Startups to Raise Funds in the Virtual Fitting Room Market
5.2.4 Challenges
5.2.4.1 Developing User-Friendly Virtual Fitting Room Solutions
5.3 Key Acquisitions in the Last Few Years
5.4 Regulatory Implications
5.4.1 General Data Protection Regulation
5.4.2 Simulation Interoperability Standards Organisation
5.5 Use Cases
5.5.1 Use Case: Scenario 1
5.5.2 Use Case: Scenario 2
5.5.3 Use Case: Scenario 3
5.5.4 Use Case: Scenario 4
5.5.5 Use Case: Scenario 5
6 Virtual Fitting Room Market By Component (Page No. - 38)
6.1 Introduction
6.2 Hardware
6.2.1 Prefabricated
6.2.1.1 Virtual Mirrors to Be Major Hardware Segment in the Market
6.2.2 Customized
6.2.2.1 Adoption of Customized Virtual Mirrors Based on the AR Technology By Major Retailers to Drive the Market
6.3 Software
6.3.1 Software Tools
6.3.1.1 Plugins Continue to Be Widely Used Software Components in the Market
6.3.2 Platforms
6.3.2.1 3D Body and Face Scanning to Boost the Adoption of Virtual Fitting Room Software
6.4 Services
6.4.1 Consulting
6.4.1.1 Technicalities Involved in Implementing Virtual Fitting Room Solutions and Platform to Boost the Growth of Consulting Services
6.4.2 Integration Services
6.4.2.1 Integration and Installation Services to Gain Traction in Coming Years
6.4.3 Support Services
6.4.3.1 Growing Deployment of Edge and AI Solutions to Drive Support and Maintenance Services
7 Market By End User (Page No. - 49)
7.1 Introduction
7.2 Physical Store
7.3 Virtual Store
8 Virtual Fitting Room Market, By Use Case (Page No. - 53)
8.1 Introduction
8.2 Apparel
8.2.1 Online Shopping to Play Key Role in the Adoption of Virtual Fitting Room Solutions
8.3 Accessories
8.3.1 Low Time Utilization to Boost Growth of Virtual Fitting Room Solution in Accessories
8.4 Eyewear
8.4.1 Demand for Personalization to Play A Significant Role in Eyewear Use Cases
8.5 Jewelry and Watches
8.5.1 Virtual Fitting Room to Provide Better Targeting Capabilities to Jewellers
8.6 Beauty and Cosmetics
8.6.1 Virtual Fitting Room to Help Travel and Luxury Enterprises Increase the Visibility of Offers
8.7 Others
9 Geographic Analysis (Page No. - 60)
9.1 Introduction
9.2 North America
9.2.1 United States
9.2.1.1 Rapid Growth of eCommerce to Lead High Adoption of Virtual Fitting Room Solutions
9.2.2 Canada
9.2.2.1 Increasing Awareness About AR Technology Among Retailers to Drive the Adoption of Virtual Fitting Room in Canada
9.3 Europe
9.3.1 United Kingdom
9.3.1.1 Increasing Digitization of Fashion to Boost the Demand for Retail Fitting Room Solutions in the Country
9.3.2 Germany
9.3.2.1 Increasing Online Returns of Products to Fuel the Adoption of Virtual Fitting Room Solutions in Germany
9.3.3 France
9.3.3.1 Growing eCommerce Encouraging Retailers to Integrate Virtual Fitting Room Solutions
9.3.4 Rest of Europe
9.4 Asia Pacific
9.4.1 China
9.4.1.1 Demand for Enhanced Customer Experience Throughout the Buying Journey Among Clients to Drive the Market
9.4.2 Japan
9.4.2.1 Virtual Fitting Room Solution Providers� Growing Focus in Japan to Drive Market Growth
9.4.3 India
9.4.3.1 Companies Expanding and Collaborating to Grow Their Business in India
9.4.4 Rest of Asia Pacific
9.5 Middle East and Africa
9.5.1 United Arab Emirates
9.5.1.1 On-The-Go Installation of Virtual Fitting Gadgets Across Fashion Stores to Boost Demand for Virtual Fitting Room Solutions
9.5.2 Israel
9.5.2.1 Increasing Research and Development to Instigate the Need for Virtual Fitting Room Technology for Retailers
9.5.3 Rest of Middle East and Africa
9.6 Latin America
9.6.1 Brazil
9.6.1.1 Emerging Startups in Brazil to Drive the Virtual Fitting Room Market
9.6.2 Mexico
9.6.2.1 Growing Use of Various Technologies to Achieve A Customers' Realistic Clothing Choice Based Prediction in Mexico to Create the Demand for Virtual Fitting Room Solutions
9.6.3 Rest of Latin America
10 Competitive Landscape (Page No. - 85)
10.1 Start-Up Micro Quadrant
10.1.1 Progressive Companies
10.1.2 Responsive Companies
10.1.3 Dynamic Companies
10.1.4 Starting Blocks
10.2 Strength of Product Portfolio
10.3 Business Strategy Excellence
11 Company Profiles (Page No. - 89)
(Business Overview, Solutions/Products/Platforms Offered, Recent Developments, SWOT Analysis, and MnM View)*
11.1 Metail
11.2 Zugara
11.3 True Fit
11.4 Total Immersion
11.5 3D-A-Porter
11.6 Magic Mirror
11.7 AstraFit
11.8 Fit Analytics
11.9 Visualook
11.10 ELSE Corp
*Details on Business Overview, Solutions/Products/Platforms Offered, Recent Developments, SWOT Analysis, and MnM View Might Not Be Captured in Case of Unlisted Companies.
11.11 FXGear
11.12 Sizebay
11.13 Trimirror
11.14 Memomi
11.15 Sensemi
11.16 Fision Technologies
11.17 Coitor IT Tech
12 Appendix (Page No. - 109)
12.1 Insights of Industry Experts
12.2 Discussion Guide
12.3 Knowledge Store: Marketsandmarkets� Subscription Portal
12.4 Available Customizations
12.5 Related Reports
12.6 Author Details
List of Tables (64 Tables)
Table 1 United States Dollar Exchange Rate, 2015�2018
Table 2 Factor Analysis
Table 3 Global Market Size and Growth Rate, 2017�2024 (USD Million and Y-O-Y%)
Table 4 Virtual Fitting Room Market Size, By Component, 2017�2024 (USD Million)
Table 5 Hardware: Market Size, By Type, 2017�2024 (USD Million)
Table 6 Hardware: Market Size, By Region, 2017�2024 (USD Million)
Table 7 Prefabricated Market Size, By Region, 2017�2024 (USD Million)
Table 8 Customized Market Size, By Region, 2017�2024 (USD Million)
Table 9 Software: Market Size By Type, 2017�2024 (USD Million)
Table 10 Software: Market Size By Region, 2017�2024 (USD Million)
Table 11 Software Tools Market Size, By Region, 2017�2024 (USD Million)
Table 12 Platforms Market Size, By Region, 2017�2024 (USD Million)
Table 13 Services: Market Size By Type, 2017�2024 (USD Million)
Table 14 Services: Market Size By Region, 2017�2024 (USD Million)
Table 15 Consulting Market Size, By Region, 2017�2024 (USD Million)
Table 16 Integration Services Market Size, By Region, 2017�2024 (USD Million)
Table 17 Support Services Market Size, By Region, 2017�2024 (USD Million)
Table 18 Virtual Fitting Room Market Size, By End User, 2017�2024 (USD Million)
Table 19 Physical Store: Market Size By Region, 2017�2024 (USD Million)
Table 20 Virtual Store: Market Size By Region, 2017�2024 (USD Million)
Table 21 Virtual Fitting Room Market Size, By Use Case, 2017�2024 (USD Million)
Table 22 Apparel: Market Size By Region, 2017�2024 (USD Million)
Table 23 Accessories: Market Size By Region, 2017�2024 (USD Million)
Table 24 Eyewear: Market Size By Region, 2017�2024 (USD Million)
Table 25 Jewelry and Watches: Market Size By Region, 2017�2024 (USD Million)
Table 26 Beauty and Cosmetics: Market Size By Region 2017�2024 (USD Million)
Table 27 Others: Market Size By Region, 2017�2024 (USD Million)
Table 28 Virtual Fitting Room Market Size, By Region, 2017�2024 (USD Million)
Table 29 North America: Market Size By Component, 2017�2024 (USD Million)
Table 30 North America: Market Size By Hardware, 2017�2024 (USD Million)
Table 31 North America: Market Size By Software, 2017�2024 (USD Million)
Table 32 North America: Market Size By Service, 2017�2024 (USD Million)
Table 33 North America: Market Size By End User, 2017�2024 (USD Million)
Table 34 North America: Market Size By Use Case, 2017�2024 (USD Million)
Table 35 North America: Market Size By Country, 2017�2024 (USD Million)
Table 36 Europe: Virtual Fitting Room Market Size, By Component, 2017�2024 (USD Million)
Table 37 Europe: Market Size By Hardware, 2017�2024 (USD Million)
Table 38 Europe: Market Size By Software, 2017�2024 (USD Million)
Table 39 Europe: Market Size By Services, 2017�2024 (USD Million)
Table 40 Europe: Market Size By End User, 2017�2024 (USD Million)
Table 41 Europe: Market Size By Use Cases, 2017�2024 (USD Million)
Table 42 Europe: Market Size By Country, 2017�2024 (USD Million)
Table 43 Major Eretailers in Europe
Table 44 Asia Pacific: Virtual Fitting Room Market Size, By Component, 2017�2024 (USD Million)
Table 45 Asia Pacific: Market Size By Hardware, 2017�2024 (USD Million)
Table 46 Asia Pacific: Market Size By Software, 2017�2024 (USD Million)
Table 47 Asia Pacific: Market Size By Service, 2017�2024 (USD Million)
Table 48 Asia Pacific: Market Size By End User, 2017�2024 (USD Million)
Table 49 Asia Pacific: Market Size By Use Case, 2017�2024 (USD Million)
Table 50 Asia Pacific: Market Size By Country, 2017�2024 (USD Million)
Table 51 Middle East and Africa: Virtual Fitting Room Market Size, By Component, 2017�2024 (USD Million)
Table 52 Middle East and Africa: Market Size By Hardware, 2017�2024 (USD Million)
Table 53 Middle East and Africa: Market Size By Software, 2017�2024 (USD Million)
Table 54 Middle East and Africa: Market Size By Service, 2017�2024 (USD Million)
Table 55 Middle East and Africa: Market Size By End User, 2017�2024 (USD Million)
Table 56 Middle East and Africa: Market Size By Use Case, 2017�2024 (USD Million)
Table 57 Middle East and Africa: Market Size By Sub-Region, 2017�2024 (USD Million)
Table 58 Latin America: Virtual Fitting Room Market Size, By Component, 2017�2024 (USD Million)
Table 59 Latin America: Market Size By Hardware, 2017�2024 (USD Million)
Table 60 Latin America: Market Size By Software, 2017�2024 (USD Million)
Table 61 Latin America: Market Size By Service, 2017�2024 (USD Million)
Table 62 Latin America: Market Size By End User, 2017�2024 (USD Million)
Table 63 Latin America: Market Size By Use Case, 2017�2024 (USD Million)
Table 64 Latin America: Market Size By Country, 2017�2024 (USD Million)
List of Figures (28 Figures)
Figure 1 Virtual Fitting Room Market: Research Design
Figure 2 Market: Top-Down and Bottom-Up Approaches
Figure 3 Market Snapshot, By Component
Figure 4 Market Snapshot, By Hardware
Figure 5 Market Snapshot, By Software
Figure 6 Market Snapshot, By Service
Figure 7 Market Snapshot, By End User
Figure 8 Market Snapshot, By Use Case
Figure 9 Increasing Adoption of Advanced Technologies to Offer Better Shopping Experiences for Customers to Drive the Overall Growth of the Virtual Fitting Room Market During the Forecast Period
Figure 10 Apparel Segment to Grow at the Highest CAGR During Forecast Period
Figure 11 North America to Hold the Highest Market Share in 2019
Figure 12 Virtual Store and Asia Pacific Accounted for the Highest Growth Rates in the Market in 2019
Figure 13 Drivers, Restraints, Opportunities, and Challenges: Virtual Fitting Room Market
Figure 14 Software Segment to Register the Highest CAGR During the Forecast Period
Figure 15 Prefabricated to Register A Higher CAGR During the Forecast Period
Figure 16 Software Tools to Register A Higher CAGR During the Forecast Period
Figure 17 Support Services to Grow at the Highest CAGR During the Forecast Period
Figure 18 Virtual Store Segment to Register A Higher CAGR During the Forecast Period
Figure 19 Apparel Segment to Register the Highest CAGR During the Forecast Period
Figure 20 North America to Hold the Largest Market Size and APAC to Grow at the Highest CAGR During the Forecast Period
Figure 21 India to Register Growth at the Highest CAGR During the Forecast Period
Figure 22 North America Market Snapshot
Figure 23 Europe: Market Snapshot
Figure 24 Asia Pacific: Market Snapshot
Figure 25 Virtual Fitting Room Market (Global) Competitive Leadership Mapping for Start-Ups, 2018
Figure 26 SWOT Analysis: Metail
Figure 27 SWOT Analysis: Zugara
Figure 28 SWOT Analysis: True Fit
The study consists of 4 major activities to estimate the current market size of the virtual fitting room market. Exhaustive secondary research was done to collect information on the market, the peer market. The next step was to validate these findings, assumptions, and sizing with the industry experts across the value chain through primary research. Both the top-down and bottom-up approaches were employed to estimate the complete market size. Thereafter, the market breakup and data triangulation procedures were used to estimate the market size of the segments and sub-segments of the virtual fitting room market.
Secondary Research
In the secondary research process, various secondary sources, such as D&B Hoovers and Bloomberg BusinessWeek have been referred to for identifying and collecting information for this study. Secondary sources included annual reports; press releases and investor presentations of companies; white papers, certified publications, and articles by recognized authors; gold standard and silver standard websites; regulatory bodies; and databases.
Primary Research
Various primary sources from both the supply and demand sides of the virtual fitting room market were interviewed to obtain qualitative and quantitative information for this study. The primary sources from the supply side included industry experts, such as Chief Executive Officers (CEOs), Vice Presidents (VPs), marketing directors, technology and innovation directors, and related key executives from various vendors who provide the virtual fitting room solutions and associated service providers operating in the targeted regions. All possible parameters that affect the market covered in this research study have been accounted for, viewed in extensive detail, verified through primary research, and analyzed to get the final quantitative and qualitative data.
The following is the breakup of the primary respondents� profiles:
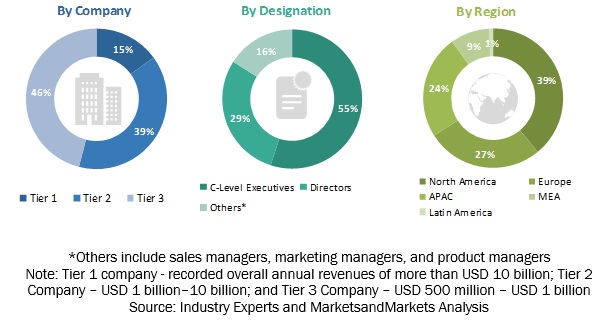
To know about the assumptions considered for the study, download the pdf brochure
Virtual Fitting Room Market Size Estimation
For making market estimates and forecasting the virtual fitting room market and the other dependent submarkets, the top-down and bottom-up approaches were used. The bottom-up procedure was used to arrive at the overall market size of the global virtual fitting room market using key companies� revenue and their offerings in the market. The research methodology used to estimate the market size includes the following:
- The key players in the market have been identified through extensive secondary research.
- The market size, in terms of value, has been determined through primary and secondary research processes.
- All percentage shares, splits, and breakups have been determined using secondary sources and verified through primary sources.
Data Triangulation
With data triangulation and validation through primary interviews, the exact value of the overall market size was determined and confirmed using this study. The overall market size was then used in the top-down procedure to estimate the size of other individual markets via percentage splits of the market segmentation.
Report objectives
- To define, describe, and forecast the size of the virtual fitting room market by use cases apparel, accessories, eye wear, jewelry and watches, beauty and cosmetics, and others (footwear, furniture and decor), by component (Hardware (prefabricated and customized), software, and services by end use (Physical store and Virtual store), by region (North America, Europe, Asia Pacific (APAC), Middle East and Africa (MEA), and Latin America)
- To provide detailed information about the major factors (drivers, restraints, opportunities, and challenges) influencing the growth of the virtual fitting room market
- To strategically analyze the micromarkets with respect to individual growth trends, prospects, and contributions to the overall market
- To study the complete value chain of the market
- To analyze opportunities in the market for stakeholders by identifying the high-growth segments of the virtual fitting room ecosystem
- To strategically profile key players and comprehensively analyze their market position in terms of ranking and core competencies, along with detailing competitive landscape for market leaders
- To analyze strategic approaches, such as product/solution/service launches, acquisitions, agreements, and partnerships, in the market
Available Customizations
With the given market data, MarketsandMarkets offers customizations as per the company�s specific needs. The following customization options are available for the report:
Product Analysis
- Product matrix gives a detailed comparison of the product portfolio of each company
Geographic Analysis
- Further breakup of the North American virtual fitting room market
- Further breakup of the European market
- Further breakup of the APAC market
- Further breakup of the MEA market
- Further breakup of the Latin American market
Company Information
- Detailed analysis and profiling of additional market players up to 5


Growth opportunities and latent adjacency in Virtual Fitting Room Market