Virtual Sensors Market by Component (Solutions and Services), Deployment Mode (Cloud and On-Premises), End User (Process Industry - Manufacturing and Utilities, Automotive and Transportation, and Oil and Gas), and Region - Global Forecast to 2023


[97 Pages Report]A virtual sensor estimates properties/ processes/conditions using mathematical models rather than physical sensors/electrodes. These mathematical models use other physical sensor readings to calculate or estimate the property/conditions of the activity. The real-time data gathered from the physical sensors or nodes are connected to software that determines the present and future requirements of that asset.
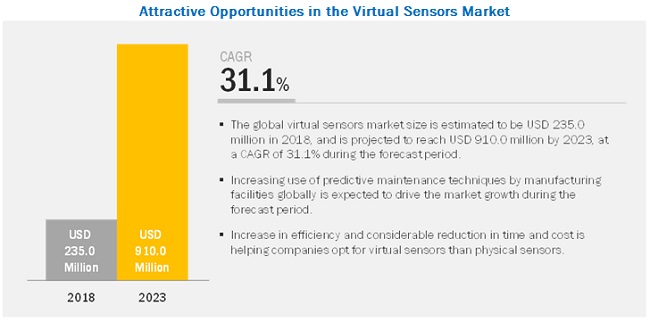
The virtual sensors market is valued at USD 235 million in 2018 and expected to reach USD 910 million by 2023, at a CAGR of 31.1% during the forecast period. The virtual sensors market has the potential to be huge and be the face of almost all future applications connected with physical sensors. The increase in the implementation of these types of sensors is due to its benefits to various industries. This includes efficiency, predictive maintenance, low cost and faster output, ability to estimate in harsh environmental conditions until the central issue of data storage is addressed, and solutions are designed and tailored for each institution or organization and application.
By Component, the �Services� segment is projected to grow at the highest rate during the forecast period.
The virtual sensors market by components has solutions and services segments. Virtual sensors enable organizations to measure difficult, expensive, and physically impossible to measure parameters by leveraging big data and machine learning algorithms. Virtual sensor solutions enable organizations to obtain desired and accurate information more effectively with the limited sensing position. The services help organizations in effective integration and implementation of virtual sensor solutions with the existing in-house infrastructure. Advisory services offered by vendors help users select the best virtual sensor solution, which is appropriate to their business needs.
By Deployment Mode, the �On-Premises� segment is expected to lead the market during the forecast period.
Based on deployment mode, the virtual sensors market is segmented into cloud and on-premises. In the on-premises deployment mode, the software is installed on the customers� server, whereas in the cloud deployment, the software is hosted on dedicated equipment situated off-premises. On-premises deployment runs on customer data centers and allows them to control and manage all aspects of the Virtual sensors. Between the two deployment modes, the cloud-based deployment is expected to exhibit a higher growth rate during the forecast period while the on-premises segment is expected to have a higher share of the market.
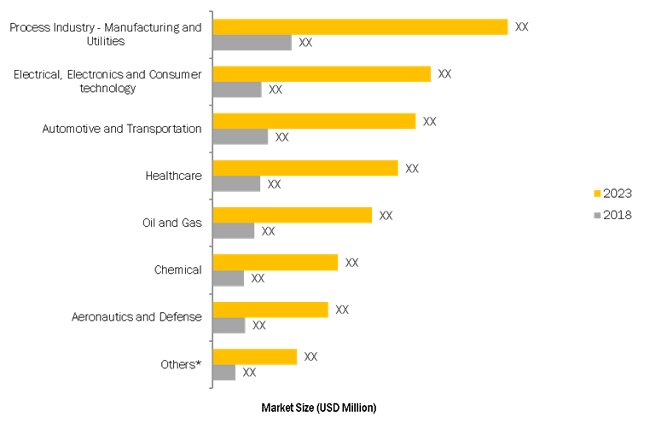
By End-User, the �Process Industry � Manufacturing and Utilities� sector is projected to dominate the market.
The process industry - manufacturing and utilities segment is estimated to lead the virtual sensors market. Virtual sensors that behave exactly the same as their physical counterpart enable companies in this sector to accelerate the industrial transformation journey. The companies in the sector are always striving to increase product quality and production efficiency and to reduce costs related to hardware and processing. The cost and efficiency benefits of virtual sensors are encouraging all branches of manufacturing and utility organizations to adopt virtual sensor solutions.
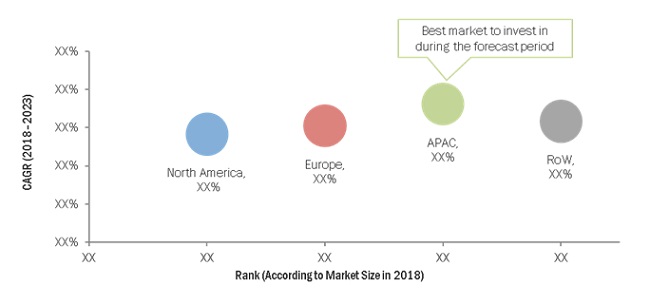
Asia Pacific to grow at the highest CAGR during the forecast period.
APAC is one of the largest manufacturing hubs for consumer electronics and automobile production in the world, and the growing integration of sensors with consumer electronics and automobile application systems will boost the virtual sensors market in the region. APAC is expected to grow at the highest CAGR during the forecast period.
Market Dynamics
Driver: Predominant use of IIoT(industrial internet of things) for design and manufacturing
In engineering and manufacturing, sensors embedded in industrial assets, such as jet engine and wind turbine, collect real-time operating data and feed it into virtual avatars that analyze the data estimate outcomes. IIoT creates new opportunities for creating virtual sensors and physical assets through data collected through sensors, which is converted into insights, optimized, and presented as business outcomes. Virtual sensors offer manufacturers to operate factories efficiently and gain timely insights into the performance of products manufactured in these factories. Additionally, monitoring the field performance of the manufactured products via their virtual sensor, along with IIoT, provides a window with an ongoing view, comparing actual usage with the anticipated use of manufactured products as reflected in parameters of the physical sensor. This process provides a valuable real-time estimate for improving the design process.
Restraint: Risks associated with data security due to the use of IoT and cloud platforms
The increasing threat to cloud data is a significant restraint for the growth of the virtual sensors market. The rising occurrences of viruses and cyber-attacks lead to many security concerns. Valuable information can be stolen by malicious viruses in computer systems, causing a significant loss to industries. Failure of IoT infrastructure providers and cloud platform providers to implement the proper security measures might lead to the disruption of an entire flow of information. Enterprises adopting virtual sensors with such platforms are prone to malware that is targeted at industrial systems due to the increasing dependence on web-based data interchange and off-the-shelf IT solutions.
Opportunity: Promising prospects for the virtual sensor technology in the automobile and aerospace industries
Technological innovations are contributing to the growth of various industries. Virtual sensors have advantages in terms of technology, data and analytics, and innovation, which help these industries to grow. At present, many companies have been transforming data collection and analytics, organization, and IT infrastructure to increase their performance agility. The principle and framework of a virtual sensor contribute to creating individual digital projects for organizations and companies. A virtual sensor can drive other digital initiatives taken by organizations. For instance, the National Center for Advanced Manufacturing of NASA implemented the virtual sensor to create, test, and build its equipment in a virtual environment. In 2016, Computer Science Corporation (CSC) (US) partnered with Microsoft Corporation (US) to create machine-learning solutions at an industrial scale. Additionally, Dassault Systems (France) developed �Build to Operate,� a product for manufacturing operations management, specifically for the aerospace and defense industry.
Challenges: Lack of skilled workforce and technical knowledge
The creation of a virtual sensor for an asset/process demands various technologies and skill sets, along with trained workers, to handle the latest equipment and software systems. The digital change would lead to a change in specifications of skills required for employees at different stages of the value chain, starting from development to sales and marketing. The expected increase in working efficiency and data-dependency of processes would lead to the requirement of new employee skill sets and high qualifications. This could create a skill gap between the new workers and trained workers. Moreover, industries are dynamic toward adopting new technologies, and at the same time, they are facing a shortage of highly skilled and proficient workforce. Additionally, despite the increasing popularity of digitization, most of the industries are unaware of the capabilities of using virtual sensor technology, due to their complex structure and lack of process understanding for the implementation of this technology.
Scope of the Report
|
Report Metric |
Details |
|
Market size available for years |
2016-2023 |
|
Base year considered |
2017 |
|
Forecast period |
2018-2023 |
|
Forecast units |
Million (USD) |
|
Segments covered |
Component, Deployment Type, End-User, and Region |
|
Geographies covered |
North America, Europe, Asia Pacific, and RoW |
|
Companies covered |
Key market players including, |
The research report categorizes the Virtual Sensors Market to forecast the revenues and analyze the trends in each of the following sub-segments:
By Component,
- Solutions
- Services
By Deployment Type,
- Cloud
- On-premises
By End-User,
- Oil and Gas
- Automotive and Transportation
- Process Industry - Manufacturing and Utilities
- Electrical, Electronics and Consumer technology
- Healthcare
- Chemical
- Aeronautics and Defense
- Others (Home Automation, Retail, and Consumer Goods)
By Region,
- North America
- US
- Canada
- Europe
- Germany
- UK
- France
- Rest of Europe
- APAC
- China
- India
- Rest of APAC
- RoW
- The Middle East and Africa
- Latin America
Key Market Players
General Electric (US), Schneider Electric (France), Siemens (Germany), Cisco (US), and Honeywell (US)
Recent Developments
- In January 2019, General Electric launched Digital Ghost, a powerful cyber-defense solution for industrial control systems. Digital Ghost helps organizations protect critical infrastructure and systems network by creating an additional layer of security and combines GE�s Digital Twin and edge computing technologies to monitor systems.
- In December 2018, Elliptic Labs partnered with Solomon Systech Limited, one of the leading providers of display controllers. This partnership enabled smartphone makers to replace outdated IR proximity sensor with software-based proximity sensor by combining Solomon Systech�s AMOLED touch controller with Elliptic Labs� INNER BEAUTY.
Critical questions the report answers:
- What are the upcoming trends in virtual sensors? What impact would they make during the forecast period?
- How will the market drivers, restraints, and future opportunities affect market dynamics?
- Which are the more significant revenue-generating regions for the Virtual Sensors Market?
- Which key areas and industries are projected to witness significant growth during the forecast period?
Frequently Asked Questions (FAQ):
What is the definition of virtual sensor/sensing?
How to use a virtual sensor used?
What are the techniques and their applications associated to virtual sensing?
What is the virtual sensor/sensing market size?
What are the key factors driving the virtual sensors market?
To speak to our analyst for a discussion on the above findings, click Speak to Analyst
 Exclusive indicates content/data unique to MarketsandMarkets and not available with any competitors.
Table of Contents
1 Introduction (Page No. - 13)
1.1 Objectives of the Study
1.2 Market Definition
1.3 Market Scope
1.3.1 Market Segmentation
1.3.2 Regions Covered
1.4 Years Considered for the Study
1.5 Stakeholders
2 Research Methodology (Page No. - 16)
2.1 Research Data
2.1.1.1 Breakup of Primary Profiles
2.1.1.2 Key Industry Insights
2.2 Market Size Estimation
2.3 Market Forecast
2.4 Assumptions for the Study
3 Executive Summary (Page No. - 22)
4 Premium Insights (Page No. - 26)
4.1 Attractive Opportunities in the Virtual Sensors Market
4.2 Market, By Component, 2018�2023
4.3 Market, By Deployment Mode, 2018 & 2023
4.4 Market, By End User, 2018
4.5 Market Investment Scenario
5 Market Overview and Industry Trends (Page No. - 29)
5.1 Introduction
5.2 Market Dynamics
5.2.1 Drivers
5.2.1.1 Predictive Maintenance and Potential Reduction in the Time and Cost Compared to Physical Sensors is Driving the Virtual Sensors Market
5.2.1.2 Rising Adoption of IoT and Cloud Platforms
5.2.1.3 Predominant Use of IIoT for Design and Manufacturing
5.2.2 Restraints
5.2.2.1 Risks Associated With Data Security Due to the Use of IoT and Cloud Platforms
5.2.3 Opportunities
5.2.3.1 Promising Prospects for the Virtual Sensor Technology in the Automobile and Aerospace Industries
5.2.4 Challenges
5.2.4.1 Lack of Awareness of the Benefits of Adopting Virtual Sensors
5.2.4.2 Lack of Skilled Workforce and Technical Knowledge
5.3 Industry Trends
5.3.1 Use Case 1: SmartuqLLC: Virtual Sensor for the Fortune 500 Heavy-Duty Engine
5.3.2 Use Case 2: Algorithmica Technologies: Virtual Sensor for Smart Condition Monitoring
5.3.3 Use Case 3: Honeywell: Virtual Sensor to Solve Powertrain Challenges
5.3.4 Use Case 4: Osisoft: Smart Sensors for Process Monitoring and Fault Detection
5.3.5 Use Case 5: Modelway: Fault-Tolerant Control of Unmanned Aerial Vehicles (UAV)
6 Virtual Sensors Market, By Component (Page No. - 35)
6.1 Introduction
6.2 Solutions
6.2.1 Ability to Reduce Operational Expenses and Time is Driving the Virtual Sensor Solutions Market
6.3 Services
6.3.1 Implementation, Training and Consulting Services are Playing A Vital Role in Effective Functioning of Virtual Sensors
7 Market, By Deployment Mode (Page No. - 39)
7.1 Introduction
7.2 Cloud
7.2.1 Ability to Scale Up the Data Storage and Agility is Driving the Cloud Deployment Mode in Market
7.3 On-Premises
7.3.1 Ability to Have Total Control Over Sensitive Data is Driving the On-Premises Deployment Mode in Market
8 Market, By End User (Page No. - 43)
8.1 Introduction
8.2 Oil and Gas
8.2.1 Oil and Gas Companies Use Virtual Sensors to Enhance Process Efficiencies and Workflows at A Lower Cost
8.3 Automotive and Transportation
8.3.1 Enhancing Safety of the Passengers and Reducing the Cost of Sensors to Drive the Adoption of Virtual Sensors
8.4 Process Industry - Manufacturing and Utilities
8.4.1 Industry 4.0 to Drive Virtual Sensors in the Process Industry - Manufacturing and Utilities Segment
8.5 Electrical, Electronics, and Consumer Technology
8.5.1 Adoption of Virtual Sensors to Support Process Automation and Improve Production Efficiency
8.6 Healthcare
8.6.1 Virtual Sensors Help Healthcare Providers in Providing Enhanced Medical Services to In-Hospital and Remotely Located Patients
8.7 Chemical
8.7.1 Virtual Sensor Solutions to Help Enhance Process Efficiency and Product Development Process in Chemical Companies
8.8 Aeronautics and Defense
8.8.1 Virtual Sensors to Help Minimize Cost of Production, Optimize Processing, and Reduce Production Time
8.9 Others
9 Virtual Sensors Market, By Region (Page No. - 53)
9.1 Introduction
9.2 North America
9.2.1 United States
9.2.1.1 Increasing Demand for Home Automation to Drive the Market in the Us
9.2.2 Canada
9.2.2.1 Digital Technologies to Drive the Market in Canada
9.3 Europe
9.3.1 United Kingdom
9.3.1.1 Growing Need to Estimate Flow Volume, Pressure, Composition and Fluid Properties in Oil and Gas Industry to Drive the UK Market
9.3.2 Germany
9.3.2.1 Increasing Use of Virtual Sensors in Industrial Robots to Propel the Growth of the Market
9.3.3 France
9.3.3.1 Virtual Sensors in Active Safety Applications in Automotive to Fuel the Growth of the Market
9.3.4 Rest of Europe
9.4 Asia Pacific
9.4.1 China
9.4.1.1 Increasing Demand for the Virtual Sensing Technology in Consumer Electronics to Drive the Virtual Sensors Market
9.4.2 Japan
9.4.2.1 Need to Reduce Investments in Physical Sensors Across Industries to Drive the Market in Japan
9.4.3 India
9.4.3.1 Increasing Use of Virtual Sensors in Health Monitoring Devices to Propel the Adoption of Virtual Sensor Solutions
9.4.4 Rest of Asia Pacific
9.5 Rest of the World
10 Competitive Landscape (Page No. - 68)
10.1 Competitive Leadership Mapping
10.1.1 Visionary Leaders
10.1.2 Innovators
10.1.3 Dynamic Differentiators
10.1.4 Emerging Companies
11 Company Profiles (Page No. - 70)
(Business Overview, Solutions Offered, Recent Developments, SWOT Analysis, and MnM View)*
11.1 General Electric
11.2 Cisco
11.3 Honeywell
11.4 Siemens
11.5 Schneider Electric
11.6 Elliptic Labs
11.7 Algorithmica Technologies
11.8 Exputec
11.9 Tactile Mobility
11.10 Intellidynamics
11.11 Andata
11.12 Aspen Technology
11.13 Osisoft
11.14 Modelway
11.15 LMI Technologies
*Details on Business Overview, Solutions Offered, Recent Developments, SWOT Analysis, and MnM View Might Not Be Captured in Case of Unlisted Companies.
12 Appendix (Page No. - 91)
12.1 Discussion Guide
12.2 Knowledge Store: Marketsandmarkets� Subscription Portal
12.3 Available Customizations
12.4 Related Reports
12.5 Author Details
List of Tables (33 Tables)
Table 1 Factor Analysis
Table 2 Virtual Sensors Market Size, By Component, 2016�2023 (USD Million)
Table 3 Solutions: Market Size, By Region, 2016�2023 (USD Million)
Table 4 Services: Market Size, By Region, 2016�2023 (USD Million)
Table 5 Market Size, By Deployment Mode, 2016�2023 (USD Million)
Table 6 Cloud: Virtual Sensormarket Size, By Region, 2016�2023 (USD Million)
Table 7 On-Premises: Market Size, By Region, 2016�2023 (USD Million)
Table 8 Market Size, By End User, 2016�2023 (USD Million)
Table 9 Oil and Gas: Virtual Sensors Market Size, By Region, 2016�2023 (USD Million)
Table 10 Automotive and Transportation: Market Size, By Region, 2016�2023 (USD Million)
Table 11 Process Industry - Manufacturing and Utilities: Market Size, By Region, 2016�2023 (USD Million)
Table 12 Electrical, Electronics, and Consumer Technology: Market Size, By Region, 2016�2023 (USD Million)
Table 13 Healthcare: Market Size, By Region, 2016�2023 (USD Million)
Table 14 Chemicals: Market Size, By Region, 2016�2023 (USD Million)
Table 15 Aeronautics and Defense: Market Size, By Region, 2016�2023 (USD Million)
Table 16 Others: Market Size, By Region, 2016�2023 (USD Million)
Table 17 Market Size, By Region, 2016�2023 (USD Million)
Table 18 North America: Virtual Sensors Market Size, By Component, 2016�2023 (USD Million)
Table 19 North America: Market Size, By Deployment Type, 2016�2023 (USD Million)
Table 20 North America: Market Size, By End User, 2016�2023 (USD Million)
Table 21 North America: Market Size, By Country, 2016�2023 (USD Million)
Table 22 Europe: Virtual Sensors Market Size, By Component, 2016�2023 (USD Million)
Table 23 Europe: Market Size, By Deployment Type, 2016�2023 (USD Million)
Table 24 Europe: Market Size, By End User, 2016�2023 (USD Million)
Table 25 Europe: Market Size, By Country, 2016�2023 (USD Million)
Table 26 Asia Pacific: Virtual Sensors Market Size, By Component, 2016�2023 (USD Million)
Table 27 Asia Pacific: Market Size, By Deployment Type, 2016�2023 (USD Million)
Table 28 Asia Pacific: Market Size, By Vertical, 2016�2023 (USD Million)
Table 29 Asia Pacific: Market Size, By Country, 2016�2023 (USD Million)
Table 30 RoW: Market Size, By Component, 2016�2023 (USD Million)
Table 31 RoW: Market Size, By Deployment Type, 2016�2023 (USD Million)
Table 32 RoW: Virtual Sensors Market Size, By Vertical, 2016�2023 (USD Million)
Table 33 RoW: Market Size, By Country, 2016�2023 (USD Million)
List of Figures (31 Figures)
Figure 1 Virtual Sensors Market: Research Design
Figure 2 Research Methodology
Figure 3 Market Breakup and Data Triangulation
Figure 4 Limitations of the Study
Figure 5 Market Size, 2016�2023 (USD Million)
Figure 6 Market Analysis
Figure 7 Fastest-Growing Segments in the Market, 2018�2023
Figure 8 Increasing Use of Predictive Maintenance Techniques to Drive the Market Growth During the Forecast Period
Figure 9 Solutions Segment to Lead the Virtual Sensors Market During the Forecast Period
Figure 10 On-Premises Segment to Lead the Market During the Forecast Period
Figure 11 Process Industry-Manufacturing and Utilities Segment to Be the Leading End User for the Market in 2018
Figure 12 Market: Market Investment Scenario
Figure 13 Virtual Sensors: Drivers, Restraints, Opportunities, and Challenges
Figure 14 Services Segment to Grow at A Higher CAGR During the Forecast Period
Figure 15 On-Premises Segment to Lead the Market in 2018
Figure 16 Process Industry - Manufacturing and Utilities Segment to Dominate the Virtual Sensors Market in 2018
Figure 17 North America to Hold the Highest Market Share in 2018
Figure 18 Asia Pacific to Grow at the Highest CAGR During the Forecast Period
Figure 19 North America: Market Snapshot
Figure 20 Asia Pacific: Market Snapshot
Figure 21 Virtual Sensors Market, Competitive Leadership Mapping, 2019
Figure 22 General Electric: Company Snapshot
Figure 23 SWOT Analysis: General Electric
Figure 24 Cisco: Company Snapshot
Figure 25 SWOT Analysis: Cisco
Figure 26 Honeywell: Company Snapshot
Figure 27 SWOT Analysis: Honeywell
Figure 28 Siemens: Company Snapshot
Figure 29 SWOT Analysis: Siemens
Figure 30 Schneider Electric: Company Snapshot
Figure 31 SWOT Analysis: Schneider Electric
The study involved 4 major activities to estimate the current market size for virtual sensors market. Exhaustive secondary research was done to collect information on the market. The next step was to validate these findings, assumptions, and sizing with industry experts across the value chain using primary research. Both top-down and bottom-up approaches were employed to estimate the complete market size. Thereafter, the market breakup and data triangulation procedures were used to estimate the market size of the segments and sub segments of the market.
Secondary Research
In the secondary research process, various secondary sources, such as D&B Hoovers, Bloomberg BusinessWeek, and Factiva, have been referred to, for identifying and collecting information for this study. Secondary sources included annual reports, press releases, and investor presentations of companies; whitepapers, certified publications, and articles by recognized authors; gold standard and silver standard websites; regulatory bodies; trade directories; and databases.
Primary Research
The virtual sensors market comprises several stakeholders, such as virtual sensor vendors, end-user companies, digital twin software vendors, software providers, system integrators, compliance and regulatory authorities, cloud service providers, resellers and distributors, research organizations, government agencies, enterprise users, technology providers, venture capitalists, private equity firms, and startup companies. The demand side of the market consists of enterprises across various end users comprising oil and gas, automotive and transportation, process industry - manufacturing and utilities, electrical, electronics and consumer technology, healthcare, chemical, and aeronautics and defense. The supply side includes virtual sensor software providers offering virtual sensor solutions and services. Various primary sources from both the supply and demand sides of the market were interviewed to obtain qualitative and quantitative information.
Following is the breakup of the primary respondents� profiles:
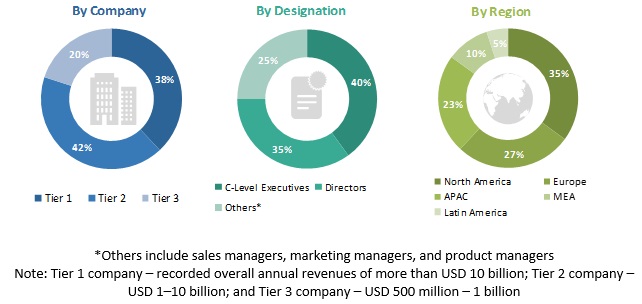
To know about the assumptions considered for the study, download the pdf brochure
Market Size Estimation
Both top-down and bottom-up approaches were used to estimate and validate the total size of the virtual sensors market. These methods were also used extensively to estimate the size of various sub segments in the market. The research methodology used to estimate the market size includes the following:
- The key players in the industry and markets have been identified through extensive secondary research.
- The industry�s supply chain and market size, in terms of value, have been determined through primary and secondary research processes.
- All percentage shares, splits, and breakdowns have been determined using secondary sources and verified through primary sources.
Data Triangulation
After arriving at the overall market size using the market size estimation processes as explained above, the market was split into several segments and sub segments. To complete the overall market engineering process and arrive at the exact statistics of each market segment and sub segment, the data triangulation and market breakdown procedures were employed, wherever applicable. The data was triangulated by studying several factors and trends from both the demand and supply sides.
Report Objectives
- To define, describe, and forecast the virtual sensors market by component (solutions and services), deployment mode, end user (oil and gas, automotive and transportation; process industry-manufacturing and utilities; electrical, electronics and consumer technology; healthcare; chemical; aeronautics and defense; and others), and region
- To provide detailed information about the major factors (drivers, restraints, opportunities, and challenges) influencing the growth of the market
- To analyze the sub-segments with respect to individual growth trends, prospects, and contributions to the total market
- To analyze opportunities in the market for stakeholders and provide the competitive landscape of the market
- To forecast the revenues of the market segments with respect to the major regions, such as North America, Europe, Asia Pacific (APAC), and RoW
- To profile the key players and comprehensively analyze their recent developments and positioning in the virtual sensors market
- To analyze competitive developments, such as mergers and acquisitions, new product developments, and Research and Development (R&D) activities, in the market
Available Customizations
With the given market data, MarketsandMarkets offers customizations as per the company�s specific needs. The following customization options are available for the report:
Product Analysis
- Product matrix gives a detailed comparison of the product portfolio of each company
Geographic Analysis
- Further breakup of the North American market into countries
- Further breakup of the European market into countries
- Further breakup of the APAC market into countries
- Further breakup of the Row virtual sensors market into countries
Company Information
- Detailed analysis and profiling of additional market players


Growth opportunities and latent adjacency in Virtual Sensors Market