VOC Sensors and Monitors Market by Device Type (Sensors and Monitors), Application (Industrial Process Monitoring, Environmental Monitoring, Air Purification & Monitoring, and Leak Detection), and Geography - Global Forecast to 2023


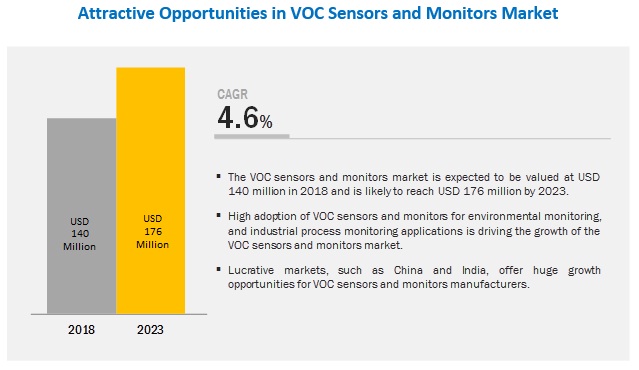
[101 Pages Report] The VOC sensors and monitors market is expected to grow from USD 140 million in 2018 to USD 176 million by 2023, at a CAGR of 4.6% during the forecast period. Increasing enforcement of occupational health and safety regulations by governments is one of the prime factors driving the market. Apart from this, growing awareness regarding controlled air quality, and rising demand for VOC sensors and monitors from developing countries are other major factors fueling the growth of the said market.
Monitors to account for larger share of VOC sensors and monitors market during forecast period
The VOC sensors and monitors market, by device type, is segmented into monitors and sensors. The monitors segment is expected to dominate and witness significant growth during the forecast period. Increasing implementation of rules and regulations by government bodies to ensure occupational health and safety of employees is the factor spurring the growth of the market for gas sensors as well as VOC monitors. Safety regulations are an important part of any industry, especially in the accident-prone industries such as oil & gas, chemicals, and building and construction.
Market for air purification and monitoring application to grow at highest CAGR during forecast period
The market for the air purification and monitoring application is expected to witness significant growth during the forecast period. Air pollution is becoming one of the most influential environmental risk factors in urban areas. It occurs when harmful substances, including gasses or particles, are introduced into the earth�s atmosphere, which directly affects the health and comfort of human beings. The adverse effects of air pollution are not just limited to the outdoor environment; it also affects the indoor environments.
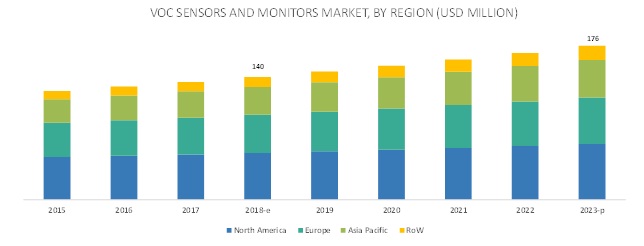
North America to account for largest market share during forecast period
North America is expected to account for the largest share of the market during the forecast period. One of the major factors contributing to the leading position of North America is the high demand for VOC sensors and monitors from the US. The US is the leading producer of VOC sensors and monitors, with a large number of manufacturers investing in R&D to develop advanced products integrated with the gas sensing technology.
Key Market Players
Key players in the market include FIGARO (Japan), ams AG (Austria), Alphasense (UK), Dr�gerwerk (Germany), Honeywell (US), Aeroqual (New Zealand), Siemens (Germany), Extech (US), Global Detection Systems (US), and USHIO (Japan). Honeywell (US) is a well-known player in the market. The company has a wide portfolio of products for detecting VOCs in critical gas sensing applications. For strengthening its position in the gas sensors market, it mainly focuses on gas sensors used in hostile environments. The company is expanding its product reach in different regions with product innovations and product launches for which it primarily focuses on R&D. In the recent years, the company launched various products related to VOC sensors and monitors. For instance, in 2018, the company launched wearable portable gas detectors named Honeywell BW Ultra monitors; in 2017, it launched Sensepoint XCL, a Bluetooth-enabled, fixed gas detector for commercial, light industrial applications.
Report Scope
Report Metric |
Details |
|
Market size provided for years |
2015�2023 |
|
Base year considered |
2017 |
|
Forecast period |
2018�2023 |
|
Forecast units |
Value (USD) |
|
Segments covered |
Device Type, Application, and Region |
|
Geographies covered |
North America, APAC, Europe, and RoW |
|
Companies covered |
Honeywell (US), Aeroqual (New Zealand), Extech (US), ams AG (Austria), and Figaro Engineering (Japan), among others (Total 14 players have been covered.) |
This research report categorizes the market based on device type, application, and region.
VOC Sensors and Monitors Market, by Device Type
- Sensors
- Monitors
VOC Sensors and Monitors Market, by Application
- Industrial Process Monitoring
- Environmental Monitoring
- Air Purification and Monitoring
- Leak Detection
VOC Sensors and Monitors Market, by Geography
- North America (US, Canada, and Mexico)
- Europe (UK, Germany, France, and Rest of Europe)
- APAC (China, Japan, India, South Korea, and Rest of APAC)
- RoW (South America, Middle East, and Africa)
Recent Developments
- In May 2018, Honeywell (US) launched connected, wearable portable gas detectors named Honeywell BW Ultra monitors that enable safety for workers in dangerous, confined spaces.
- In March 2018, the United States Environmental Protection Agency (US EPA) announced a 5-year Cooperative Research and Development Agreement (CRADA) with Aeroqual (New Zealand).
- In October 2017, Aeroqual (New Zealand) launched an AQS monitoring platform. This product is cheaper, smaller, and of lower power than AQM65. Nitrogen dioxide (NO2), ozone (O3), and particulate matter are the 3 main air pollutants in modern cities. NO2 and particulate matter are emitted directly by vehicles, and O3 is created when NO2 and VOCs combine in the presence of sunlight.
Critical questions the report answers:
- Where will all these developments take the industry in the mid to long term?
- What are the emerging applications of VOC sensors and monitors?
- How are the advancements in the gas sensor industry influencing the market?
- Which device type is expected to have a significant penetration in the market during the forecast period?
- Which countries are expected to witness significant growth in the VOC sensors and monitors market in the next 5 years?
To speak to our analyst for a discussion on the above findings, click Speak to Analyst
 Exclusive indicates content/data unique to MarketsandMarkets and not available with any competitors.
Table of Contents
1 Introduction (Page No. - 13)
1.1 Study Objectives
1.2 Definition
1.3 Study Scope
1.3.1 Markets Covered
1.3.2 Geographic Scope
1.3.3 Years Considered
1.4 Currency
1.5 Limitations
1.6 Stakeholders
2 Research Methodology (Page No. - 16)
2.1 Research Data
2.1.1 Secondary Data
2.1.1 Secondary Data
2.1.2 Primary Data
2.1.2 Primary Data
2.1.2.1 Key Data From Primary Sources
2.1.2.2 Key Industry Insights
2.1.3 Market Size Estimation
2.1.3 Market Size Estimation
2.1.3.1 Top-Down Approach
2.2 Data Triangulation
2.3 Research Assumptions
3 Executive Summary (Page No. - 23)
4 Premium Insights (Page No. - 26)
4.1 Attractive Growth Opportunities in VOC Sensors and Monitors Market
4.2 Market, By Application
4.3 Market in North America, By Country and Application
4.4 Regional Analysis: Growth Rate of Market, 2023
4.5 Market, By Device Type
5 Market Overview (Page No. - 29)
5.1 Introduction
5.1.1 Drivers
5.1.1 Drivers
5.1.1.1 Increasing Enforcement of Occupational Health and Safety Regulations By Governments
5.1.1.2 Growing Awareness Regarding Controlled Air Quality
5.1.2 Restraints
5.1.2 Restraints
5.1.3 Opportunities
5.1.3 Opportunities
5.1.3.1 Increasing Demand in Iot Applications
5.1.4 Challenges
5.1.4 Challenges
5.2 Value Chain Analysis
6 VOC Sensor and Monitor Market, By Device Type (Page No. - 33)
6.1 Introduction
6.2 Sensors
6.2.1 VOC Sensor to Witness Higher Cagr in Market During Forecast Period
6.3 Monitors
6.3.1 VOC Monitors to Continue their Dominance During Forecast Period
7 VOC Sensors and Monitors Market, By Application (Page No. - 36)
7.1 Introduction
7.2 Industrial Process Monitoring
7.2.1 Concern Regarding Industrial Labor Safety to Significantly Boost Adoption of VOC Monitors
7.3 Environmental Monitoring
7.3.1 Increasing Air Pollution Driving Market for Environmental Monitoring
7.4 Air Purification and Monitoring
7.4.1 Increasing Incidences of Respiratory Diseases to Drive Deployment of VOC Monitors in Air Purification and Monitors
7.5 Leak Detection
7.5.1 Underground Transportation, Chemicals Industries, and Commercial Buildings Drive Market for Leak Detection
8 VOC Sensors and Monitors Market, By Geography (Page No. - 40)
8.1 Introduction
8.2 North America
8.2.1 US
8.2.1 US
8.2.2 Canada
8.2.2 Canada
8.2.3 Mexico
8.2.3 Mexico
8.3 Europe
8.3.1 UK
8.3.1 UK
8.3.2 Germany
8.3.2 Germany
8.3.3 France
8.3.3 France
8.3.4 Rest of Europe
8.3.4 Rest of Europe
8.4 APAC
8.4.1 China
8.4.1 China
8.4.2 Japan
8.4.2 Japan
8.4.3 South Korea
8.4.3 South Korea
8.4.4 India
8.4.4 India
8.4.5 Rest of APAC
8.4.5 Rest of APAC
8.5 Rest of the World
8.5.1 South America
8.5.1 South America
8.5.2 Middle East
8.5.2 Middle East
8.5.3 Africa
8.5.3 Africa
9 Competitive Landscape (Page No. - 75)
9.1 Overview
9.2 Market Ranking Analysis: Market
9.3 Competitive Situations and Trends
9.3.1 Product Launches
9.3.2 Acquisitions
9.3.3 Collaborations and Expansions
10 Company Profiles (Page No. - 78)
(Business Overview, Products Offered, Recent Developments, and MnM View)*
10.1 Key Players
10.1.1 FIGARO Engineering Inc.
10.1.2 AMS AG
10.1.3 Alphasense
10.1.4 Honeywell
10.1.5 Siemens
10.1.6 Extech
10.1.7 Dr�gerwerk
10.1.8 Aeroqual
10.1.9 Global Detection Systems
10.1.10 USHIO, Inc.
10.2 Other Key Players
10.2.1 Spectrex Corporation
10.2.2 Compur Monitors GmbH & Co. KG
10.2.3 Riken Keiki Co., Ltd
10.2.4 GFG Instrumentation
*Details on Business Overview, Products Offered, Recent Developments, and MnM View Might Not Be Captured in Case of Unlisted Companies.
11 Appendix (Page No. - 96)
11.1 Discussion Guide
11.2 Knowledge Store: Marketsandmarkets� Subscription Portal
11.3 Available Customizations
11.4 Related Reports
11.5 Author Details
List of Tables (72 Tables)
Table 1 VOC Sensors and Monitors Market, By Device Type, 2015�2023 (USD Thousand) 35
Table 2 Market, By Application,2015�2023 (USD Thousand)
Table 3 Market, By Region, 2015�2023 (USD Thousand)
Table 4 Market in North America, By Country, 2015�2023 (USD Thousand)
Table 5 Market in North America, By Device Type, 2015�2023 (USD Thousand)
Table 6 Market in North America for VOC Monitors, By Country, 2015�2023 (USD Thousand)
Table 7 Market in North America for VOC Sensors, By Country, 2015�2023 (USD Thousand)
Table 8 Market in North America, By Application, 2015�2023 (USD Thousand)
Table 9 Market in North America for Environmetal Monitoring, By Country, 2015�2023 (USD Thousand)
Table 10 Market in North America for Industrial Process Monitoring, By Country, 2015�2023 (USD Thousand)
Table 11 Market in North America for Air Purification and Monitoring, By Country, 2015�2023 (USD Thousand)
Table 12 Market in North America for Leak Detection, By Country, 2015�2023 (USD Thousand)
Table 13 Market in Us, By Device Type, 2015�2023 (USD Thousand)
Table 14 Market in Us, By Application, 2015�2023 (USD Thousand)
Table 15 Market in Canada, By Device Type, 2015�2023 (USD Thousand)
Table 16 Market in Canada, By Application, 2015�2023 (USD Thousand)
Table 17 Market in Mexico, By Device Type, 2015�2023 (USD Thousand)
Table 18 Market in Mexico, By Application, 2015�2023 (USD Thousand)
Table 19 VOC Sensors and Monitors Market in Europe, By Country, 2015�2023 (USD Thousand)
Table 20 Market in Europe, By Device Type,2015�2023 (USD Thousand)
Table 21 Market in Europe for VOC Monitors, By Country, 2015�2023 (USD Thousand)
Table 22 Market in Europe for VOC for Sensors, By Country,2015�2023 (USD Thousand)
Table 23 Market in Europe, By Application, 2015�2023 (USD Thousand)
Table 24 Market in Europe for Environmental Monitoring, By Country, 2015�2023 (USD Thousand)
Table 25 Market in Europe for Industrial Process Monitoring, By Country, 2015�2023 (USD Thousand)
Table 26 Market in Europe for Air Purification and Monitoring, By Country, 2015�2023 (USD Thousand)
Table 27 Market in Europe for Leak Detection, By Country, 2015�2023 (USD Thousand)
Table 28 Market in UK, By Device Type, 2015�2023 (USD Thousand)
Table 29 Market in UK, By Application, 2015�2023 (USD Thousand)
Table 30 Market in Germany, By Device Type, 2015�2023 (USD Thousand)
Table 31 Market in Germany, By Application, 2015�2023 (USD Thousand)
Table 32 Market in France, By Device Type, 2015�2023 (USD Thousand)
Table 33 Market in France, By Application, 2015�2023 (USD Thousand)
Table 34 Market in Rest of Europe, By Device Type, 2015�2023 (USD Thousand)
Table 35 Market in Rest of Europe, By Application, 2015�2023 (USD Thousand)
Table 36 Market in APAC, By Country, 2015�2023 (USD Thousand)
Table 37 Market in APAC, By Device Type, 2015�2023 (USD Thousand)
Table 38 Market in APAC for VOC Monitors, By Country, 2015�2023 (USD Thousand)
Table 39 Market in APAC for VOC Sensors, By Country, 2015�2023 (USD Thousand)
Table 40 Market in APAC, By Application, 2015�2023 (USD Thousand)
Table 41 Market in APAC for Environmental Monitoring, By Country, 2015�2023 (USD Thousand)
Table 42 Market in APAC for Industrial Process Monitoring, By Country, 2015�2023 (USD Thousand)
Table 43 Market in APAC for Air Purification and Monitoring, By Country, 2015�2023 (USD Thousand)
Table 44 Market in APAC for Leak Detection,By Country, 2015�2023 (USD Thousand)
Table 45 Market in China, By Device Type, 2015�2023 (USD Thousand)
Table 46 Market in China, By Application, 2015�2023 (USD Thousand)
Table 47 Market in Japan, By Device Type, 2015�2023 (USD Thousand)
Table 48 Market in Japan, By Application, 2015�2023 (USD Thousand)
Table 49 Market in South Korea, By Device Type, 2015�2023 (USD Thousand)
Table 50 Market in South Korea, By Application, 2015�2023 (USD Thousand)
Table 51 Market in India, By Device Type, 2015�2023 (USD Thousand)
Table 52 Market in India, By Application, 2015�2023 (USD Thousand)
Table 53 Market in Rest of APAC, By Device Type, 2015�2023 (USD Thousand)
Table 54 Market in Rest of APAC, By Application, 2015�2023 (USD Thousand)
Table 55 Market in RoW, By Country, 2015�2023 (USD Thousand)
Table 56 Market in RoW, By Device Type, 2015�2023 (USD Thousand)
Table 57 Market in RoW for VOC Monitors, By Region, 2015�2023 (USD Thousand)
Table 58 Market in RoW for VOC Sensors, By Region, 2015�2023 (USD Thousand)
Table 59 Market in RoW, By Application, 2015�2023 (USD Thousand)
Table 60 Market in RoW for Environmental Monitoring, By Country, 2015�2023 (USD Thousand)
Table 61 Market in RoW for Industrial Process Monitoring, By Region, 2015�2023 (USD Thousand)
Table 62 Market in RoW for Air Purification and Monitoring, By Region, 2015�2023 (USD Thousand)
Table 63 Market in RoW for Leak Detection,By Region, 2015�2023 (USD Thousand)
Table 64 Market in South America, By Device Type, 2015�2023 (USD Thousand)
Table 65 Market in South America, By Application, 2015�2023 (USD Thousand)
Table 66 Market in Middle East, By Device Type, 2015�2023 (USD Thousand)
Table 67 Market in Middle East, By Application, 2015�2023 (USD Thousand)
Table 68 Market in Africa, By Device Type, 2015�2023 (USD Thousand)
Table 69 Market in Africa, By Application, 2015�2023 (USD Thousand)
Table 70 Product Launches (2016�2018)
Table 71 Acquisitions (2017)
Table 72 Collaborations and Expansions (2017�2018)
List of Figures (30 Figures)
Figure 1 VOC Sensors and Monitors Market: Research Design
Figure 2 Market Size Estimation Methodology: Top-Down Approach
Figure 3 Market Size Estimation Methodology: Bottom-Up Approach
Figure 4 Data Triangulation
Figure 5 Environmental Monitoring to Continue to Dominate VOC Sensors and Monitors Market During Forecast Period
Figure 6 Market, By Region, 2017
Figure 7 Increasing Adoption of VOC Sensors in Consumer Electronics is Expected to Provide New Growth Avenues to the Market Players
Figure 8 Enviromental Monitoring to Hold Largest Share of Market During Forecast Period
Figure 9 US Held Largest Share of Market in North America in 2017
Figure 10 RoW to Witness Highest Cagr in Market During 2018�2023
Figure 11 Monitors to Account for Major Share of Market During 2018�2023
Figure 12 Increasing Demand for Iot Applications to Provide Growth Opportunities to Market
Figure 13 Analysis of VOC Sensors and Monitors Value Chain
Figure 14 Market, By Device Type
Figure 15 Sensor Market to Grow at Higher Cagr From 2018 to 2023
Figure 16 Market, By Application
Figure 17 Market for Air Purification and Monitoring to Grow at Highest Cagr From 2018 to 2023
Figure 18 North America: Market Snapshot
Figure 19 Market in US for VOC Sensors to Grow at Higher Cagr During Forecast Period
Figure 20 Market in UK to Grow at Highest Cagr During Forecast Period
Figure 21 Monitors to Dominate VOC Sensors and Monitors Market in France During Forecast Period
Figure 22 APAC: Market Snapshot
Figure 23 Market in China for VOC Sensors to Grow at Higher Cagr During Forecast Period
Figure 24 Middle East to Witness Highest Cagr in Market in RoW During Forecast Period
Figure 25 Ranking of Key Players in Market (2017)
Figure 26 AMS AG: Company Snapshot
Figure 27 Honeywell: Company Snapshot
Figure 28 Siemens: Company Snapshot
Figure 29 Dr�gerwerk: Company Snapshot
Figure 30 USHIO, Inc.: Company Snapshot
The study involved 4 major activities carried out to estimate the current size of the market for volatile organic compounds (VOC) sensors and monitors. Exhaustive secondary research was conducted to collect information on the market along with its peer and parent markets. The next step was to validate these findings, assumptions, and sizing with industry experts across value chain through primary research. Both top-down and bottom-up approaches were employed to estimate the complete market size. Thereafter, the market breakdown and data triangulation were employed to estimate the size of the market based on segments and subsegments.
Secondary Research
In the secondary research process, various secondary sources have been referred to for identifying and collecting information important for this study. These secondary sources include gas sensor journals and magazines, IEEE journals; annual reports, press releases, and investor presentations of companies; white papers; certified publications and articles from recognized authors; and directories and databases such as Factiva, Hoovers, and OneSource.
Primary Research
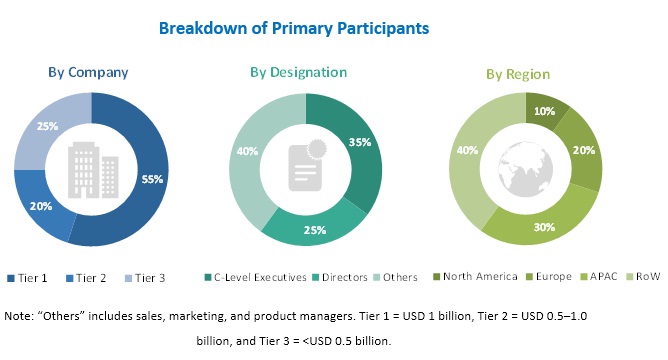
In the primary research process, various primary sources from both supply and demand sides have been interviewed to obtain qualitative and quantitative information important for this report. The primary sources from the supply side included industry experts such as CEOs, VPs, marketing directors, technology and innovation directors, and related executives from key companies and organizations operating in the VOC sensors and monitors market. After complete market engineering (including calculations regarding market statistics, market breakdown, market size estimations, market forecasting, and data triangulation), extensive primary research was conducted to gather information as well as verify and validate the critical numbers arrived at.
To know about the assumptions considered for the study, download the pdf brochure
Market Size Estimation
In the complete market engineering process, both top-down and bottom-up approaches have been implemented, along with several data triangulation methods, to estimate and validate the size of the VOC sensors and monitors market and other dependent submarkets listed in this report.
- Key players in the industry and markets were identified through extensive secondary research.
- In terms of value, the industry�s supply chain and market size were determined through primary and secondary research processes.
- All percentage shares, splits, and breakdowns were determined using secondary sources and verified through primary sources.
Data Triangulation
After arriving at the overall market size from the estimation process explained above, the overall market was split into several segments and subsegments. To complete the overall market engineering process and arrive at the exact statistics for all segments and subsegments, market breakdown and data triangulation procedures were employed wherever applicable. The data were triangulated by studying various factors and trends identified from both demand and supply sides in industrial and nonindustrial verticals.
Report Objectives
The following are the major objectives of the study.
- To define, describe, and forecast the VOC sensors and monitors market, in terms of value, segmented on the basis of device type, application, and geography
- To forecast the market size, in terms of value, for various segments based on main regions� North America, Europe, Asia Pacific (APAC), and Rest of the World (RoW)
- To provide detailed information regarding drivers, restraints, opportunities, and industry-specific challenges influencing the growth of the VOC sensors and monitors market
- To strategically analyze micromarkets with respect to the individual growth trends, prospects, and contribution to the total market
- To provide a detailed overview of the value chain in the VOC sensors and monitors market
- To strategically profile the key players and comprehensively analyze their respective market positions in terms of ranking and core competencies
- To analyze growth strategies such as collaborations, mergers and acquisitions, product launches and developments, and research and development (R&D) in the VOC sensors and monitors market
Available Customizations
With the given market data, MarketsandMarkets offers customizations according to a company�s specific needs. The following customization options are available for the report:
Company Information:
- Detailed analysis and profiling of additional market players (Up to 5)


Growth opportunities and latent adjacency in VOC Sensors and Monitors Market