Waterborne Epoxy Resin Market by Type (High Molecular Weight, Low Molecular Weight), Application (Coatings, Adhesives, and Composites), End-use Industry (Construction, Automotive, Textile, Packaging, and Furniture), and Region - Global Forecasts to 2022


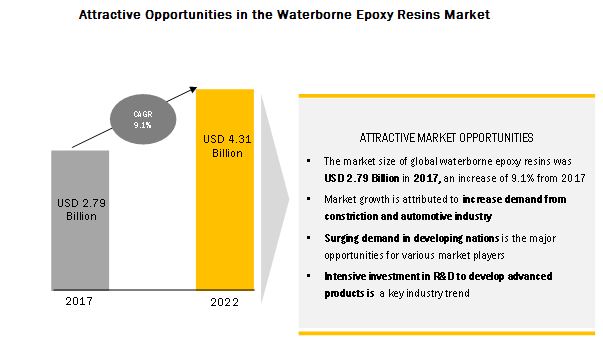
[149 Pages Report] MarketsandMarkets forecasts the waterborne epoxy resins market to grow from USD 2.54 billion in 2016, and projected to reach USD 4.31 billion by 2022, registering a CAGR of 9.1% from 2017 to 2022. The market is driven by increase in stringent environment regulations, growing construction industry, and increasing shift toward green and environment friendly products. However, the mature markets of Europe and North America are projected to inhibit the growth to some extent. The objective of the report is to define, describe, and forecast the waterborne epoxy resins market size based on type, application, end-use industry, and region.
By application, adhesives is the fastest growing segment for waterborne epoxy resins market
The waterborne epoxy resins market in the adhesives application is projected to witness the highest growth due to the growing building & construction industry and increased government investments in infrastructure projects. The growth is due to the increasing commercial use of composites in various applications such as automotive & transportation, aerospace, electronics, and wind industry. There are many drivers which are forcing the composite market to grow at a high CAGR including increase in demand of lightweight materials in transportation industry to increase the fuel efficiency, growing demand of wind energy and increasing use of composites by Boeing and Airbus in aerospace industry.
By type, low- molecular weight segment projected to register highest CAGR from 2017 to 2022
Low molecular weight waterborne epoxy resin is the fastest growing type of waterborne epoxy resin used globally. They are extensively used for coatings, adhesives & composites. They offer a relatively good abrasion resistance, improved dry performance, easy mixing and low odor. Increased government investments on commercial building & construction projects are driving the demand of low molecular weight waterborne epoxy resins, globally.
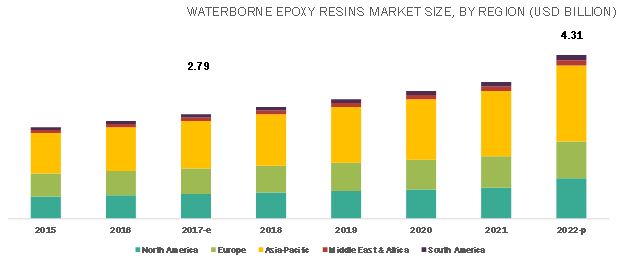
APAC dominated the waterborne epoxy resins market in 2016
Asia-Pacific has always been a strong market for waterborne epoxy resins and, globally, this market has been a leader for waterborne epoxy resin with respect to demand. This region has the presence of biggest and fastest economies in the world that is China and India. It has a relatively high growth rate as a result of its large market size and fast economic activity as compared to the other regions. The demand in this region is boosted mainly due to the growing end-use industries for the waterborne epoxy resin.
Market dynamics
Drivers: Increasing shift toward green and environmentally friendly products
Waterborne epoxy resins are environmentally friendly due to zero VOCs emission. Due to which these resins are widely used in coatings and adhesives industry. The market growth is highly influenced by the strict EU regulations for instance according to European Parliament Directive 2004/42/EC there are limitation on emissions of volatile organic compounds (VOCs) due to the usage of organic solvents in decorative paints & varnishes and vehicle refinishing products. The main purpose of Directive 1999/13/EC is to reduce the direct and indirect impacts of VOCs on human health as well as environment by setting the certain emission limits. In North America region there are also strict regulation related to VOCs emission. Such as in 1998, Energy Protection Agency (EPA) allotted a rule to Architectural and Industrial Maintenance (AIM) Coatings to limit the emission from VOCs.
Restraint: Volatility in crude oil prices
The cost of waterborne epoxy resins is a major concern for many industries over the last decade. The prices of waterborne epoxy resins are high in comparison to epoxy resins. On the other hand, the production of Bisphenol A and novolac resins is still very low. These fibers are largely used as composites, coatings and adhesives in various end-use industries such as construction, automotive, and marine. Since the waterborne epoxy resins production is quite low, this acts as the major barrier to the waterborne epoxy resins market. Another factor contributing to higher prices of waterborne epoxy resins is the generation of matrix; the production of a matrix needs expensive batch processes at high temperatures under controlled atmosphere.
Opportunity: Emergence of need for lightweight and fuel-efficient vehicles
Continuous developments across the automotive and transportation industries have created a huge demand for lightweight and fuel-efficient vehicles. For making automobiles lightweight and fuel-efficient, the companies have to use dissimilar lightweight materials such as aluminum, steel, composites, or plastics to provide it the best light weighting opportunity. The use of adhesives enables less use of fasteners, such as welds, rivets, or bolts, in a vehicle. Adhesives and composites help in decreasing the extra weight, which these metal bodies and fasteners would add to the vehicles. Also, the use of these high quality materials and adhesives increases the crash and impact resistance of vehicles, making them much safer in the event of accidents. These budding opportunities would create a huge demand for waterborne epoxy resins market during the forecast period.
Challenge: Stringent regulatory approvals required for production
The chemical industry is facing challenges from regulatory authorities in Europe and North America. Regulators such as Control of Substances Hazardous to Health (COSHH), European Union (EU), Registration, Evaluation, Authorisation and Restriction of Chemicals (REACH), Globally Harmonized System (GHS), and Environmental Protection Agency (EPA) in Europe and North America regulate the usage of waterborne epoxy adhesives in various applications. They prohibit the use of dangerous substances such as organotins, mercury, monomeric isocyanates, pyrrolidones, phthalates, nonylphenols and isocyanates in the production of adhesives & sealants. Waterborne epoxy resins manufacturers and end users have to constantly evolve their processes to comply with new policies.
Scope of the Report
|
Report Metric |
Details |
|
Market size available for years |
2015–2022 |
|
Base year considered |
2016 |
|
Forecast period |
2017–2022 |
|
Forecast units |
Million (USD) and Kilotons |
|
Segments covered |
By Type (High molecular weight,and Low molecular weight), Application (Coatings, Adhesives, Composites, and Others), End-Use Industry (Construction, Textiles, Automotive, Furniture, Packaging, and Others), and Region |
|
Geographies covered |
North America, Europe, APAC, Middle East & Africa, and South America |
|
Companies covered |
(US), Allnex GmbH (Germany), Huntsman Corporation (US), Evonik Industries AG (Germany), Olin Corporation (U.S.), Kukdo Chemical Co., Ltd. (South Korea), Aditya Birla Chemicals (Thailand) Ltd. (Thailand), Reichhold LLC (U.S.), Nan Ya Plastics Corporation (Taiwan), ADEKA Corporation (Japan), DIC Corporation (Japan), Spolchemie A.S. (Czech Republic), Resoltech (France), LEUNA-Harze GmbH (Germany), Helios Resins (Slovenia), Kumho P&B Chemicals Inc. (South Korea) |
The research report categorizes the waterborne epoxy resins to forecast the revenues and analyze the trends in each of the following sub-segments:
On the basis of type:
- High molecular weight.
- Low molecular weight.
On the basis of application:
- Adhesives
- Composites
- Coating
- Others
On the basis of End-use industry:
- Construction
- Automotive
- Textile
- Packaging
- Furniture
- Others
On the basis of region:
- North America
- Asia-Pacific
- Europe
- South America
- Middle East & Africa
Key Market Players
Hexion Inc. (US), Allnex GmbH (Germany), Huntsman Corporation (US), Evonik Industries AG (Germany), Aditya Birla Chemicals Ltd. (Thailand), Reichhold LLC (U.S.), Nan Ya Plastics Corporation (Taiwan).
Hexion, Inc. (US), Olin Corporation (US), Huntsman Corporation (US), Aditya Birla Chemicals (Thailand) Ltd., Kukdo Chemicals Co., Ltd. (South Korea), Nan Ya Plastics Corporation (Taiwan), are among the key players who are adopting several organic and inorganic growth strategies to strengthen their foothold in waterborne epoxy resins markets. These companies expanded their production facilities and acquired other businesses during between 2012 and 2016.
Recent Developments
- In April 2017, Hexion, launched two new epoxy resins to its product portfolio named EPI-REZ Resin 6521-WH-56 and EPI-REZ Resin 6531-WH-5. This development strengthened its product portfolio for coating application
- In September 2016, Allnex expanded its coating resin production line in its Shanghai Fengxian-based production facility. Under this production line, the company will produce PUD, waterborne epoxy, and alkyd resins for container, car, and other industrial coatings applications
- In May 2017, Huntsman Corporation and Clariant (Switzerland) formed a merger of equals share to form a global specialty chemical company. This merger helped the company enhance its product portfolio
- In June 2014, Allnex installed new production lines for waterborne coating resins in the Thailand facility to support the market growth in Asia-Pacific
Critical questions the report answers:
- Where will all these developments take the industry in the long term?
- What are the upcoming trends for the waterborne epoxy resins market?
- Which segment provides the most opportunity for growth?
- Who are the leading vendors operating in this market?
- What are the opportunities for new market entrants?
To speak to our analyst for a discussion on the above findings, click Speak to Analyst
 Exclusive indicates content/data unique to MarketsandMarkets and not available with any competitors.
Table of Contents
1 Introduction (Page No. - 15)
1.1 Objectives of the Study
1.2 Market Definition
1.3 Market Scope
1.3.1 Years Considered for the Study
1.4 Currency
1.5 Package Size
1.6 Limitations
1.7 Stakeholders
2 Research Methodology (Page No. - 18)
2.1 Research Data
2.1.1 Secondary Data
2.1.1.1 Key Data From Secondary Sources
2.1.2 Primary Data
2.1.2.1 Key Data From Primary Sources
2.1.2.2 Breakdown of Primary Interviews
2.2 Market Size Estimation
2.2.1 Bottom-Up Approach
2.2.2 Top-Down Approach
2.3 Data Triangulation
2.4 Assumptions
3 Executive Summary (Page No. - 25)
4 Premium Insights (Page No. - 29)
4.1 Attractive Opportunities in Waterborne Epoxy Resin Market
4.2 Waterborne Epoxy Resin Market, By End-Use Industry
4.3 Waterborne Epoxy Resin Market in Asia-Pacific, By Country and By Application
4.4 Waterborne Epoxy Resin Market, By Region
5 Market Overview (Page No. - 32)
5.1 Introduction
5.1.1 Drivers
5.1.1.1 Increasing Shift Toward Green and Environmentally Friendly Products
5.1.1.2 Rising Demand From the Construction and Automotive Industries
5.1.1.3 Increasing Use of Composites
5.1.2 Restraints
5.1.2.1 High Production Cost
5.1.3 Opportunities
5.1.3.1 Increasing Need for Lightweight and Fuel-Efficient Vehicles
5.1.4 Challenges
5.1.4.1 Stringent Regulatory Approvals Required for Production
5.2 Porter’s Five Forces
5.2.1 Threat of New Entrants
5.2.2 Threat of Substitutes
5.2.3 Bargaining Power of Buyers
5.2.4 Bargaining Power of Suppliers
5.2.5 Intensity of Competitive Rivalry
6 Macroeconomic Indicators (Page No. - 39)
6.1 Introduction
6.2 GDP Growth Rate Forecast of Major Economies
6.3 Textile Industry
6.4 Automotive Industry
6.5 Construction Industry
6.5.1 Construction Industry in North America
6.5.2 Construction Industry in Europe
6.5.3 Construction Industry in Asia-Pacific
7 Waterborne Epoxy Resin Market, By Type (Page No. - 43)
7.1 Introduction
7.2 High Molecular Weight
7.2.1 Market Estimates and Forecasts, 2016-2023 (Kiloton and USD Million)
7.3 Low Molecular Weight
7.3.1 Market Estimates and Forecasts, 2016-2023 (Kiloton and USD Million)
8 Waterborne Epoxy Resin Market, By Application (Page No. - 46)
8.1 Introduction
8.2 Coatings
8.2.1 Market Estimates and Forecasts, 2016-2023 (Kiloton and USD Million)
8.2.2 Top Coats and Self-Leveling Coatings
8.2.3 Floor Primers
8.2.4 Sealers
8.3 Adhesives
8.3.1 Market Estimates and Forecasts, 2016-2023 (Kiloton and USD Million)
8.3.2 Tie-Coats
8.3.3 Laminates
8.3.4 Primers
8.4 Composites
8.4.1 Market Estimates and Forecasts, 2016-2023 (Kiloton and USD Million)
8.4.2 Resin Infusion
8.4.3 Bonding Paste
8.4.4 Hand Lay-Up
8.4.5 Binders, Repair, Tooling, and Other Products
8.5 Others
8.5.1 Market Estimates and Forecasts, 2016-2023 (Kiloton and USD Million)
9 Waterborne Epoxy Resin Market, By End-Use Industry (Page No. - 51)
9.1 Introduction
9.2 Construction
9.2.1 Market Estimates and Forecasts, 2016-2023 (Kiloton and USD Million)
9.2.2 Decorative & Topcoat
9.2.3 Self-Leveling Floor
9.2.4 Grout & Mortar
9.2.5 Repair Systems
9.2.6 Pipelines
9.3 Textiles
9.3.1 Market Estimates and Forecasts, 2016-2023 (Kiloton and USD Million)
9.3.2 Fiber Sizing
9.3.3 Fiber Adhesive Treatment
9.3.4 Binders and Performance Treatments for Textiles/Nonwovens
9.4 Automotive
9.4.1 Market Estimates and Forecasts, 2016-2023 (Kiloton and USD Million)
9.4.2 Structural
9.4.3 Exterior
9.4.4 Upper Hood
9.4.5 Suspension System
9.5 Furniture
9.5.1 Market Estimates and Forecasts, 2016-2023 (Kiloton and USD Million)
9.6 Packaging
9.6.1 Market Estimates and Forecasts, 2016-2023 (Kiloton and USD Million)
9.6.2 Cans and Bottles
9.6.3 Mixed/Frozen Material Packaging
9.7 Others
9.7.1 Market Estimates and Forecasts, 2016-2023 (Kiloton and USD Million)
10 Waterborne Epoxy Resin Market, By Region (Page No. - 57)
10.1 Introduction
10.2 North America
10.2.1 Market Estimates and Forecasts, 2016-2023 (Kiloton and USD Million)
10.2.2 Market Estimates and Forecasts, By Application 2016-2023 (Kiloton and USD Million)
10.2.3 Market Estimates and Forecasts, By End-Use Industry 2016-2023 (Kiloton and USD Million)
10.2.1 U.S.
10.2.1.1 Market Estimates and Forecasts, By Application 2016-2023 (Kiloton and USD Million)
10.2.1.2 Market Estimates and Forecasts, By End-Use Industry 2016-2023 (Kiloton and USD Million)
10.2.2 Canada
10.2.2.1 Market Estimates and Forecasts, By Application 2016-2023 (Kiloton and USD Million)
10.2.2.2 Market Estimates and Forecasts, By End-Use Industry 2016-2023 (Kiloton and USD Million)
10.2.3 Mexico
10.2.3.1 Market Estimates and Forecasts, By Application 2016-2023 (Kiloton and USD Million)
10.2.3.2 Market Estimates and Forecasts, By End-Use Industry 2016-2023 (Kiloton and USD Million)
10.3 Asia-Pacific
10.3.1 Market Estimates and Forecasts, 2016-2023 (Kiloton and USD Million)
10.3.2 Market Estimates and Forecasts, By Application 2016-2023 (Kiloton and USD Million)
10.3.3 Market Estimates and Forecasts, By End-Use Industry 2016-2023 (Kiloton and USD Million)
10.3.1 China
10.3.1.1 Market Estimates and Forecasts, By Application 2016-2023 (Kiloton and USD Million)
10.3.1.2 Market Estimates and Forecasts, By End-Use Industry 2016-2023 (Kiloton and USD Million)
10.3.2 Japan
10.3.2.1 Market Estimates and Forecasts, By Application 2016-2023 (Kiloton and USD Million)
10.3.2.2 Market Estimates and Forecasts, By End-Use Industry 2016-2023 (Kiloton and USD Million)
10.3.3 South Korea
10.3.3.1 Market Estimates and Forecasts, By Application 2016-2023 (Kiloton and USD Million)
10.3.3.2 Market Estimates and Forecasts, By End-Use Industry 2016-2023 (Kiloton and USD Million)
10.3.4 India
10.3.4.1 Market Estimates and Forecasts, By Application 2016-2023 (Kiloton and USD Million)
10.3.4.2 Market Estimates and Forecasts, By End-Use Industry 2016-2023 (Kiloton and USD Million)
10.3.5 Taiwan
10.3.5.1 Market Estimates and Forecasts, By Application 2016-2023 (Kiloton and USD Million)
10.3.5.2 Market Estimates and Forecasts, By End-Use Industry 2016-2023 (Kiloton and USD Million)
10.3.6 Rest of Asia-Pacific
10.3.6.1 Market Estimates and Forecasts, By Application 2016-2023 (Kiloton and USD Million)
10.3.6.2 Market Estimates and Forecasts, By End-Use Industry 2016-2023 (Kiloton and USD Million)
10.4 Europe
10.4.1 Market Estimates and Forecasts, 2016-2023 (Kiloton and USD Million)
10.4.2 Market Estimates and Forecasts, By Application 2016-2023 (Kiloton and USD Million)
10.4.3 Market Estimates and Forecasts, By End-Use Industry 2016-2023 (Kiloton and USD Million)
10.4.1 Germany
10.4.1.1 Market Estimates and Forecasts, By Application 2016-2023 (Kiloton and USD Million)
10.4.1.2 Market Estimates and Forecasts, By End-Use Industry 2016-2023 (Kiloton and USD Million)
10.4.2 Italy
10.4.2.1 Market Estimates and Forecasts, By Application 2016-2023 (Kiloton and USD Million)
10.4.2.2 Market Estimates and Forecasts, By End-Use Industry 2016-2023 (Kiloton and USD Million)
10.4.3 U.K.
10.4.3.1 Market Estimates and Forecasts, By Application 2016-2023 (Kiloton and USD Million)
10.4.3.2 Market Estimates and Forecasts, By End-Use Industry 2016-2023 (Kiloton and USD Million)
10.4.4 France
10.4.4.1 Market Estimates and Forecasts, By Application 2016-2023 (Kiloton and USD Million)
10.4.4.2 Market Estimates and Forecasts, By End-Use Industry 2016-2023 (Kiloton and USD Million)
10.4.5 Belgium
10.4.5.1 Market Estimates and Forecasts, By Application 2016-2023 (Kiloton and USD Million)
10.4.5.2 Market Estimates and Forecasts, By End-Use Industry 2016-2023 (Kiloton and USD Million)
10.4.6 Rest of Europe
10.4.6.1 Market Estimates and Forecasts, By Application 2016-2023 (Kiloton and USD Million)
10.4.6.2 Market Estimates and Forecasts, By End-Use Industry 2016-2023 (Kiloton and USD Million)
10.5 Middle East & Africa
10.5.1 Market Estimates and Forecasts, 2016-2023 (Kiloton and USD Million)
10.5.2 Market Estimates and Forecasts, By Application 2016-2023 (Kiloton and USD Million)
10.5.3 Market Estimates and Forecasts, By End-Use Industry 2016-2023 (Kiloton and USD Million)
10.5.1 Saudi Arabia
10.5.1.1 Market Estimates and Forecasts, By Application 2016-2023 (Kiloton and USD Million)
10.5.1.2 Market Estimates and Forecasts, By End-Use Industry 2016-2023 (Kiloton and USD Million)
10.5.2 U.A.E.
10.5.2.1 Market Estimates and Forecasts, By Application 2016-2023 (Kiloton and USD Million)
10.5.2.2 Market Estimates and Forecasts, By End-Use Industry 2016-2023 (Kiloton and USD Million)
10.5.3 Rest of Middle East & Africa
10.5.3.1 Market Estimates and Forecasts, By Application 2016-2023 (Kiloton and USD Million)
10.5.3.2 Market Estimates and Forecasts, By End-Use Industry 2016-2023 (Kiloton and USD Million)
10.6 South America
10.6.1 Market Estimates and Forecasts, 2016-2023 (Kiloton and USD Million)
10.6.2 Market Estimates and Forecasts, By Application 2016-2023 (Kiloton and USD Million)
10.6.3 Market Estimates and Forecasts, By End-Use Industry 2016-2023 (Kiloton and USD Million)
10.6.1 Brazil
10.6.1.1 Market Estimates and Forecasts, By Application 2016-2023 (Kiloton and USD Million)
10.6.1.2 Market Estimates and Forecasts, By End-Use Industry 2016-2023 (Kiloton and USD Million)
10.6.2 Argentina
10.6.2.1 Market Estimates and Forecasts, By Application 2016-2023 (Kiloton and USD Million)
10.6.2.2 Market Estimates and Forecasts, By End-Use Industry 2016-2023 (Kiloton and USD Million)
10.6.3 Rest of South America
10.6.3.1 Market Estimates and Forecasts, By Application 2016-2023 (Kiloton and USD Million)
10.6.3.2 Market Estimates and Forecasts, By End-Use Industry 2016-2023 (Kiloton and USD Million)
11 Competitive Landscape (Page No. - 105)
11.1 Introduction
11.2 Competitive Leadership Mapping
11.2.1 Visionary Leaders
11.2.2 Dynamic Differentiators
11.2.3 Innovators
11.2.4 Emerging Companies
11.3 Competitive Benchmarking
11.3.1 Strength of Product Portfolio
11.3.2 Business Strategy Excellence
11.4 Market Ranking of Key Players
12 Company Profiles (Page No. - 110)
(Business Overview, Products Offered, Scorecard of Product Offering, Scorecard of Business Strategy, and New Product Launch)
12.1 Hexion Inc.
12.2 Allnex GmbH
12.3 Huntsman Corporation
12.4 Nan Ya Plastics Corporation
12.5 Kukdo Chemical Co., LTD.
12.6 ADEKA Corporation
12.7 Aditya Birla Chemicals (Thailand) LTD.
12.8 Evonik Industries AG
12.9 Olin Corporation
12.10 Reichhold LLC
*Details Might Not Be Captured in Case of Unlisted Companies.
12.11 Other Players
12.11.1 Baling Petrochemical Co., LTD.
12.11.2 Cardolite Corporation
12.11.3 Ciech S.A.
12.11.4 Conren
12.11.5 Dic Corporation
12.11.6 Dongguan Rong Chemical Co., LTD.
12.11.7 Helios Resins
12.11.8 Jiangsu Sanmu Group Co, LTD.
12.11.9 Joong--Ang Special Industry Co.LTD.
12.11.10 Jubail Chemical Industries Co.
12.11.11 Kumho P&B Chemicals., Inc.
12.11.12 LEUNA-Harze GmbH
12.11.13 Resoltech
12.11.14 Royce International
12.11.15 Spolchemie A.S.
13 Appendix (Page No. - 142)
13.1 Insights From Industry Experts
13.2 Discussion Guide
13.3 Knowledge Store: Marketsandmarkets Subscription Portal
13.4 Introducing RT: Real-Time Market Intelligence
13.5 Related Reports
List of Tables (127 Tables)
Table 1 Trends and Forecast of GDP Growth Rates From 2016 to 2022
Table 2 Motor Vehicle Production 2015-2016, (USD Million)
Table 3 Contribution of Construction Industry to GDP in North America, 2014-2016 (USD Billion)
Table 4 Contribution of Construction Industry to GDP in Europe, 2014-2016 (USD Billion)
Table 5 Contribution of Construction Industry to GDP in Asia-Pacific, 2014-2016 (USD Billion)
Table 6 Waterborne Epoxy Resin Market Size, By Type, 2015–2022 (Kiloton)
Table 7 Waterborne Epoxy Resin Market Size, By Type, 2015–2022 (USD Million)
Table 8 Waterborne Epoxy Resin Market Size, By Application, 2015–2022 (Kiloton)
Table 9 Waterborne Epoxy Resin Market Size, By Application, 2015–2022 (USD Million)
Table 10 Waterborne Epoxy Resin Market Size, By End-Use Industry, 2015–2022 (Kiloton)
Table 11 Waterborne Epoxy Resin Market Size, By End-Use Industry, 2015–2022 (USD Million)
Table 12 Waterborne Epoxy Resin Market Size, By Region, 2015–2022 (Kiloton)
Table 13 Waterborne Epoxy Resin Market Size, By Region, 2015–2022 (USD Million)
Table 14 North America: Waterborne Epoxy Resin Market Size, By Country, 2015–2022 (Kiloton)
Table 15 North America: Waterborne Epoxy Resin Market Size, By Country, 2015–2022 (USD Million)
Table 16 North America: Waterborne Epoxy Resin Market Size, By Application, 2015–2022 (Kiloton)
Table 17 North America: Waterborne Epoxy Resin Market Size, By Application, 2015–2022 (USD Million)
Table 18 North America: Waterborne Epoxy Resin Market Size, By End-Use Industry, 2015–2022 (Kiloton)
Table 19 North America: Waterborne Epoxy Resin Market Size, By End-Use Industry, 2015–2022 (USD Million)
Table 20 U.S.: Waterborne Epoxy Resin Market Size, By Application, 2015–2022 (Kiloton)
Table 21 U.S.: Waterborne Epoxy Resin Market Size, By Application, 2015–2022 (USD Million)
Table 22 U.S.: Waterborne Epoxy Resin Market Size, By End-Use Industry, 2015–2022 (Kiloton)
Table 23 U.S.: Waterborne Epoxy Resin Market Size, By End-Use Industry, 2015–2022 (USD Million)
Table 24 Canada: Waterborne Epoxy Resin Market Size, By Application, 2015–2022 (Kiloton)
Table 25 Canada: Waterborne Epoxy Resin Market Size, By Application, 2015–2022 (USD Million)
Table 26 Canada: Waterborne Epoxy Resin Market Size, By End-Use Industry, 2015–2022 (Kiloton)
Table 27 Canada: Waterborne Epoxy Resin Market Size, By End-Use Industry, 2015–2022 (USD Million)
Table 28 Mexico: Waterborne Epoxy Resin Market Size, By Application, 2015–2022 (Kiloton)
Table 29 Mexico: Waterborne Epoxy Resin Market Size, By Application, 2015–2022 (USD Million)
Table 30 Mexico: Waterborne Epoxy Resin Market Size, By End-Use Industry, 2015–2022 (Kiloton)
Table 31 Mexico: Waterborne Epoxy Resin Market Size, By End-Use Industry, 2015–2022 (USD Million)
Table 32 Asia-Pacific: Waterborne Epoxy Resin Market Size, By Country, 2015–2022 (Kiloton)
Table 33 Asia-Pacific: Waterborne Epoxy Resin Market Size, By Country, 2015–2022 (USD Million)
Table 34 Asia-Pacific: Waterborne Epoxy Resin Market Size, By Application, 2015–2022 (Kiloton)
Table 35 Asia-Pacific: Waterborne Epoxy Resin Market Size, By Application, 2015–2022 (USD Million)
Table 36 Asia-Pacific: Waterborne Epoxy Resin Market Size, By End-Use Industry, 2015–2022 (Kiloton)
Table 37 Asia-Pacific: Waterborne Epoxy Resin Market Size, By End-Use Industry, 2015–2022 (USD Million)
Table 38 China: Waterborne Epoxy Resin Market Size, By Application, 2015–2022 (Kiloton)
Table 39 China: Waterborne Epoxy Resin Market Size, By Application, 2015–2022 (USD Million)
Table 40 China: Waterborne Epoxy Resin Market Size, By End-Use Industry, 2015–2022 (Kiloton)
Table 41 China: Waterborne Epoxy Resin Market Size, By End-Use Industry, 2015–2022 (USD Million)
Table 42 Japan: Waterborne Epoxy Resin Market Size, By Application, 2015–2022 (Kiloton)
Table 43 Japan: Waterborne Epoxy Resin Market Size, By Application, 2015–2022 (USD Million)
Table 44 Japan: Waterborne Epoxy Resin Market Size, By End-Use Industry, 2015–2022 (Kiloton)
Table 45 Japan: Waterborne Epoxy Resin Market Size, By End-Use Industry, 2015–2022 (USD Million)
Table 46 South Korea: Waterborne Epoxy Resin Market Size, By Application, 2015–2022 (Kiloton)
Table 47 South Korea: Waterborne Epoxy Resin Market Size, By Application, 2015–2022 (USD Million)
Table 48 South Korea: Waterborne Epoxy Resin Market Size, By End-Use Industry, 2015–2022 (Kiloton)
Table 49 South Korea: Waterborne Epoxy Resin Market Size, By End-Use Industry, 2015–2022 (USD Million)
Table 50 India: Waterborne Epoxy Resin Market Size, By Application, 2015–2022 (Kiloton)
Table 51 India: Waterborne Epoxy Resin Market Size, By Application, 2015–2022 (USD Million)
Table 52 India: Waterborne Epoxy Resin Market Size, By End-Use Industry, 2015–2022 (Kiloton)
Table 53 India: Waterborne Epoxy Resin Market Size, By End-Use Industry, 2015–2022 (USD Million)
Table 54 Taiwan: Waterborne Epoxy Resin Market Size, By Application, 2015–2022 (Kiloton)
Table 55 Taiwan: Waterborne Epoxy Resin Market Size, By Application, 2015–2022 (USD Million)
Table 56 Taiwan: Waterborne Epoxy Resin Market Size, By End-Use Industry, 2015–2022 (Kiloton)
Table 57 Taiwan: Waterborne Epoxy Resin Market Size, By End-Use Industry, 2015–2022 (USD Million)
Table 58 Rest of Asia Pacific: Waterborne Epoxy Resin Market Size, By Application, 2015–2022 (Kiloton)
Table 59 Rest of Asia Pacific: Waterborne Epoxy Resin Market Size, By Application, 2015–2022 (USD Million)
Table 60 Rest of Asia Pacific: Waterborne Epoxy Resin Market Size, By End-Use Industry, 2015–2022 (Kiloton)
Table 61 Rest of Asia Pacific: Waterborne Epoxy Resin Market Size, By End-Use Industry, 2015–2022 (USD Million)
Table 62 Europe: Waterborne Epoxy Resin Market Size, By Country, 2015–2022 (Kiloton)
Table 63 Europe: Waterborne Epoxy Resin Market Size, By Country, 2015–2022 (USD Million)
Table 64 Europe: Waterborne Epoxy Resin Market Size, By Application, 2015–2022 (Kiloton)
Table 65 Europe: Waterborne Epoxy Resin Market Size, By Application, 2015–2022 (USD Million)
Table 66 Europe: Waterborne Epoxy Resin Market Size, By End-Use Industry, 2015–2022 (Kiloton)
Table 67 Europe: Waterborne Epoxy Resin Market Size, By End-Use Industry, 2015–2022 (USD Million)
Table 68 Germany: Waterborne Epoxy Resin Market Size, By Application, 2015–2022 (Kiloton)
Table 69 Germany: Waterborne Epoxy Resin Market Size, By Application, 2015–2022 (USD Million)
Table 70 Germany: Waterborne Epoxy Resin Market Size, By End-Use Industry, 2015–2022 (Kiloton)
Table 71 Germany: Waterborne Epoxy Resin Market Size, By End-Use Industry, 2015–2022 (USD Million)
Table 72 Italy: Waterborne Epoxy Resin Market Size, By Application, 2015–2022 (Kiloton)
Table 73 Italy: Waterborne Epoxy Resin Market Size, By Application, 2015–2022 (USD Million)
Table 74 Italy: Waterborne Epoxy Resin Market Size, By End-Use Industry, 2015–2022 (USD Million)
Table 75 Italy: Waterborne Epoxy Resin Market Size, By End-Use Industry, 2015–2022 (USD Million)
Table 76 U.K.: Waterborne Epoxy Resin Market Size, By Application, 2015–2022 (Kiloton)
Table 77 U.K.: Waterborne Epoxy Resin Market Size, By Application, 2015–2022 (USD Million)
Table 78 U.K.: Waterborne Epoxy Resin Market Size, By End-Use Industry, 2015–2022 (USD Million)
Table 79 U.K.: Waterborne Epoxy Resin Market Size, By End-Use Industry, 2015–2022 (USD Million)
Table 80 France: Waterborne Epoxy Resin Market Size, By Application, 2015–2022 (Kiloton)
Table 81 France: Waterborne Epoxy Resin Market Size, By Application, 2015–2022 (USD Million)
Table 82 France: Waterborne Epoxy Resin Market Size, By End-Use Industry, 2015–2022 (USD Million)
Table 83 France: Waterborne Epoxy Resin Market Size, By End-Use Industry, 2015–2022 (USD Million)
Table 84 Belgium: Waterborne Epoxy Resin Market Size, By Application, 2015–2022 (Kiloton)
Table 85 Belgium: Waterborne Epoxy Resin Market Size, By Application, 2015–2022 (USD Million)
Table 86 Belgium: Waterborne Epoxy Resin Market Size, By End-Use Industry, 2015–2022 (USD Million)
Table 87 Belgium: Waterborne Epoxy Resin Market Size, By End-Use Industry, 2015–2022 (USD Million)
Table 88 Rest of Europe: Waterborne Epoxy Resin Market Size, By Application, 2015–2022 (Kiloton)
Table 89 Rest of Europe: Waterborne Epoxy Resin Market Size, By Application, 2015–2022 (USD Million)
Table 90 Rest of Europe: Waterborne Epoxy Resin Market Size, By End-Use Industry, 2015–2022 (USD Million)
Table 91 Rest of Europe: Waterborne Epoxy Resin Market Size, By End-Use Industry, 2015–2022 (USD Million)
Table 92 Middle East & Africa: Waterborne Epoxy Resin Market Size, By Country, 2015–2022 (Kiloton)
Table 93 Middle East & Africa: Waterborne Epoxy Resin Market Size, By Country, 2015–2022 (USD Million)
Table 94 Middle East & Africa: Waterborne Epoxy Resin Market Size, By Application, 2015–2022 (Kiloton)
Table 95 Middle East & Africa: Waterborne Epoxy Resin Market Size, By Application, 2015–2022 (USD Million)
Table 96 Middle East & Africa: Waterborne Epoxy Resin Market Size, By End-Use Industry, 2015–2022 (Kiloton)
Table 97 Middle East & Africa: Waterborne Epoxy Resin Market Size, By End-Use Industry, 2015–2022 (USD Million)
Table 98 Saudi Arabia: Waterborne Epoxy Resin Market Size, By Application, 2015–2022 (Kiloton)
Table 99 Saudi Arabia: Waterborne Epoxy Resin Market Size, By Application, 2015–2022 (USD Million)
Table 100 Saudi Arabia: Waterborne Epoxy Resin Market Size, By End-Use Industry, 2015–2022 (Kiloton)
Table 101 Saudi Arabia: Waterborne Epoxy Resin Market Size, By End-Use Industry, 2015–2022 (USD Million)
Table 102 U.A.E.: Waterborne Epoxy Resin Market Size, By Application, 2015–2022 (Kiloton)
Table 103 U.A.E.: Waterborne Epoxy Resin Market Size, By Application, 2015–2022 (USD Million)
Table 104 U.A.E.: Waterborne Epoxy Resin Market Size, By End-Use Industry, 2015–2022 (Kiloton)
Table 105 U.A.E.: Waterborne Epoxy Resin Market Size, By End-Use Industry, 2015–2022 (USD Million)
Table 106 Rest of Middle East & Africa: Waterborne Epoxy Resin Market Size, By Application, 2015–2022 (Kiloton)
Table 107 Rest of Middle East & Africa: Waterborne Epoxy Resin Market Size, By Application, 2015–2022 (USD Million)
Table 108 Rest of Middle East & Africa.: Waterborne Epoxy Resin Market Size, By End-Use Industry, 2015–2022 (Kiloton)
Table 109 Rest of Middle East & Africa.: Waterborne Epoxy Resin Market Size, By End-Use Industry, 2015–2022 (USD Million)
Table 110 South America: Waterborne Epoxy Resin Market Size, By Country, 2015–2022 (Kiloton)
Table 111 South America: Waterborne Epoxy Resin Market Size, By Country, 2015–2022 (USD Million)
Table 112 South America: Waterborne Epoxy Resin Market Size, By Application, 2015–2022 (Kiloton)
Table 113 South America: Waterborne Epoxy Resin Market Size, By Application, 2015–2022 (USD Million)
Table 114 South America: Waterborne Epoxy Resin Market Size, By End-Use Industry, 2015–2022 (Kiloton)
Table 115 South America: Waterborne Epoxy Resin Market Size, By End-Use Industry, 2015–2022 (USD Million)
Table 116 Brazil: Waterborne Epoxy Resin Market Size, By Application, 2015–2022 (Kiloton)
Table 117 Brazil: Waterborne Epoxy Resin Market Size, By Application, 2015–2022 (USD Million)
Table 118 Brazil: Waterborne Epoxy Resinmarket Size, By End-Use Industry, 2015–2022 (Kiloton)
Table 119 Brazil: Waterborne Epoxy Resin Market Size, By End-Use Industry, 2015–2022 (USD Million)
Table 120 Argentina: Waterborne Epoxy Resin Market Size, By Application, 2015–2022 (Kiloton)
Table 121 Argentina: Waterborne Epoxy Resin Market Size, By Application, 2015–2022 (USD Million)
Table 122 Argentina: Waterborne Epoxy Resin Market Size, By End-Use Industry, 2015–2022 (Kiloton)
Table 123 Argentina: Waterborne Epoxy Resin Market Size, By End-Use Industry, 2015–2022 (USD Million)
Table 124 Rest of South America: Waterborne Epoxy Resin Market Size, By Application, 2015–2022 (Kiloton)
Table 125 Rest of South America: Waterborne Epoxy Resin Market Size, By Application, 2015–2022 (USD Million)
Table 126 Rest of South America: Waterborne Epoxy Resin Market Size, By End-Use Industry, 2015–2022 (Kiloton)
Table 127 Rest of South America: Waterborne Epoxy Resin Market Size, By End-Use Industry, 2015–2022 (USD Million)
List of Figures (31 Figures )
Figure 1 Waterborne Epoxy Resin: Market Segmentation
Figure 2 Waterborne Epoxy Resin Market: Research Design
Figure 3 Market Size Estimation: Bottom-Up Approach
Figure 4 Market Size Estimation Methodology: Top-Down Approach
Figure 5 Waterborne Epoxy Resin Market: Data Triangulation
Figure 6 Construction to Be the Largest End-Use Industry in the Waterborne Epoxy Resin Market Through 2022
Figure 7 High Molecular Weight Type is Expected to Dominate the Waterborne Epoxy Resin Market Throughout the Forecast Period
Figure 8 Coatings Application is Expected to Dominate the Waterborne Epoxy Resin Market Throughout the Forecast Period
Figure 9 China is Accounted for the Largest Market Share for Waterborne Epoxy Resin, By Country, 2016 (USD Million)
Figure 10 Asia-Pacific Accounted for the Largest Market Share in 2016 (USD Million)
Figure 11 Surging Demand in Developing Economies to Provide Growth Opportunities for the Market
Figure 12 Construction to Be the Major End-Use Industry in the Waterborne Epoxy Resin Market Between 2017 and 2022
Figure 13 China Accounted for the Largest Market Share in 2016
Figure 14 Asia-Pacific Accounted for the Largest Share of the Waterborne Epoxy Resin Market in 2016, in Terms of Volume
Figure 15 Drivers, Restraints, Opportunities, and Challenges in Waterborne Epoxy Resin Market
Figure 16 Waterborne Epoxy Resin: Porter’s Five Forces Analysis
Figure 17 World Textile Trade Data, 2005–2014
Figure 18 World Textile Exporters, 2015
Figure 19 High Molecular Weight Segment to Dominate the Waterborne Epoxy Resin Market During Forecast Period
Figure 20 Adhesives to Be the Fastest-Growing Application Segment Between 2017 and 2022
Figure 21 Construction Projected to Be the Largest End-Use Industry of Waterborne Epoxy Resin Market
Figure 22 India to Register Highest CAGR in Waterborne Epoxy Resin Market Between 2017 and 2022
Figure 23 U.S. Was the Largest Waterborne Epoxy Resin Market in North American Region in 2016
Figure 24 Coatings Application to Drive the Waterborne Epoxy Resin Market Growth in Asia-Pacific
Figure 25 Competitive Leadership Mapping, 2016
Figure 26 Waterborne Epoxy Resin Market Ranking, 2016
Figure 27 Hexion Inc.: Company Snapshot
Figure 28 Huntsman Corporation: Company Snapshot
Figure 29 ADEKA Corporation: Company Snapshot
Figure 30 Evonik Industries AG: Company Snapshot
Figure 31 Olin Corporation: Company Snapshot


Growth opportunities and latent adjacency in Waterborne Epoxy Resin Market
Looking for water borne epoxy market for coating application for industrial and protective coatings and OEM