Wearable Injectors Market: Growth, Size, Share, and Trends

Report Code MD 6659
Published in Jan, 2024, By MarketsandMarkets™
Download PDF

Choose License Type

Buy Report Now Inquire Before Buying

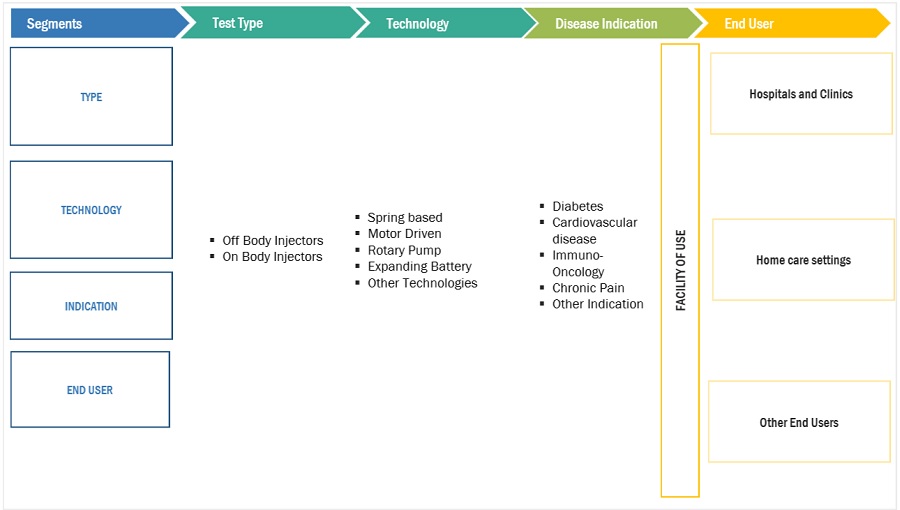
Wearable Injectors Market by Type(On-body, Off-body), Technology (Spring, Motor Drive, Expanding Battery, Rotary Pump), Indications (Diabetes, Immuno- Oncology, Cardiovascular, Chronic Pain), End Users (Hospital & Clinic, Homecare) & Region - Global Forecast to 2029

Overview

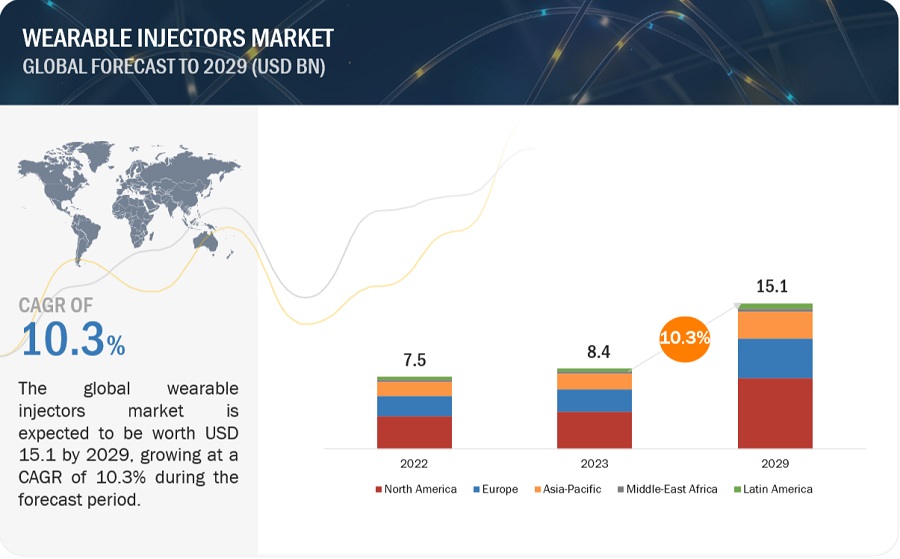
The global wearable injectors market is projected to reach USD 15.1 billion by 2029 from USD 8.4 billion in 2023, at a CAGR of 10.3%. Growth in this market is largely driven by the a number of variables, including the rise in elderly population, the prevalence of chronic diseases, technological developments, and growing concern over needle stick injuries, are blamed for the growth. The market was dominated by North America, but there were also significant development prospects in Europe. Becton, Dickinson and Company, Johnson & Johnson Services, Inc., and Amgen, Inc. are some of the major companies in the market. With multiple large companies and a moderate level of competition, technological improvements are driving the industry. Chronic disorders like diabetes, autoimmune diseases, and pain management are a constant pulse in the landscape. The multitude of unfulfilled requirements provides an ideal environment for creative thinking, and wearable injectors, with their accurate dosing and intuitive features, ideally balance the need for convenience and adherence.

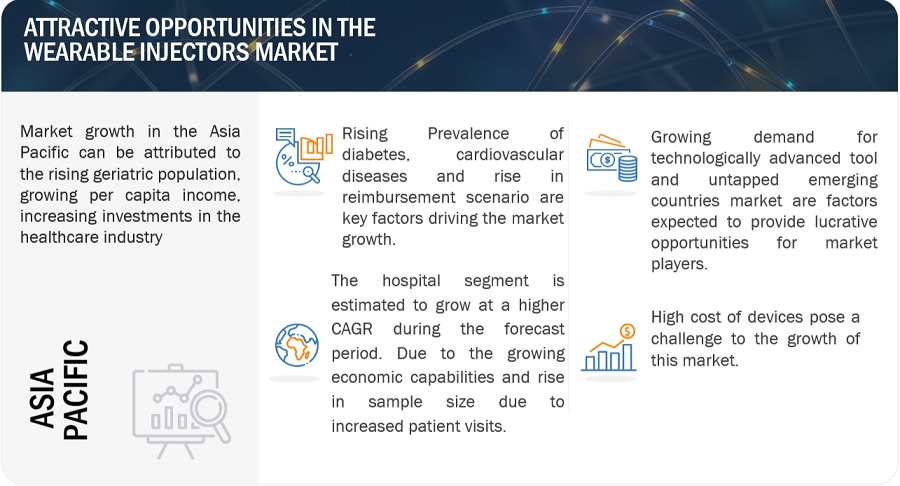
Attractive Opportunities in the Wearable Injectors Market

ASIA PACIFIC

Market growth in the Asia Pacific can be attributed to the rising geriatric population, growing per capita income, increasing investments in the healthcare industry

Rising Prevalence of diabetes, cardiovascular diseases and rise in reimbursement scenario are key factors driving the market growth.

The hospital segment is estimated to grow at a higher CAGR during the forecast period. Due to the growing economic capabilities and rise in sample size due to increased patient visits.

Growing demand for technologically advanced tool and untapped emerging countries market are factors expected to provide lucrative opportunities for market players

High cost of devices pose a challenge to the growth of this market.

Global Wearable Injectors Market Dynamics

Driver: High prevalence of diabetes

With an estimated 463 million people worldwide expected to be diagnosed with diabetes in 2019, there is an increasing need for creative approaches to medicine administration. With their accurate dosage and intuitive functions, wearable injectors present a strong alternative to conventional syringes, streamlining the administration of insulin and improving adherence. The game-changing potential of wearable injectors, which give patients more ease and autonomy in managing their diabetes—a tune that resonates strongly with those who want autonomy and control. Conventional injections may cause discomfort and anxiety. With its pleasant hum in place of a harsh sting, wearable injectors reduce discomfort and free patients to concentrate on their health rather than the technical aspects of their therapy. Wearable injectors can be used as self-monitoring tools in addition to medicine dispensers, capturing and transferring data with ease. Thus, it is expected to boost the market.

Restraint: Oral insulin as alternative method of drug delivery

A more harmonious coexistence is promised by oral insulin, which makes treatment inconspicuous and easy to take. In the management of diabetes, missing dosages can cause severe discord. Because it may be easier to take, oral insulin has the potential to increase treatment effectiveness and improve long-term health outcomes. Pain at the injection site and needle anxiety are common discordant notes for patients. Oral insulin may provide a softer, more enjoyable tune, enhancing both the therapeutic experience and general health. Researchers are developing new strategies to shield insulin from the severe conditions of the digestive tract so that it can enter the bloodstream and be absorbed efficiently. In this technological opera, enteric coatings, nanoparticles, and microspheres are the main characters. The goal of research is to make the gut lining more permeable so that insulin can enter the bloodstream more readily.


Opportunity: Increased adoption of on body wearable injectors

Novel approaches are encouraged by the wide range of chronic conditions, such as diabetes, autoimmune diseases, and pain management. With their longer wear periods and intuitive features, on-body injectors strike the ideal balance between the patient's desire for more control over their health and the convenience and consistency of drug delivery. The emphasis on patient autonomy and self-management in healthcare is growing. This trend is nicely complemented by on-body injectors, which give patients more comfort and autonomy over their therapy. Patients looking for discreet and practical drug delivery options are driving market demand as a result of this shift in focus. The early emphasis on insulin delivery in the therapy of diabetes is quickly giving way to a more diverse range of uses. Recent research is looking on using on-body injectors to deliver painkillers, antibiotics, and vaccines.

Challenges: Needlestick injuries

Needle stick injuries (NSIs) have the potential to provide a serious obstacle to the market expansion for wearable injectors. Healthcare personnel are at significant risk of contracting bloodborne infections such as HIV, hepatitis B, and hepatitis C from these unintentional needle pricks or punctures caused by tainted needles. Hospitals and physicians are forced to bear the financial burden of costly post-exposure prophylaxis (PEP) treatments, medical monitoring, and potential lawsuits as a result of NSIs. The emotional weight of worry, dread, and possible stigmatization that NSIs place on healthcare personnel can have an adverse effect on their well-being and level of job satisfaction. Wearable injectors may come under fire due to unfavorable media coverage or high-profile NSI incidents, which could raise questions about their safety and discourage patients and healthcare professionals from using them.

Global Wearable Injectors Market Ecosystem Analysis

Leading players in this market include well-established and financially stable service providers of wearable injectors. These companies have been operating in the market for several years and possess a diversified product portfolio, advanced technologies, and strong global presence


The off body segment accounted for the highest CAGR in of the product and services segment.

No more uncomfortable skin contact or noticeable spots. Off-body injectors provide a more discrete and comfortable experience for patients, especially those with sensitive skin or self-consciousness about appearance. These injectors are usually worn on belts or linked to garments. More scheduling and dose flexibility are made possible by these injectors, which can provide medication at precise times and durations. This is especially helpful for illnesses that call for precise timing or longer release. Off-body devices reduce the chance of missed doses from discomfort or patch removal. To further improve medication consistency, some even have smart connectivity that can send reminders and track adherence. Off-body injectors are being investigated for a wide range of pharmaceuticals, including complicated biologics, painkillers, vaccinations, and antibiotics, in addition to insulin administration.

The rotary pump technology segment is estimated to grow at a higher CAGR during the forecast period.

In contrast to spring-based systems, rotary pumps dispense medications with unmatched control and precision. Their fluid mechanics minimize mistake risk and maximize therapeutic efficacy by ensuring consistent flow even with low-volume or viscous medicines. For high-stakes drugs like biologics, where dosing precision is critical, this dependability is very important. One tune is not the limit for rotary pumps. Compared to previous technologies, they can accommodate a greater range of drug viscosities and volumes, allowing them to adapt to a variety of therapeutic applications. Consider insulin, immunizations, biologics, and analgesics; the options are as endless as a gifted musician's repertory. By prolonging wear periods and lowering the need for frequent replacements, rotary pumps complement the requirement for an effective battery life. Increased patient comfort and satisfaction are a result of its economical performance.

The hospitals and clinics segment is expected to grow at the highest CAGR during the forecast period.

Wearable injectors complement the hospital's requirement for more efficient drug delivery. They shorten injection times and improve workflows by enabling nurses and professionals to provide medication quickly and consistently. By increasing efficiency, this reduces costs and frees up critical time for patient care. In hospital settings, missing doses can cause treatment plans to fall through and raise readmission rates. Wearable injectors guarantee constant medicine delivery, reducing missed doses and enhancing patient outcomes with their longer wear times and intelligent reminders. Patients and healthcare professionals alike commend this better adherence. Hospitals are emphasizing patient self-management and autonomy more and more. Wearable injectors give patients more autonomy by letting them administer their own medications, particularly for long-term diseases that require frequent dose adjustments.

APAC is Estimated to be the Fastest-Growing Regional Market for Wearable Iinjectors.

The global wearable injectors market is segmented into Asia Pacific, North America, Europe, Latin America, and the Middle East & Africa. In 2022, APAC is estimated to be the fastest-growing regional market for wearable injectors market. The aging population of Asia Pacific is large and growing, which is driving up demand for chronic illness treatment programs. Wearable injectors efficiently fulfill this demand with their accurate and convenient delivery of medication, especially for autoimmune illnesses, diabetes, and pain management. The region is home to a thriving IT industry, with a number of nations setting the standard for production and innovation. This encourages the quick development and use of innovative wearable injector technologies, driving the market ahead. Wearable injector accessibility is expanding thanks to increasingly advantageous reimbursement regulations in nations like China and Japan. A substantial entry hurdle for patients and healthcare providers is eliminated by this financial harmonization.
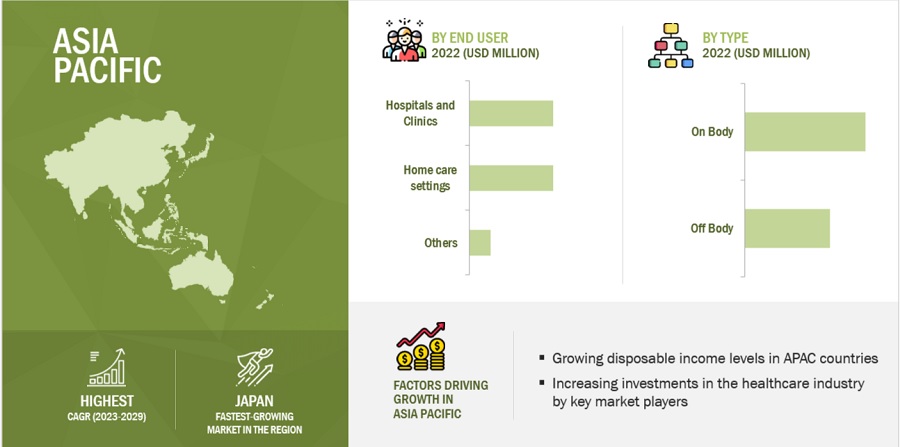
HIGHEST CAGR MARKET IN 2022
JAPAN FASTEST GROWING MARKET IN THE REGION

Recent Developments of Wearable Injectors industry

  • In February 2023, Insulet Corporation acquired the assets of Automated Glucose Control LLC (AGC), a company focused on developing and commercializing best-in-class automated insulin delivery technology. The company was involved in the development of Omnipod (Insulet’s star product)
  • In January 2023, Tandem acquired infusion set developer, Capillary Biomedical.
  • In July 2022, Becton Dickinson and Company acquired Parata Systems. This acquisition will boost the market growth of BD.
  • In January 2022, Enable Injections received The company received USD 215 million Series C funding. The funding will provide additional resources to onboard Enable Injections along with important new pharma partner programs and accelerate their commercialization programs and platforms with existing pharma partners.
  • In September 2021, Ypsomed AG, YpsoDose single-use injector is an electromechanical pre-filled and pre-assembled patch device for 10 mL glass cartridges. Needle insertion, injection, end of injection feedback, and needle safety steps are all performed automatically. The needle remains hidden at all times and is made safe after injection and device removal.

Key Market Players

Want to explore hidden markets that can drive new revenue in Wearable Injectors Market?

Scope of the Report

Report Attribute Details
Market size available for years 2021–2029
Forecast units Value (USD Million/Billion)
Segments Covered Type, Technology, Indication, End-user, and Region
Geographies covered North America, Europe, Asia Pacific, Latin America

Key Questions Addressed by the Report

What are emerging trends in the wearable injectors market?
Increasing adoption of wearable drug delivery technologies and growing collaborations with stakeholders are expected to continue the adoption of diagnostic tests in the market.
What are the drivers and opportunities for the wearable injectors market?
Increasing prevalence of diabetes, technological advancements, favorable reimbursement, are driver of the market. Increasing R&D, and adoption of on body injectors are opportunities in this market.
What are the challenges in the wearable injectors market?
Misuse of injection pens and needlestick injuries are challenges to market growth.
Which is the leading type segment with the wearable injectors market?
The leading type segment is on body injectors owing to its increased adoption among end users, ease of administration of drug, comfortable design, and precise and accuracy of delivery of medication.
Which segment is estimated to grow at the highest CAGR in wearable injectors market by the end user?
Hospitals registered the highest growth in this market due to the economic capabilities, increased use of technologically advanced systems, during patient admission rates, and rise in the number of hospitals.


Personalize This Research

  • Triangulate with your Own Data
  • Get Data as per your Format and Definition
  • Gain a Deeper Dive on a Specific Application, Geography, Customer or Competitor
  • Any level of Personalization
Request A Free Customisation

Let Us Help You

  • What are the Known and Unknown Adjacencies Impacting the Wearable Injectors Market
  • What will your New Revenue Sources be?
  • Who will be your Top Customer; what will make them switch?
  • Defend your Market Share or Win Competitors
  • Get a Scorecard for Target Partners
Customized Workshop Request

Table of Contents

Exclusive indicates content/data unique to MarketsandMarkets and not available with any competitors.

TITLE
PAGE NO
INTRODUCTION
24
RESEARCH METHODOLOGY
30
EXECUTIVE SUMMARY
43
PREMIUM INSIGHTS
48
MARKET OVERVIEW
52
  • 5.1 INTRODUCTION
  • 5.2 MARKET DYNAMICS
    DRIVERS
    - Increasing prevalence of diabetes among geriatric population
    - Technological advancements in wearable injectors
    - Use of artificial intelligence in diabetes care devices
    - Favorable reimbursement scenario
    - Development of low-complexity and easy-to-use wearable injectors
    RESTRAINTS
    - High cost of wearable injectors and lack of reimbursement plans in emerging economies
    - Increased focus on alternative drug delivery methods
    OPPORTUNITIES
    - Increased number of R&D activities and strategic partnerships
    - Growing adoption of on-body wearable injectors
    CHALLENGES
    - Lack of training and education for using new delivery devices
  • 5.3 INDUSTRY TRENDS
    INCREASING ADOPTION OF WEARABLE DRUG DELIVERY SYSTEMS
    RISING NUMBER OF COLLABORATIONS AMONG STAKEHOLDERS
    INTEGRATION OF LIQUID SILICONE RUBBER TECHNOLOGY IN WEARABLE HEALTH MONITORING AND DRUG DELIVERY DEVICES
  • 5.4 TECHNOLOGY ANALYSIS
  • 5.5 SUPPLY CHAIN ANALYSIS
  • 5.6 VALUE CHAIN ANALYSIS
  • 5.7 ECOSYSTEM MARKET/MAP
  • 5.8 TRADE ANALYSIS
  • 5.9 PORTER’S FIVE FORCES ANALYSIS
    INTENSITY OF COMPETITIVE RIVALRY
    BARGAINING POWER OF SUPPLIERS
    BARGAINING POWER OF BUYERS
    THREAT OF SUBSTITUTES
    THREAT OF NEW ENTRANTS
  • 5.10 TARIFF & REGULATORY LANDSCAPE
    REGULATORY ANALYSIS
    - North America
    - Europe
    - Asia Pacific
    - Latin America
    - Middle East
    - Africa
    REGULATORY BODIES, GOVERNMENT AGENCIES, AND OTHER ORGANIZATIONS
  • 5.11 PATENT ANALYSIS
    PATENT PUBLICATION TRENDS FOR WEARABLE INJECTORS
    TOP APPLICANTS (COMPANIES) FOR WEARABLE INJECTOR PATENTS
    JURISDICTION ANALYSIS: TOP APPLICANTS (COUNTRIES) FOR WEARABLE INJECTOR PATENTS
  • 5.12 PRICING ANALYSIS
    AVERAGE SELLING PRICE OF WEARABLE INJECTORS, BY KEY PLAYER
  • 5.13 KEY CONFERENCES & EVENTS, 2023–2024
  • 5.14 KEY STAKEHOLDERS & BUYING CRITERIA
    KEY STAKEHOLDERS IN BUYING PROCESS
    BUYING CRITERIA
  • 5.15 TRENDS/DISRUPTIONS IMPACTING CUSTOMERS’ BUSINESSES
  • 5.16 UNMET NEEDS
  • 5.17 ADJACENT MARKET ANALYSIS
WEARABLE INJECTORS MARKET, BY TYPE
77
  • 6.1 INTRODUCTION
  • 6.2 ON-BODY WEARABLE INJECTORS
    ON-BODY WEARABLE INJECTORS TO COMMAND LARGEST MARKET SHARE DURING FORECAST PERIOD
  • 6.3 OFF-BODY WEARABLE INJECTORS
    EASY AND CONTINUOUS DRUG DELIVERY AT REGULAR INTERVALS TO DRIVE MARKET
  • 6.4 DEVICE-ONLY WEARABLE INJECTORS
    EASE OF ADMINISTRATION TO SUPPORT MARKET GROWTH
WEARABLE INJECTORS MARKET, BY TECHNOLOGY
82
  • 7.1 INTRODUCTION
  • 7.2 SPRING-BASED TECHNOLOGY
    MINIMAL DISCOMFORT AND ANXIETY FOR PATIENTS WITH NEEDLE PHOBIA TO PROPEL MARKET
  • 7.3 MOTOR-DRIVEN TECHNOLOGY
    TECHNOLOGICAL ADVANCEMENTS AND IMPROVED SAFETY TO AID MARKET GROWTH
  • 7.4 ROTARY PUMP TECHNOLOGY
    HIGHER PRECISION AND BETTER CONTROL OVER VISCOUS MEDICINES TO SUPPORT MARKET GROWTH
  • 7.5 EXPANDING BATTERY TECHNOLOGY
    REDUCED PRODUCTION COST AND EASE OF USAGE TO DRIVE MARKET
  • 7.6 OTHER TECHNOLOGIES
WEARABLE INJECTORS MARKET, BY INDICATION
89
  • 8.1 INTRODUCTION
  • 8.2 DIABETES
    HIGH PREVALENCE OF DIABETES TO DRIVE MARKET
  • 8.3 IMMUNO-ONCOLOGY
    INCREASING NUMBER OF CANCER CASES TO BOOST MARKET GROWTH
  • 8.4 CARDIOVASCULAR DISEASES
    RISING CASES OF HEART FAILURE AMONG ADULTS TO PROPEL MARKET GROWTH
  • 8.5 CHRONIC PAINS
    INCREASING RESEARCH IN PAIN MANAGEMENT TO SUPPORT MARKET GROWTH
  • 8.6 OTHER DISEASES
WEARABLE INJECTORS MARKET, BY END USER
97
  • 9.1 INTRODUCTION
  • 9.2 HOSPITALS AND CLINICS
    HOSPITALS AND CLINICS TO COMMAND LARGEST END-USER SEGMENT OF END USER DURING STUDY PERIOD
  • 9.3 HOME CARE SETTINGS
    RISING PREFERENCE FOR SELF-ADMINISTRATION OF MEDICINE TO DRIVE MARKET
  • 9.4 OTHER END USERS
WEARABLE INJECTORS MARKET, BY REGION
102
  • 10.1 INTRODUCTION
  • 10.2 NORTH AMERICA
    NORTH AMERICA: RECESSION IMPACT
    US
    - Favorable reimbursement scenario and high prevalence of chronic diseases to drive market
    CANADA
    - Growing biologics market to propel market growth
  • 10.3 EUROPE
    EUROPE: RECESSION IMPACT
    GERMANY
    - Favorable government policies for drug development and approval to aid market growth
    FRANCE
    - Increased prevalence of diabetes and favorable insurance coverage by SHI to drive market
    UK
    - Rising focus on development and promotion of biosimilars and biologics to propel market growth
    ITALY
    - Rising prevalence of diabetes to support market growth
    SPAIN
    - Increased preference for less painful drug delivery systems among geriatric population to drive market
    REST OF EUROPE
  • 10.4 ASIA PACIFIC
    ASIA PACIFIC: RECESSION IMPACT
    JAPAN
    - Increasing number of patients suffering from diabetes, CVD, and chronic conditions to drive market
    CHINA
    - Favorable government initiatives and improved access to advanced healthcare to drive market
    INDIA
    - Growing burden of diabetes and increasing need to reduce healthcare costs to propel market
    AUSTRALIA
    - Favorable government initiatives for diabetes treatment to drive market
    SOUTH KOREA
    - Increased number of government initiatives for diabetes management to drive market
    REST OF ASIA PACIFIC
  • 10.5 LATIN AMERICA
    LATIN AMERICA: RECESSION IMPACT
    BRAZIL
    - Increasing number of government initiatives for improving healthcare sector to boost market
    MEXICO
    - Increasing prevalence of diabetes and obesity-related diseases to boost market growth
    REST OF LATIN AMERICA
  • 10.6 MIDDLE EAST & AFRICA
    MIDDLE EAST & AFRICA: RECESSION IMPACT
    GCC COUNTRIES
    - Growing incidence of chronic diseases to propel market
    REST OF MIDDLE EAST & AFRICA
COMPETITIVE LANDSCAPE
168
  • 11.1 INTRODUCTION
  • 11.2 KEY STRENGTHS/RIGHT TO WIN
  • 11.3 REVENUE SHARE ANALYSIS
  • 11.4 MARKET SHARE ANALYSIS
  • 11.5 MANUFACTURERS OF WEARABLE DEVICES
  • 11.6 COMPANY EVALUATION MATRIX
    STARS
    EMERGING LEADERS
    PERVASIVE PLAYERS
    PARTICIPANTS
    COMPANY FOOTPRINT
  • 11.7 START-UP/SME EVALUATION MATRIX
    PROGRESSIVE COMPANIES
    RESPONSIVE COMPANIES
    DYNAMIC COMPANIES
    STARTING BLOCKS
    COMPETITIVE BENCHMARKING
  • 11.8 R&D EXPENDITURE
  • 11.9 BRAND/PRODUCT COMPARISON
    AMGEN INC.
    MEDTRONIC
    INSULET CORPORATION
    TANDEM DIABETES CARE, INC.
    UNITED THERAPEUTICS
    ABBVIE INC.
    GERRESHEIMER AG
  • 11.10 INVESTMENT AND FUNDING SCENARIO
    FUNDING IN WEARABLE INJECTORS MARKET, BY INDICATION
  • 11.11 COMPANY FINANCIAL METRICS
  • 11.12 COMPETITIVE SCENARIO
    PRODUCT LAUNCHES & APPROVALS
    DEALS
    OTHER DEVELOPMENTS
COMPANY PROFILES
185
  • 12.1 KEY PLAYERS
    AMGEN INC.
    - Business overview
    - Products/Services/Solutions offered
    - Recent developments
    - MnM view
    MEDTRONIC
    - Business overview
    - Products/Services/Solutions offered
    - Recent developments
    - MnM view
    INSULET CORPORATION
    - Business overview
    - Products/Services/Solutions offered
    - Recent developments
    - MnM view
    TANDEM DIABETES CARE, INC.
    - Business overview
    - Products/Services/Solutions offered
    - Recent developments
    - MnM view
    UNITED THERAPEUTICS CORPORATION
    - Business overview
    - Products/Services/Solutions offered
    - Recent developments
    - MnM view
    ABBVIE INC.
    - Business overview
    - Products/Services/Solutions offered
    - Recent developments
    GERRESHEIMER AG
    - Business overview
    - Products/Services/Solutions offered
    - Recent developments
    BECTON, DICKISON AND COMPANY
    - Business overview
    - Products/Services/Solutions offered
    - Recent developments
    WEST PHARMACEUTICAL SERVICES, INC.
    - Business overview
    - Products/Services/Solutions offered
    YPSOMED HOLDING AG
    - Business overview
    - Products/Services/Solutions offered
    - Recent developments
    ENABLE INJECTIONS
    - Business overview
    - Products/Services/Solutions offered
    - Recent developments
    SUBCUJECT APS
    - Business overview
    - Products/Services/Solutions offered
    CEQUR SIMPLICITY
    - Business overview
    - Products/Services/Solutions offered
    - Recent developments
    MANNKIND CORPORATION
    - Business overview
    - Products/Services/Solutions offered
    - Recent developments
    SONCEBOZ
    - Business overview
    - Products/Services/Solutions offered
    CC BIO
    - Business overview
    - Products/Services/Solutions offered
    - Recent developments
    ELCAM DRUG DELIVERY DEVICES
    - Business overview
    - Products/Services/Solutions offered
    - Recent developments
    STEVANATO GROUP
    - Business overview
    - Products/Services/Solutions offered
    DEBIOTECH SA
    - Business overview
    - Products/Services/Solutions offered
  • 12.2 OTHER PLAYERS
    BEXSON BIOMEDICAL
    NEMERA
    LTS LOHMANN THERAPIE-SYSTEME AG
    KYMANOX CORPORATION
    NOVO ENGINEERING
    EOFLOW CO., LTD.
APPENDIX
229
  • 13.1 DISCUSSION GUIDE
  • 13.2 KNOWLEDGESTORE: MARKETSANDMARKETS’ SUBSCRIPTION PORTAL
  • 13.3 CUSTOMIZATION OPTIONS
  • 13.4 RELATED REPORTS
  • 13.5 AUTHOR DETAILS
LIST OF TABLES
 
  • TABLE 1 EXCHANGE RATES UTILIZED FOR CONVERSION TO USD
  • TABLE 2 RISK ASSESSMENT: WEARABLE INJECTORS MARKET
  • TABLE 3 TOP FIVE COUNTRIES WITH HIGHEST NUMBER OF DIABETES PATIENTS (20–79 YEARS), 2021 VS. 2045
  • TABLE 4 RECENT COLLABORATIONS IN WEARABLE INJECTORS MARKET
  • TABLE 5 IMPORT AND EXPORT DATA FOR WEARABLE INJECTORS, BY COUNTRY
  • TABLE 6 PORTER’S FIVE FORCES ANALYSIS: WEARABLE INJECTORS MARKET
  • TABLE 7 NORTH AMERICA: REGULATORY BODIES, GOVERNMENT AGENCIES, AND OTHER ORGANIZATIONS
  • TABLE 8 EUROPE: REGULATORY BODIES, GOVERNMENT AGENCIES, AND OTHER ORGANIZATIONS
  • TABLE 9 ASIA PACIFIC: REGULATORY BODIES, GOVERNMENT AGENCIES, AND OTHER ORGANIZATIONS
  • TABLE 10 LATIN AMERICA: REGULATORY BODIES, GOVERNMENT AGENCIES, AND OTHER ORGANIZATIONS
  • TABLE 11 MIDDLE EAST: REGULATORY BODIES, GOVERNMENT AGENCIES, AND OTHER ORGANIZATIONS
  • TABLE 12 AVERAGE SELLING PRICE OF WEARABLE INJECTORS, BY KEY PLAYERS, 2022
  • TABLE 13 DETAILED LIST OF KEY CONFERENCES & EVENTS IN WEARABLE INJECTORS MARKET, 2023–2024
  • TABLE 14 INFLUENCE OF STAKEHOLDERS ON BUYING PROCESS FOR TOP THREE DISEASES (%)
  • TABLE 15 KEY BUYING CRITERIA FOR TOP THREE DISEASES
  • TABLE 16 WEARABLE INJECTORS MARKET, BY TYPE, 2021–2029 (USD MILLION)
  • TABLE 17 WEARABLE INJECTORS MARKET FOR ON-BODY WEARABLE INJECTORS, BY COUNTRY, 2021–2029 (USD MILLION)
  • TABLE 18 WEARABLE INJECTORS MARKET FOR OFF-BODY WEARABLE INJECTORS, BY COUNTRY, 2021–2029 (USD MILLION)
  • TABLE 19 WEARABLE INJECTORS MARKET FOR DEVICE-ONLY WEARABLE INJECTORS, BY COUNTRY, 2021–2029 (USD MILLION)
  • TABLE 20 WEARABLE INJECTORS MARKET, BY TECHNOLOGY, 2021–2029 (USD MILLION)
  • TABLE 21 WEARABLE INJECTORS MARKET FOR SPRING-BASED TECHNOLOGY, BY COUNTRY, 2021–2029 (USD MILLION)
  • TABLE 22 WEARABLE INJECTORS MARKET FOR MOTOR-DRIVEN TECHNOLOGY, BY COUNTRY, 2021–2029 (USD MILLION)
  • TABLE 23 WEARABLE INJECTORS MARKET FOR ROTARY PUMP TECHNOLOGY, BY COUNTRY, 2021–2029 (USD MILLION)
  • TABLE 24 WEARABLE INJECTORS MARKET FOR EXPANDING BATTERY TECHNOLOGY, BY COUNTRY, 2021–2029 (USD MILLION)
  • TABLE 25 WEARABLE INJECTORS MARKET FOR OTHER TECHNOLOGIES, BY COUNTRY, 2021–2029 (USD MILLION)
  • TABLE 26 WEARABLE INJECTORS MARKET, BY INDICATION, 2021–2029 (USD MILLION)
  • TABLE 27 INSULIN DEVICES AVAILABLE FOR DIABETIC PATIENTS
  • TABLE 28 WEARABLE INJECTORS MARKET FOR DIABETES, BY COUNTRY, 2021–2029 (USD MILLION)
  • TABLE 29 WEARABLE INJECTORS MARKET FOR IMMUNO-ONCOLOGY, BY COUNTRY, 2021–2029 (USD MILLION)
  • TABLE 30 WEARABLE INJECTORS MARKET FOR CARDIOVASCULAR DISEASES, BY COUNTRY, 2021–2029 (USD MILLION)
  • TABLE 31 WEARABLE INJECTORS MARKET FOR CHRONIC PAINS, BY COUNTRY, 2021–2029 (USD MILLION)
  • TABLE 32 WEARABLE INJECTORS MARKET FOR OTHER DISEASES, BY COUNTRY, 2021–2029 (USD MILLION)
  • TABLE 33 WEARABLE INJECTORS MARKET, BY END USER, 2021–2029 (USD MILLION)
  • TABLE 34 WEARABLE INJECTORS MARKET FOR HOSPITALS AND CLINICS, BY COUNTRY, 2021–2029 (USD MILLION)
  • TABLE 35 WEARABLE INJECTORS MARKET FOR HOME CARE SETTINGS, BY COUNTRY, 2021–2029 (USD MILLION)
  • TABLE 36 WEARABLE INJECTORS MARKET FOR OTHER END USERS, BY COUNTRY, 2021–2029 (USD MILLION)
  • TABLE 37 WEARABLE INJECTORS MARKET, BY REGION, 2021–2029 (USD MILLION)
  • TABLE 38 NORTH AMERICA: WEARABLE INJECTORS MARKET, BY COUNTRY, 2021–2029 (USD MILLION)
  • TABLE 39 NORTH AMERICA: WEARABLE INJECTORS MARKET, BY TYPE, 2021–2029 (USD MILLION)
  • TABLE 40 NORTH AMERICA: WEARABLE INJECTORS MARKET, BY TECHNOLOGY, 2021–2029 (USD MILLION)
  • TABLE 41 NORTH AMERICA: WEARABLE INJECTORS MARKET, BY INDICATION, 2021–2029 (USD MILLION)
  • TABLE 42 NORTH AMERICA: WEARABLE INJECTORS MARKET, BY END USER, 2021–2029 (USD MILLION)
  • TABLE 43 US: KEY MACROINDICATORS
  • TABLE 44 US: WEARABLE INJECTORS MARKET, BY TYPE, 2021–2029 (USD MILLION)
  • TABLE 45 US: WEARABLE INJECTORS MARKET, BY TECHNOLOGY, 2021–2029 (USD MILLION)
  • TABLE 46 US: WEARABLE INJECTORS MARKET, BY INDICATION, 2021–2029 (USD MILLION)
  • TABLE 47 US: WEARABLE INJECTORS MARKET, BY END USER, 2021–2029 (USD MILLION)
  • TABLE 48 CANADA: KEY MACROINDICATORS
  • TABLE 49 CANADA: WEARABLE INJECTORS MARKET, BY TYPE, 2021–2029 (USD MILLION)
  • TABLE 50 CANADA: WEARABLE INJECTORS MARKET, BY TECHNOLOGY, 2021–2029 (USD MILLION)
  • TABLE 51 CANADA: WEARABLE INJECTORS MARKET, BY INDICATION, 2021–2029 (USD MILLION)
  • TABLE 52 CANADA: WEARABLE INJECTORS MARKET, BY END USER, 2021–2029 (USD MILLION)
  • TABLE 53 EUROPE: WEARABLE INJECTORS MARKET, BY COUNTRY, 2021–2029 (USD MILLION)
  • TABLE 54 EUROPE: WEARABLE INJECTORS MARKET, BY TYPE, 2021–2029 (USD MILLION)
  • TABLE 55 EUROPE: WEARABLE INJECTORS MARKET, BY TECHNOLOGY, 2021–2029 (USD MILLION)
  • TABLE 56 EUROPE: WEARABLE INJECTORS MARKET, BY INDICATION, 2021–2029 (USD MILLION)
  • TABLE 57 EUROPE: WEARABLE INJECTORS MARKET, BY END USER, 2021–2029 (USD MILLION)
  • TABLE 58 GERMANY: KEY MACROINDICATORS
  • TABLE 59 GERMANY: WEARABLE INJECTORS MARKET, BY TYPE, 2021–2029 (USD MILLION)
  • TABLE 60 GERMANY: WEARABLE INJECTORS MARKET, BY TECHNOLOGY, 2021–2029 (USD MILLION)
  • TABLE 61 GERMANY: WEARABLE INJECTORS MARKET, BY INDICATION, 2021–2029 (USD MILLION)
  • TABLE 62 GERMANY: WEARABLE INJECTORS MARKET, BY END USER, 2021–2029 (USD MILLION)
  • TABLE 63 FRANCE: KEY MACROINDICATORS
  • TABLE 64 FRANCE: WEARABLE INJECTORS MARKET, BY TYPE, 2021–2029 (USD MILLION)
  • TABLE 65 FRANCE: WEARABLE INJECTORS MARKET, BY TECHNOLOGY, 2021–2029 (USD MILLION)
  • TABLE 66 FRANCE: WEARABLE INJECTORS MARKET, BY INDICATION, 2021–2029 (USD MILLION)
  • TABLE 67 FRANCE: WEARABLE INJECTORS MARKET, BY END USER, 2021–2029 (USD MILLION)
  • TABLE 68 UK: KEY MACROINDICATORS
  • TABLE 69 UK: WEARABLE INJECTORS MARKET, BY TYPE, 2021–2029 (USD MILLION)
  • TABLE 70 UK: WEARABLE INJECTORS MARKET, BY TECHNOLOGY, 2021–2029 (USD MILLION)
  • TABLE 71 UK: WEARABLE INJECTORS MARKET, BY INDICATION, 2021–2029 (USD MILLION)
  • TABLE 72 UK: WEARABLE INJECTORS MARKET, BY END USER, 2021–2029 (USD MILLION)
  • TABLE 73 ITALY: MACROECONOMIC INDICATORS
  • TABLE 74 ITALY: WEARABLE INJECTORS MARKET, BY TYPE, 2021–2029 (USD MILLION)
  • TABLE 75 ITALY: WEARABLE INJECTORS MARKET, BY TECHNOLOGY, 2021–2029 (USD MILLION)
  • TABLE 76 ITALY: WEARABLE INJECTORS MARKET, BY INDICATION, 2021–2029 (USD MILLION)
  • TABLE 77 ITALY: WEARABLE INJECTORS MARKET, BY END USER, 2021–2029 (USD MILLION)
  • TABLE 78 SPAIN: MACROECONOMIC INDICATORS
  • TABLE 79 SPAIN: WEARABLE INJECTORS MARKET, BY TYPE, 2021–2029 (USD MILLION)
  • TABLE 80 SPAIN: WEARABLE INJECTORS MARKET, BY TECHNOLOGY, 2021–2029 (USD MILLION)
  • TABLE 81 SPAIN: WEARABLE INJECTORS MARKET, BY INDICATION, 2021–2029 (USD MILLION)
  • TABLE 82 SPAIN: WEARABLE INJECTORS MARKET, BY END USER, 2021–2029 (USD MILLION)
  • TABLE 83 REST OF EUROPE: WEARABLE INJECTORS MARKET, BY TYPE, 2021–2029 (USD MILLION)
  • TABLE 84 REST OF EUROPE: WEARABLE INJECTORS MARKET, BY TECHNOLOGY, 2021–2029 (USD MILLION)
  • TABLE 85 REST OF EUROPE: WEARABLE INJECTORS MARKET, BY INDICATION, 2021–2029 (USD MILLION)
  • TABLE 86 REST OF EUROPE: WEARABLE INJECTORS MARKET, BY END USER, 2021–2029 (USD MILLION)
  • TABLE 87 ASIA PACIFIC: WEARABLE INJECTORS MARKET, BY COUNTRY, 2021–2029 (USD MILLION)
  • TABLE 88 ASIA PACIFIC: WEARABLE INJECTORS MARKET, BY TYPE, 2021–2029 (USD MILLION)
  • TABLE 89 ASIA PACIFIC: WEARABLE INJECTORS MARKET, BY TECHNOLOGY, 2021–2029 (USD MILLION)
  • TABLE 90 ASIA PACIFIC: WEARABLE INJECTORS MARKET, BY INDICATION, 2021–2029 (USD MILLION)
  • TABLE 91 ASIA PACIFIC: WEARABLE INJECTORS MARKET, BY END USER, 2021–2029 (USD MILLION)
  • TABLE 92 JAPAN: MACROECONOMIC INDICATORS
  • TABLE 93 JAPAN: WEARABLE INJECTORS MARKET, BY TYPE, 2021–2029 (USD MILLION)
  • TABLE 94 JAPAN: WEARABLE INJECTORS MARKET, BY TECHNOLOGY, 2021–2029 (USD MILLION)
  • TABLE 95 JAPAN: WEARABLE INJECTORS MARKET, BY INDICATION, 2021–2029 (USD MILLION)
  • TABLE 96 JAPAN: WEARABLE INJECTORS MARKET, BY END USER, 2021–2029 (USD MILLION)
  • TABLE 97 CHINA: MACROECONOMIC INDICATORS
  • TABLE 98 CHINA: WEARABLE INJECTORS MARKET, BY TYPE, 2021–2029 (USD MILLION)
  • TABLE 99 CHINA: WEARABLE INJECTORS MARKET, BY TECHNOLOGY, 2021–2029 (USD MILLION)
  • TABLE 100 CHINA: WEARABLE INJECTORS MARKET, BY INDICATION, 2021–2029 (USD MILLION)
  • TABLE 101 CHINA: WEARABLE INJECTORS MARKET, BY END USER, 2021–2029 (USD MILLION)
  • TABLE 102 INDIA: MACROECONOMIC INDICATORS
  • TABLE 103 INDIA: WEARABLE INJECTORS MARKET, BY TYPE, 2021–2029 (USD MILLION)
  • TABLE 104 INDIA: WEARABLE INJECTORS MARKET, BY TECHNOLOGY, 2021–2029 (USD MILLION)
  • TABLE 105 INDIA: WEARABLE INJECTORS MARKET, BY INDICATION, 2021–2029 (USD MILLION)
  • TABLE 106 INDIA: WEARABLE INJECTORS MARKET, BY END USER, 2021–2029 (USD MILLION)
  • TABLE 107 AUSTRALIA: MACROECONOMIC INDICATORS
  • TABLE 108 AUSTRALIA: WEARABLE INJECTORS MARKET, BY TYPE, 2021–2029 (USD MILLION)
  • TABLE 109 AUSTRALIA: WEARABLE INJECTORS MARKET, BY TECHNOLOGY, 2021–2029 (USD MILLION)
  • TABLE 110 AUSTRALIA: WEARABLE INJECTORS MARKET, BY INDICATION, 2021–2029 (USD MILLION)
  • TABLE 111 AUSTRALIA: WEARABLE INJECTORS MARKET, BY END USER, 2021–2029 (USD MILLION)
  • TABLE 112 SOUTH KOREA: KEY MACROINDICATORS
  • TABLE 113 SOUTH KOREA: WEARABLE INJECTORS MARKET, BY TYPE, 2021–2029 (USD MILLION)
  • TABLE 114 SOUTH KOREA: WEARABLE INJECTORS MARKET, BY TECHNOLOGY, 2021–2029 (USD MILLION)
  • TABLE 115 SOUTH KOREA: WEARABLE INJECTORS MARKET, BY INDICATION, 2021–2029 (USD MILLION)
  • TABLE 116 SOUTH KOREA: WEARABLE INJECTORS MARKET, BY END USER, 2021–2029 (USD MILLION)
  • TABLE 117 REST OF ASIA PACIFIC: WEARABLE INJECTORS MARKET, BY TYPE, 2021–2029 (USD MILLION)
  • TABLE 118 REST OF ASIA PACIFIC: WEARABLE INJECTORS MARKET, BY TECHNOLOGY, 2021–2029 (USD MILLION)
  • TABLE 119 REST OF ASIA PACIFIC: WEARABLE INJECTORS MARKET, BY INDICATION, 2021–2029 (USD MILLION)
  • TABLE 120 REST OF ASIA PACIFIC: WEARABLE INJECTORS MARKET, BY END USER, 2021–2029 (USD MILLION)
  • TABLE 121 LATIN AMERICA: WEARABLE INJECTORS MARKET, BY COUNTRY, 2021–2029 (USD MILLION)
  • TABLE 122 LATIN AMERICA: WEARABLE INJECTORS MARKET, BY TYPE, 2021–2029 (USD MILLION)
  • TABLE 123 LATIN AMERICA: WEARABLE INJECTORS MARKET, BY TECHNOLOGY, 2021–2029 (USD MILLION)
  • TABLE 124 LATIN AMERICA: WEARABLE INJECTORS MARKET, BY INDICATION, 2021–2029 (USD MILLION)
  • TABLE 125 LATIN AMERICA: WEARABLE INJECTORS MARKET, BY END USER, 2021–2029 (USD MILLION)
  • TABLE 126 BRAZIL: MACROECONOMIC INDICATORS
  • TABLE 127 BRAZIL: WEARABLE INJECTORS MARKET, BY TYPE, 2021–2029 (USD MILLION)
  • TABLE 128 BRAZIL: WEARABLE INJECTORS MARKET, BY TECHNOLOGY, 2021–2029 (USD MILLION)
  • TABLE 129 BRAZIL: WEARABLE INJECTORS MARKET, BY INDICATION, 2021–2029 (USD MILLION)
  • TABLE 130 BRAZIL: WEARABLE INJECTORS MARKET, BY END USER, 2021–2029 (USD MILLION)
  • TABLE 131 MEXICO: KEY MACROINDICATORS
  • TABLE 132 MEXICO: WEARABLE INJECTORS MARKET, BY TYPE, 2021–2029 (USD MILLION)
  • TABLE 133 MEXICO: WEARABLE INJECTORS MARKET, BY TECHNOLOGY, 2021–2029 (USD MILLION)
  • TABLE 134 MEXICO: WEARABLE INJECTORS MARKET, BY INDICATION, 2021–2029 (USD MILLION)
  • TABLE 135 MEXICO: WEARABLE INJECTORS MARKET, BY END USER, 2021–2029 (USD MILLION)
  • TABLE 136 REST OF LATIN AMERICA: WEARABLE INJECTORS MARKET, BY TYPE, 2021–2029 (USD MILLION)
  • TABLE 137 REST OF LATIN AMERICA: WEARABLE INJECTORS MARKET, BY TECHNOLOGY, 2021–2029 (USD MILLION)
  • TABLE 138 REST OF LATIN AMERICA: WEARABLE INJECTORS MARKET, BY INDICATION, 2021–2029 (USD MILLION)
  • TABLE 139 REST OF LATIN AMERICA: WEARABLE INJECTORS MARKET, BY END USER, 2021–2029 (USD MILLION)
  • TABLE 140 MIDDLE EAST & AFRICA: WEARABLE INJECTORS MARKET, BY REGION, 2021–2029 (USD MILLION)
  • TABLE 141 MIDDLE EAST & AFRICA: WEARABLE INJECTORS MARKET, BY TYPE, 2021–2029 (USD MILLION)
  • TABLE 142 MIDDLE EAST & AFRICA: WEARABLE INJECTORS MARKET, BY TECHNOLOGY, 2021–2029 (USD MILLION)
  • TABLE 143 MIDDLE EAST & AFRICA: WEARABLE INJECTORS MARKET, BY INDICATION, 2021–2029 (USD MILLION)
  • TABLE 144 MIDDLE EAST & AFRICA: WEARABLE INJECTORS MARKET, BY END USER, 2021–2029 (USD MILLION)
  • TABLE 145 GCC COUNTRIES: WEARABLE INJECTORS MARKET, BY TYPE, 2021–2029 (USD MILLION)
  • TABLE 146 GCC COUNTRIES: WEARABLE INJECTORS MARKET, BY TECHNOLOGY, 2021–2029 (USD MILLION)
  • TABLE 147 GCC COUNTRIES: WEARABLE INJECTORS MARKET, BY INDICATION, 2021–2029 (USD MILLION)
  • TABLE 148 GCC COUNTRIES: WEARABLE INJECTORS MARKET, BY END USER, 2021–2029 (USD MILLION)
  • TABLE 149 REST OF MIDDLE EAST & AFRICA: WEARABLE INJECTORS MARKET, BY TYPE, 2021–2029 (USD MILLION)
  • TABLE 150 REST OF MIDDLE EAST & AFRICA: WEARABLE INJECTORS MARKET, BY TECHNOLOGY, 2021–2029 (USD MILLION)
  • TABLE 151 REST OF MIDDLE EAST & AFRICA: WEARABLE INJECTORS MARKET, BY INDICATION, 2021–2029 (USD MILLION)
  • TABLE 152 REST OF MIDDLE EAST & AFRICA: WEARABLE INJECTORS MARKET, BY END USER, 2021–2029 (USD MILLION)
  • TABLE 153 LIST OF KEY MANUFACTURERS OF WEARABLE DEVICES
  • TABLE 154 WEARABLE INJECTORS MARKET: OVERALL FOOTPRINT
  • TABLE 155 WEARABLE INJECTORS MARKET: PRODUCT FOOTPRINT
  • TABLE 156 WEARABLE INJECTORS MARKET: REGIONAL FOOTPRINT
  • TABLE 157 DETAILED LIST OF KEY START-UPS/SMES
  • TABLE 158 BRAND/PRODUCT COMPARISON OF KEY PLAYERS
  • TABLE 159 FUNDING IN WEARABLE INJECTORS MARKET, BY INDICATION
  • TABLE 160 WEARABLE INJECTORS MARKET: PRODUCT LAUNCHES & APPROVALS, 2020–2024
  • TABLE 161 WEARABLE INJECTORS MARKET: DEALS, 2020–2024
  • TABLE 162 WEARABLE INJECTORS MARKET: OTHER DEVELOPMENTS, 2020–2024
  • TABLE 163 AMGEN INC.: COMPANY OVERVIEW
  • TABLE 164 AMGEN INC.: DEALS, 2020–2024
  • TABLE 165 AMGEN INC.: OTHER DEVELOPMENTS, 2020–2024
  • TABLE 166 MEDTRONIC: COMPANY OVERVIEW
  • TABLE 167 MEDTRONIC: PRODUCT LAUNCHES & APPROVALS, 2020–2024
  • TABLE 168 MEDTRONIC: DEALS, 2020–2024
  • TABLE 169 INSULET CORPORATION: COMPANY OVERVIEW
  • TABLE 170 INSULET CORPORATION: PRODUCT LAUNCHES & APPROVALS, 2020–2024
  • TABLE 171 INSULET CORPORATION: DEALS, 2020–2024
  • TABLE 172 TANDEM DIABETES CARE, INC.: COMPANY OVERVIEW
  • TABLE 173 TANDEM DIABETES CARE, INC.: DEALS, 2020–2024
  • TABLE 174 UNITED THERAPEUTICS CORPORATION: COMPANY OVERVIEW
  • TABLE 175 UNITED THERAPEUTICS CORPORATION: DEALS, 2020–2024
  • TABLE 176 ABBVIE INC.: COMPANY OVERVIEW
  • TABLE 177 ABBVIE INC.: PRODUCT LAUNCHES & APPROVALS, 2020–2024
  • TABLE 178 GERRESHEIMER AG: COMPANY OVERVIEW
  • TABLE 179 GERRESHEIMER AG: PRODUCT LAUNCHES & APPROVALS, 2020–2024
  • TABLE 180 GERRESHEIMER AG: DEALS, 2020–2024
  • TABLE 181 BECTON, DICKINSON AND COMPANY: COMPANY OVERVIEW
  • TABLE 182 BECTON, DICKINSON AND COMPANY: DEALS, 2020–2024
  • TABLE 183 BECTON, DICKINSON AND COMPANY: OTHER DEVELOPMENTS, 2020–2024
  • TABLE 184 WEST PHARMACEUTICAL SERVICES, INC.: COMPANY OVERVIEW
  • TABLE 185 YPSOMED HOLDING AG: COMPANY OVERVIEW
  • TABLE 186 YPSOMED HOLDING AG: PRODUCT LAUNCHES & APPROVALS, 2020–2024
  • TABLE 187 YPSOMED HOLDING AG: DEALS, 2020–2024
  • TABLE 188 YPSOMED HOLDING AG: OTHER DEVELOPMENTS, 2020–2024
  • TABLE 189 ENABLE INJECTIONS: COMPANY OVERVIEW
  • TABLE 190 ENABLE INJECTIONS: PRODUCT LAUNCHES & APPROVALS, 2020–2024
  • TABLE 191 ENABLE INJECTIONS: DEALS, 2020–2024
  • TABLE 192 ENABLE INJECTIONS: OTHER DEVELOPMENTS, 2020–2024
  • TABLE 193 SUBCUJECT APS: COMPANY OVERVIEW
  • TABLE 194 CEQUR SIMPLICITY: COMPANY OVERVIEW
  • TABLE 195 CEQUR SIMPLICITY: OTHER DEVELOPMENTS, 2020–2024
  • TABLE 196 MANNKIND CORPORATION: COMPANY OVERVIEW
  • TABLE 197 MANNKIND CORPORATION: DEALS, 2020–2024
  • TABLE 198 MANNKIND CORPORATION: OTHER DEVELOPMENTS, 2020–2024
  • TABLE 199 SONCEBOZ: COMPANY OVERVIEW
  • TABLE 200 CC BIO: COMPANY OVERVIEW
  • TABLE 201 CC BIO: DEALS, 2020–2024
  • TABLE 202 ELCAM DRUG DELIVERY DEVICES: COMPANY OVERVIEW
  • TABLE 203 ELCAM DRUG DELIVERY DEVICES: DEALS, 2020–2024
  • TABLE 204 STEVANATO GROUP: COMPANY OVERVIEW
  • TABLE 205 DEBIOTECH SA: COMPANY OVERVIEW
LIST OF FIGURES
 
  • FIGURE 1 RESEARCH DESIGN
  • FIGURE 2 PRIMARY SOURCES
  • FIGURE 3 BREAKDOWN OF PRIMARY INTERVIEWS: BY COMPANY TYPE, DESIGNATION, AND REGION
  • FIGURE 4 BREAKDOWN OF PRIMARY INTERVIEWS: BY END USER, DESIGNATION, AND REGION
  • FIGURE 5 BREAKDOWN OF PRIMARY INTERVIEWS: SUPPLY-SIDE AND DEMAND-SIDE PARTICIPANTS
  • FIGURE 6 SUPPLY-SIDE MARKET SIZE ESTIMATION: REVENUE SHARE ANALYSIS
  • FIGURE 7 REVENUE SHARE ANALYSIS ILLUSTRATION: AMGEN INC.
  • FIGURE 8 SUPPLY-SIDE ANALYSIS OF TOP COMPANIES: WEARABLE INJECTORS MARKET (2022)
  • FIGURE 9 CAGR PROJECTIONS FROM ANALYSIS OF DRIVERS, RESTRAINTS, OPPORTUNITIES, AND CHALLENGES, 2023–2029
  • FIGURE 10 CAGR PROJECTIONS: SUPPLY-SIDE ANALYSIS
  • FIGURE 11 TOP-DOWN APPROACH
  • FIGURE 12 MARKET DATA TRIANGULATION
  • FIGURE 13 WEARABLE INJECTORS MARKET, BY TYPE, 2023 VS. 2029 (USD MILLION)
  • FIGURE 14 WEARABLE INJECTORS MARKET, BY TECHNOLOGY, 2023 VS. 2029 (USD MILLION)
  • FIGURE 15 WEARABLE INJECTORS MARKET, BY INDICATION, 2023 VS. 2029 (USD MILLION)
  • FIGURE 16 WEARABLE INJECTORS MARKET, BY END USER, 2023 VS. 2029 (USD MILLION)
  • FIGURE 17 REGIONAL SNAPSHOT OF WEARABLE INJECTORS MARKET
  • FIGURE 18 INCREASING PREVALENCE OF CHRONIC DISEASES AND RISING HEALTHCARE EXPENDITURE TO DRIVE MARKET
  • FIGURE 19 CHINA AND HOSPITALS AND CLINICS ACCOUNTED FOR LARGEST SHARE OF ASIA PACIFIC MARKET IN 2022
  • FIGURE 20 US TO REGISTER HIGHEST MARKET GROWTH RATE DURING FORECAST PERIOD
  • FIGURE 21 EMERGING ECONOMIES TO REGISTER HIGHER GROWTH RATES DURING STUDY PERIOD
  • FIGURE 22 DRIVERS, RESTRAINTS, OPPORTUNITIES, & CHALLENGES: WEARABLE INJECTORS MARKET
  • FIGURE 23 SUPPLY CHAIN ANALYSIS: WEARABLE INJECTORS MARKET
  • FIGURE 24 VALUE CHAIN ANALYSIS: WEARABLE INJECTORS MARKET
  • FIGURE 25 ECOSYSTEM MARKET/MAP: WEARABLE INJECTORS MARKET
  • FIGURE 26 PATENT PUBLICATION TRENDS (JANUARY 2018–MAY 2023)
  • FIGURE 27 TOP APPLICANT COMPANIES FOR WEARABLE INJECTOR PATENTS, 2018–2023
  • FIGURE 28 JURISDICTION ANALYSIS: TOP APPLICANT COUNTRIES FOR WEARABLE INJECTOR PATENTS, 2018–2023
  • FIGURE 29 INFLUENCE OF STAKEHOLDERS ON BUYING PROCESS FOR TOP THREE DISEASES
  • FIGURE 30 KEY BUYING CRITERIA FOR TOP THREE DISEASES
  • FIGURE 31 ADJACENT MARKETS TO WEARABLE INJECTORS MARKET
  • FIGURE 32 WEARABLE INJECTORS MARKET: REGIONAL SNAPSHOT
  • FIGURE 33 NORTH AMERICA: WEARABLE INJECTORS MARKET SNAPSHOT
  • FIGURE 34 ASIA PACIFIC: WEARABLE INJECTORS MARKET SNAPSHOT
  • FIGURE 35 STRATEGIES ADOPTED BY KEY PLAYERS IN WEARABLE INJECTORS MARKET, 2020–2024
  • FIGURE 36 REVENUE SHARE ANALYSIS OF KEY PLAYERS, 2018–2022
  • FIGURE 37 MARKET SHARE ANALYSIS OF KEY PLAYERS, 2022
  • FIGURE 38 COMPANY EVALUATION MATRIX, 2022
  • FIGURE 39 START-UP/SME EVALUATION MATRIX, 2022
  • FIGURE 40 R&D EXPENDITURE OF KEY PLAYERS, 2021 VS. 2022
  • FIGURE 41 FUNDING IN WEARABLE INJECTORS MARKET SOARED IN 2022
  • FIGURE 42 MOST VALUED WEARABLE INJECTORS FIRMS IN 2022 (USD BILLION)
  • FIGURE 43 FINANCIAL METRICS OF KEY COMPANIES, 2022
  • FIGURE 44 AMGEN INC.: COMPANY SNAPSHOT (2022)
  • FIGURE 45 MEDTRONIC: COMPANY SNAPSHOT (2022)
  • FIGURE 46 INSULET CORPORATION: COMPANY SNAPSHOT (2022)
  • FIGURE 47 TANDEM DIABETES CARE, INC.: COMPANY SNAPSHOT (2022)
  • FIGURE 48 UNITED THERAPEUTICS CORPORATION: COMPANY SNAPSHOT (2022)
  • FIGURE 49 ABBVIE INC.: COMPANY SNAPSHOT (2022)
  • FIGURE 50 GERRESHEIMER AG: COMPANY SNAPSHOT (2022)
  • FIGURE 51 BECTON, DICKINSON AND COMPANY: COMPANY SNAPSHOT (2022)
  • FIGURE 52 WEST PHARMACEUTICAL SERVICES, INC.: COMPANY SNAPSHOT (2022)
  • FIGURE 53 YPSOMED HOLDING AG: COMPANY SNAPSHOT (2022)
  • FIGURE 54 MANNKIND CORPORATION: COMPANY SNAPSHOT (2022)

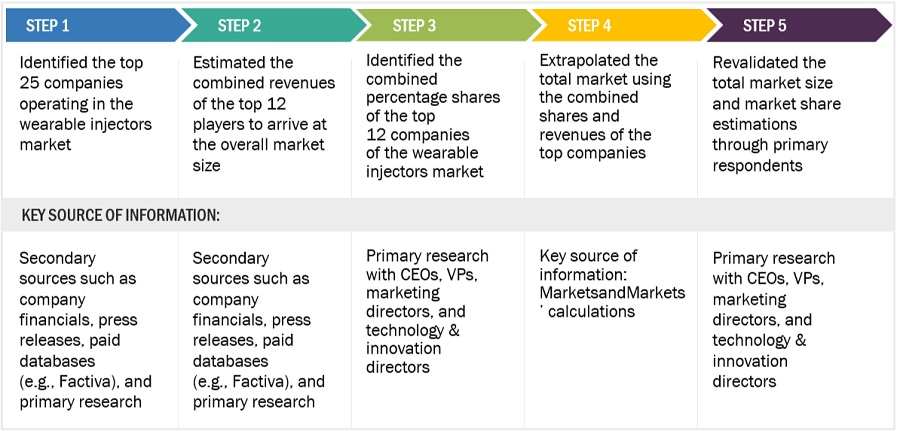
The market size for wearable injectors market was estimated using four main methods in this study. The market, as well as its peer and parent markets, were the subject of extensive research. The subsequent phase involved doing primary research to confirm these conclusions, presumptions, and estimates with industry professionals across the value chain. Top-down and bottom-up strategies were both used for estimating the value market. The market size of segments and subsegments was then estimated using market breakdown and data triangulation processes.

Secondary Research

There were several secondary sources used in this study, including directories, databases like Bloomberg Business, Factiva, and Dun & Bradstreet, white papers, annual reports, corporate house documents, investor presentations, and firm SEC filings. To find and gather data for the detailed, technical, market-focused, and commercial analysis of the wearable injectors market, secondary research was carried out. Relevant information on major companies, market classification and segmentation according to industry trends down to the most basic level, and significant changes regarding market and technological views were also obtained. Additionally, utilizing secondary research, a database of the important industry executives was created.

Primary Research

To gather qualitative and quantitative data for this study, a variety of sources from the supply and demand sides were interviewed during the main research phase. CEOs, vice presidents, marketing and sales directors, business development managers, technology, and innovation directors of wearable injectors market manufacturing businesses, key opinion leaders, suppliers, and distributors are the main sources on the supply side.

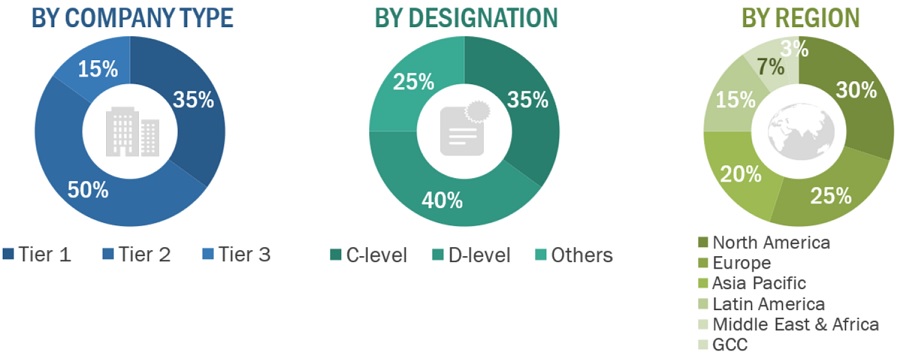
Tiers are defined based on a company’s total revenue. As of 2022: Tier 1= >USD 2 billion, Tier 2 = USD 50 million to USD 2 billion, and Tier 3= USD 50 million.

About the assumptions considered for the study, To know download the pdf brochure

Market Size Estimation

The market size for wearable injectors market was calculated using data from four different sources, as will be discussed below. Each technique concluded and a weighted average of the four ways was calculated based on the number of assumptions each approach made. The market size for wearable injectors market was calculated using data from four distinct sources, as will be discussed below:

Data Triangulation

The entire market was split up into several segments when the market size was determined. Data triangulation and market breakdown processes were used where necessary to complete the entire market engineering process and arrive at the precise statistics for all segments.

Approach to derive the market size and estimate market growth

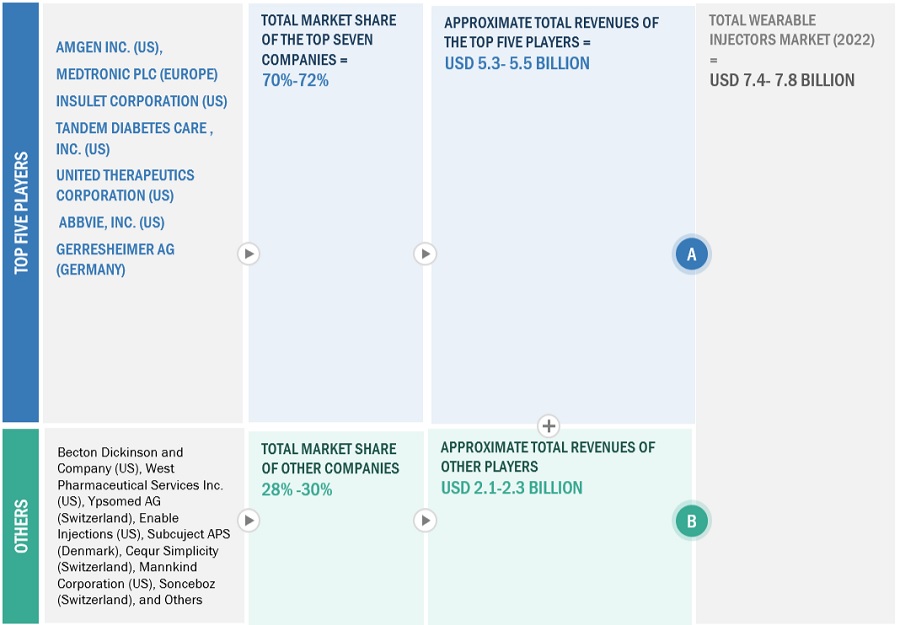
Using secondary data from both paid and unpaid sources, the market rankings for the major players were determined following a thorough analysis of their sales of respiratory diagnostics. Due to data restrictions, the revenue share in certain cases was determined after a thorough analysis of the product portfolio of big corporations and their individual sales performance. This information was verified at each stage by in-depth interviews with professionals in the field.

Market Definition

Wearable injectors are devices capable of delivering large volumes of drugs subcutaneously. These devices are easy-to-handle and cost-effective that can be used by patients and caregivers to deliver a dose of a particular drug. Wearable injectors are used to manage post-chemotherapy and other chronic conditions, such as diabetes and cardiovascular diseases.

Key Stakeholders

  • Wearable injector manufacturing companies
  • Original equipment manufacturing companies
  • Suppliers and distributors of wearable injectors
  • Healthcare service providers
  • Teaching hospitals and academic medical centers
  • Health insurance players
  • Government bodies/municipal corporations
  • Regulatory bodies
  • Medical research institutes
  • Business research and consulting service providers
  • Venture capitalists
  • Market research and consulting firms

Report Objectives

  • To define, describe, and forecast the wearable injectors market by type, technology, indication, end user, and region.
  • To provide detailed information about the key factors influencing the market growth, such as drivers, restraints, opportunities, challenges, and industry trends
  • To strategically analyze the regulatory scenario, Porter’s five force analysis, value chain analysis, supply chain analysis, ecosystem map, recession impact, and patent analysis
  • To analyze micromarkets1 with respect to individual growth trends, prospects, and contributions to the overall wearable injectors market
  • To analyze market opportunities for stakeholders and provide details of the competitive landscape for key players.
  • To strategically profile the key players in this market and comprehensively analyze their market shares and core competencies2
  • To strategically analyze the wearable injectors market in five regions: North America, Europe, the Asia Pacific, Latin America, the Middle East & Africa, and GCC.
  • To track and analyze competitive developments such as acquisitions, product launches, partnerships, and expansions in the wearable injectors market.
  • To evaluate the impact of the recession on the wearable injectors market market worldwide.

Available Customizations

With the given market data, MarketsandMarkets offers customizations as per the company’s specific needs. The following customization options are available for the report:

Geographic Analysis

  • Further breakdown of the Rest of Europe wearable inejctors market into the Netherlands, Switzerland, Austria, Belgium, and others
  • Further breakdown of the Rest of Asia Pacific wearable injectors market into Singapore, Malaysia, and others

Company Information

  • Detailed analysis and profiling of additional market players

Previous Versions of this Report

Wearable Injectors Market by Product Type(On-Body and Off-Body), Therapy (Immuno-oncology, Diabetes, Cardiovascular diseases), Technology(Spring-based, Motor Driven, Rotary Pump, Expanding Battery), Care Setting (Hospitals) - Global Forecast to 2026

Report Code MD 6659
Published in May, 2022, By MarketsandMarkets™

Wearable Injectors Market by Product Type(On-Body and Off-Body), Therapy (Immuno-oncology, Diabetes, Cardiovascular diseases), Technology(Spring-based, Motor Driven, Rotary Pump, Expanding Battery), Care Setting (Hospitals) - Global Forecast to 2026

Report Code MD 6659
Published in Jul, 2021, By MarketsandMarkets™

Wearable Injectors Market by Product Type(On-Body and Off-Body), Therapy (Immuno-oncology, Diabetes, Cardiovascular diseases), Technology(Spring-based, Motor Driven, Rotary Pump, Expanding Battery), Care Setting (Hospitals) - Global Forecast to 2026

Report Code MD 6659
Published in Oct, 2018, By MarketsandMarkets™

Custom Market Research Services

We Will Customise The Research For You, In Case The Report Listed Above Does Not Meet With Your Requirements

Get 10% Free Customisation

Growth opportunities and latent adjacency in Wearable Injectors Market

Martin

Jun, 2022

How latest advancements in technologies impacting the revenue growth of Wearable Injectors Market?.

Micah

Jun, 2022

What are the key factors driving revenue opportunities in Wearable Injectors Market?.

Anthony

Jun, 2022

Can you give some more information on demand of wearable injectors in end-user industry?.

DMCA.com Protection Status