The research process for this technical, market-oriented, and commercial study of the IoT node and gateway market included the systematic gathering, recording, and analysis of data about customers and companies operating in the market. It involved the extensive use of secondary sources, directories, and databases (Factiva, Oanda, and OneSource) to identify and collect relevant information. In-depth interviews were conducted with various primary respondents, including experts from core and related industries and preferred manufacturers, to obtain and verify critical qualitative and quantitative information as well as to assess the growth prospects of the market. Key players in the IoT node and gateway market were identified through secondary research, and their market rankings were determined through primary and secondary research. This included studying annual reports of top players and interviewing key industry experts, such as CEOs, directors, and marketing executives.
Secondary Research
In the secondary research process, various secondary sources were used to identify and collect information for this study. These include annual reports, press releases, and investor presentations of companies, whitepapers, certified publications, and articles from recognized associations and government publishing sources. Research reports from a few consortiums and councils were also consulted to structure qualitative content.
Secondary research has been mainly used to obtain important information about the industry’s value chain, the market’s monetary chain, the overall pool of key players, market classification and segmentation according to industry trends to the bottom-most level, regional markets, and key developments from both market- and technology-oriented perspectives.
Primary Research
Extensive primary research was accomplished after understanding and analyzing the IoT node and gateway market scenario through secondary research. Several primary interviews were conducted with key opinion leaders from both demand- and supply-side vendors across four major regions—North America, Europe, Asia Pacific, and RoW. Approximately 30% of the primary interviews were conducted with the demand side, and 70% with the supply side. Primary data was collected through questionnaires, emails, and telephonic interviews. Various departments within organizations, such as sales, operations, and administration, were contacted to provide a holistic viewpoint in the report.

To know about the assumptions considered for the study, download the pdf brochure
Market Size Estimation
Multiple approaches were adopted to estimate and forecast the size of the IoT node and gateway market. The first approach involves estimation of the market size through summation of the revenues generated by companies through the sales of IoT node and gateway devices.
In this approach, all applications of IoT node and gateway market, such as industrial and consumer, have been considered. Different device types/products offered by various players were identified and their sales volume and average selling prices were estimated to derive the market numbers. This data was verified through primary research.
IoT Node and Gateway Market: Bottom-Up Approach

The bottom-up procedure was employed to arrive at the overall size of the IoT node and gateway market from revenues of the key players and their share in the market. The overall market size was calculated on the basis of the revenues of the key companies identified in the market.
IoT Node and Gateway Market: Top-Down Approach

In the top-down approach, the overall size of the IoT node and gateway market was used to estimate the size of the individual markets (mentioned in the market segmentation) through percentage splits obtained from secondary and primary research. To calculate the size of the specific market segments, the size of the most appropriate parent market was used to implement the top-down approach. The bottom-up approach was also implemented for the data extracted from the secondary research to validate the size of various segments of the IoT node and gateway market.
The share of each company in the market was estimated to verify the revenue shares used earlier in the bottom-up approach. With the data triangulation procedure and the validation of data through primaries, sizes of the parent market and each individual market were determined and confirmed. The data triangulation procedure used for this study has been explained in the next section.
Data Triangulation
After arriving at the overall market size from the market size estimation process explained above, the total market was split into several segments and subsegments. Data triangulation and market breakdown procedures were employed, wherever applicable, to complete the overall market engineering process and arrive at the exact statistics for all segments and subsegments. The data was triangulated by studying various factors and trends from both demand and supply sides. Along with this, the market size was validated using both top-down and bottom-up approaches.
Market Definition
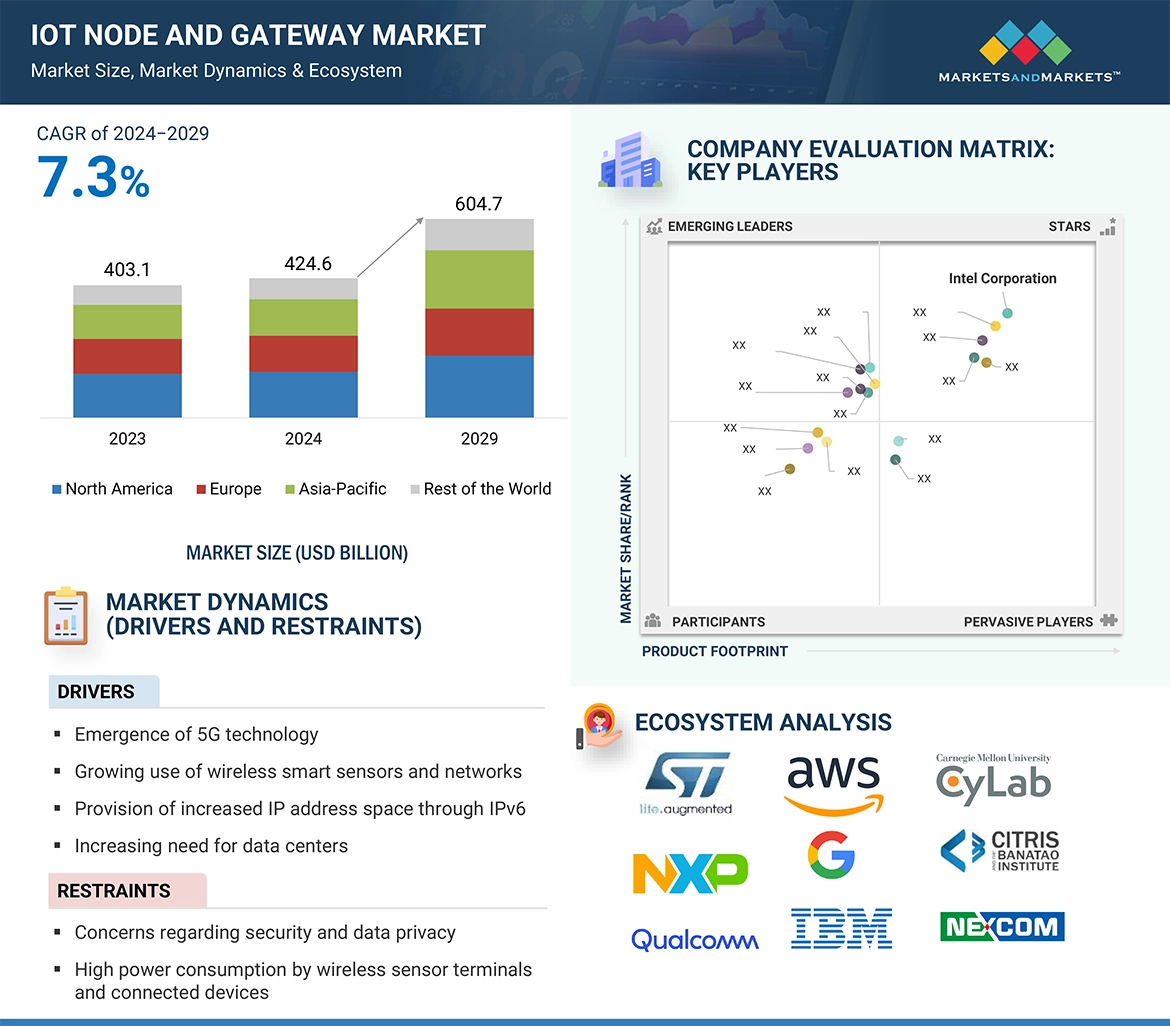
In the Internet of Things (IoT), a node refers to a device equipped with sensors, actuators, and processing capabilities, enabling it to collect, transmit, and receive data within a network. These nodes serve as endpoints for data generation and are typically deployed in various environments for monitoring and control purposes. On the other hand, a gateway acts as a bridge between IoT devices and external networks, facilitating communication, data aggregation, and protocol translation. Gateways play a crucial role in connecting IoT nodes to the internet or other networks, enabling centralized management, data analysis, and integration with cloud services or backend systems. IoT nodes and gateways form the backbone of interconnected systems, enabling the creation of smart environments, efficient data exchange, and intelligent decision-making.
Key Stakeholders
-
Raw material and manufacturing equipment suppliers
-
Semiconductor wafer vendors
-
Fabless players
-
Foundry players
-
Original equipment manufacturers (OEMs)
-
Original design manufacturers (ODM) and OEM technology solution providers
-
Distributors and retailers
-
Research organizations
-
Technology standard organizations, forums, alliances, and associations
-
Technology investors
-
Operating system (OS) vendors
-
Content providers
-
Software providers
Report Objectives
-
To define, describe, segment, and forecast the IoT node and gateway market size, in terms of value and volume, based on end-use application and hardware
-
To forecast the market size, in terms of value, across North America, Europe, Asia Pacific, and the Rest of the World (RoW)
-
To present detailed information regarding the major factors influencing the growth of the market (drivers, restraints, opportunities, and challenges)
-
To provide an ecosystem analysis, case study analysis, patent analysis, technology analysis, ASP analysis, Porter’s Five Forces analysis, and regulations pertaining to the market.
-
To offer a comprehensive overview of the value chain of the IoT node and gateway market ecosystem
-
To critically analyze micromarkets1 with respect to individual growth trends, prospects, and contributions to the total market
-
To strategically profile the key players and comprehensively analyze their market shares and core competencies.
-
To assess the opportunities in the market for stakeholders and describe the competitive landscape of the market
-
To analyze competitive developments, such as collaborations, agreements, partnerships, product developments, and research and development (R&D), in the market
-
To evaluate the impact of the recession on the IoT node and gateway market
Available Customizations
With the given market data, MarketsandMarkets offers customizations according to the company’s specific needs. The following customization options are available for the report:
Company Information
-
Detailed analysis and profiling of additional market players (up to 7)


Leland
Apr, 2026
How is North America dominating the IoT Gateway market, and which industries (manufacturing, healthcare, automotive) are leading demand?.
Eddie
Apr, 2026
Does the report provide deeper breakdown of IoT Gateway usage in smart healthcare systems and remote patient monitoring?.