Team Collaboration Software Market: Audio, Video, Web Conferencing Solutions Market (2010-2015)


The global team collaboration and web conferencing market is expected to reach $19.97 billion by the year 2015, registering a CAGR of 10.4%. The main forces driving the market are conferencing and collaboration to enhance productivity of businesses as well as employees. Although the web collaboration and team conferencing market is growing significantly, it has some shortfalls that restrict its growth to a certain extent. Low awareness and lack of training are the typical key challenges before the market.
Players in this market can gain competitive advantages by shifting their focus from individual functionality sales to consolidated functionality sales, and concentrating on channel sales. The competitive landscape for the team collaboration and web conferencing market is centered on new product launches being adopted by major players. The new product launch strategy was the key strategy adopted by the players between 2008 and 2011. The team collaboration and web conferencing market is broadly segmented into collaboration services, collaboration software, and professional services. Collaboration services include audio conferencing, video conferencing, web conferencing, and other conferencing services, whereas collaboration software is classified as team collaboration software, email and calendaring, and other collaboration software. The professional services segment includes integration services, maintenance services, and consulting services.
The collaboration solutions market is segmented into ten verticals: banking, financial services and insurance, communications and media, manufacturing, government, health, wholesale and retail, services, transportation, utilities and resources, and others. There is a decline in the market share of the banking financial services and insurance, wholesale and retail, services, transportation, and communication and media verticals; the remaining verticals will register a growth in market share.
The global team collaboration and web conferencing market is segmented into four geographies: North America, Europe, the Middle East and Africa, Asia-Pacific and Japan, and Latin America. North America forms the largest segment with about 70% of the overall market, followed by EMEA; whereas, LA is the fastest growing region with a CAGR of 16.5%; and APJ with a CAGR of 12.2%.
Scope of the report
This research report categorizes the global team collaboration and web conferencing market on the basis of different applications and countries; forecasting revenues, and analyzing trends in each of the sub segments.
On the basis of delivery model:
- On-premises model
- Software as a service model
On the basis of industry:
- Banking, financial services, and insurance
- Communications and media
- Manufacturing (discrete and process)
- Government
- Health
- Wholesale and retail services
- Services
- Transportation
- Utilities and resources
- Others
On the basis of geography:
- North America
- Europe, the Middle East, and Africa
- Asia-Pacific and Japan
- Latin America
Each section will provide market data, market drivers, trends and opportunities, top-selling products, key players, and competitive outlook. This report will also provide market tables for covering the sub-segments and micro-markets. In addition, the report makes ways for more than 24 company profiles covering all the sub-segments. Every segment has been entailed graphically.
Team Collaboration Software Market: Audio, Video, Web Conferencing Solutions Market (2010-2015)
Conferencing and collaboration solutions are gradually becoming a mainstream tool for communication. Enterprise collaboration benefits businesses and employees by connecting the right people with the right expertise, at the right time, to take the right business decisions. Collaboration solutions are critical to an organization�s success and failure, and deploying an appropriate collaboration tool is one of the key factors towards its success. The global team collaboration and web conferencing market is expected to reach $19.97 billion by 2015, registering a CAGR of 10.4%.
Aggressive pricing is the key strategy adopted by major players due to which large players hold a major chunk of the market with small players getting a smaller share. In the next few years, it is expected that about 80%-85% of the corporate offices will use collaborative services such as e-mail, IM, and calendaring as standard facilities. North America (NA) is the leading market for conferencing and collaboration software, whereas Asia-Pacific Japan (APJ) and Latin America (LA) are the fastest growing geographies.
TEAM COLLABORTAION & WEB CONFERENCING MARKET, BY GEOGRAPHY, 2009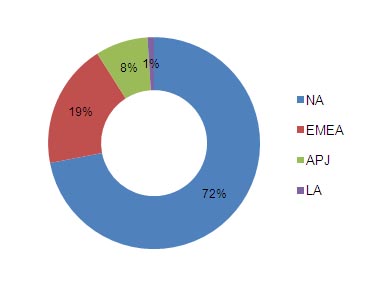
Source: MarketsandMarkets
 Exclusive indicates content/data unique to MarketsandMarkets and not available with any competitors.
TABLE OF CONTENTS
EXECUTIVE SUMMARY
1 INTRODUCTION
1.1 KEY TAKE-AWAYS
1.2 REPORT DESCRIPTION
1.3 MARKETS COVERED
1.4 STAKEHOLDERS
1.5 TAXONOMY
1.6 FORECAST ASSUMPTIONS
1.7 RESEARCH METHODOLOGY
2 SUMMARY
3 MARKET OVERVIEW
3.1 MARKET DEFINITION
3.2 MARKET SEGMENTATION
3.3 MARKET SIZE
3.4 MARKET DYNAMICS
3.4.1 DRIVERS
3.4.1.1 Collaboration & conferencing solutions enhance business & employee productivity
3.4.1.2 Collaboration & conferencing reduces CO2 emissions
3.4.1.3 Emergence of virtual businesses
3.4.1.4 Geographic expansion of organizations drives the need for collaboration & conferencing solutions
3.4.2 RESTRAINTS
3.4.2.1 Problem in calculating ROI
3.4.2.2 Lack of IT infrastructure in developing economies
3.4.3 OPPORTUNITIES
3.4.3.1 Customized offerings for various vertical
3.4.3.2 Combination of collaboration services
3.4.3.3 Web based conferencing
3.5 IMPACT ANALYSIS OF VARIOUS FACTORS ON COLLABORATION & CONFERENCING MARKET
3.6 WINNING IMPERATIVES
3.6.1 FUNCTIONALITY CONSOLIDATION
3.6.2 FOCUS ON CHANNEL SALES
3.6.3 PURE PLAY ON-PREMISE INTEGRATION
3.6.4 CROSS PLATFORM COLLABORATION
3.6.5 COMMODITIZATION OF COLLABORATION & CONFERENCING SOLUTION
3.7 BURNING ISSUES
3.7.1 AGGRESSIVE PRICING BY LARGE VENDORS
3.7.2 AVAILABILITY OF FREE COLLABORATION TOOLS
3.7.3 UNDER UTILIZATION OF COLLABORATION TOOLS
3.8 OPPORTUNITY ANALYSIS
3.9 PORTER�S FIVE FORCES ANALYSIS
3.9.1 SUMMARY
3.9.2 BUYER POWER
3.9.3 SUPPLIER POWER
3.9.4 NEW ENTRANTS
3.9.5 SUBSTITUTES
3.9.6 RIVALRY
3.10 MARKET SHARE ANALYSIS
3.10.1 OVERVIEW
3.10.2 METHODOLOGY
3.11 PATENT ANALYSIS
4 COLLABORATION PLATFORM SOLUTIONS INDUSTRY OVERVIEW
4.1 COLLABORATION SOLUTIONS MARKET
4.1.1 COLLABORATION SERVICES MARKET
4.1.1.1 Audio conferencing services
4.1.1.2 Video conferencing services
4.1.1.3 Web conferencing services
4.1.1.4 Other services
4.1.2 COLLABORATION SOFTWARE MARKET
4.1.2.1 Team collaboration
4.1.2.2 Email & calendaring
4.1.2.3 Others
4.1.3 PROFESSIONAL SERVICES MARKET
4.1.3.1 Integration services
4.1.3.2 Maintenance services
4.1.3.3 Consulting services
4.2 COLLABORATION SOLUTIONS MARKET BY DELIVERY MODEL
4.2.1 ON-PREMISES MODEL
4.2.2 SAAS (SUBSCRIPTION BASED SERVICE)
4.3 COLLABORATION SOLUTIONS MARKET BY VERTICALS
4.3.1 BANKING, FINANCIAL SERVICES & INSURANCE
4.3.2 COMMUNICATIONS & MEDIA
4.3.3 MANUFACTURING (DISCRETE & PROCESS)
4.3.4 GOVERNMENT
4.3.5 HEALTH
4.3.6 WHOLESALE & RETAIL
4.3.7 SERVICES
4.3.8 TRANSPORTATION
4.3.9 UTILITIES & RESOURCES
4.3.10 OTHERS (CONSTRUCTION & EDUCATION)
5 GEOGRAPHIC ANALYSIS
5.1 MARKET OVERVIEW
5.2 NORTH AMERICA
5.2.1 OVERVIEW
5.2.1.1 Trends in North America
5.2.2 MARKET SHARES & FORECAST
5.2.2.1 Collaboration solutions market & forecast, by types
5.2.2.2 Collaboration solutions market size & forecast, by geography
5.2.2.3 Collaboration services market size & forecast, by geography
5.2.2.4 Collaboration software market size & forecast, by geography
5.2.2.5 Professional services market size & forecast, by geography
5.2.2.6 Collaboration solutions market, by verticals
5.3 EUROPE MIDDLE EAST & AFRICA (EMEA)
5.3.1 OVERVIEW
5.3.2 TRENDS IN EMEA
5.3.3 MARKET SHARES & FORECAST
5.3.3.1 Collaboration solutions market size & forecast
5.3.3.2 Collaboration solutions market size & forecast, by geography
5.3.3.3 Collaboration services market size & forecast
5.3.3.4 Collaboration software market size & forecast, by geography
5.3.3.5 Professional services market size & forecast, by geography
5.4 ASIA PACIFIC & JAPAN (APJ)
5.4.1 OVERVIEW
5.4.2 TRENDS IN APJ
5.4.3 MARKET SHARES & FORECAST
5.4.3.1 Collaboration solutions market size & forecast, by types
5.4.3.2 Collaboration solutions market size & forecast, by geography
5.4.3.3 Collaboration services market size & forecast, by geography
5.4.3.4 Collaboration software market size & forecast, by geography
5.4.3.5 Professional services market size & forecast,by geography
5.4.3.6 Collaboration solutions market size & forecast,by verticals
5.5 LATIN AMERICA
5.5.1 OVERVIEW
5.5.2 TRENDS IN LATIN AMERICA
5.5.3 MARKET SHARES & FORECAST
5.5.3.1 Collaboration solutions market size & forecast, by types
5.5.3.2 Collaboration solutions market size & forecast, by geography
5.5.3.3 Collaboration services market size & forecast, by geography
5.5.3.4 Collaboration software market size & forecast, by geography
5.5.3.5 Professional services market size & forecast, by geography
5.5.3.6 Collaboration solution market size & forecast, by verticals
6 COMPETITIVE LANDSCAPE
7 COMPANY PROFILES
7.1 ADOBE
7.1.1 OVERVIEW
7.1.2 PRIMARY BUSINESS
7.1.3 FINANCIALS
7.1.4 STRATEGY
7.1.5 DEVELOPMENTS
7.2 AT&T
7.2.1 OVERVIEW
7.2.2 PRIMARY BUSINESS
7.2.3 FINANCIALS
7.2.4 STRATEGY
7.2.5 DEVELOPMENTS
7.3 AUDIOCODES
7.3.1 OVERVIEW
7.3.2 PRIMARY BUSINESS
7.3.3 FINANCIALS
7.3.4 STRATEGY
7.3.5 DEVELOPMENTS
7.4 AVAYA INC
7.4.1 OVERVIEW
7.4.2 PRIMARY BUSINESS
7.4.3 FINANCIALS
7.4.4 STRATEGY
7.4.5 DEVELOPMENTS
7.5 CISCO SYSTEMS, INC
7.5.1 OVERVIEW
7.5.2 PRIMARY BUSINESS
7.5.3 FINANCIALS
7.5.4 STRATEGY
7.5.5 DEVELOPMENTS
7.6 CITRIX SYSTEMS
7.6.1 OVERVIEW
7.6.2 PRIMARY BUSINESS
7.6.3 FINANCIALS
7.6.4 STRATEGY
7.6.5 DEVELOPMENTS
7.7 BLACKBOARD INC
7.7.1 OVERVIEW
7.7.2 PRIMARY BUSINESS
7.7.3 FINANCIALS
7.7.4 STRATEGY
7.7.5 DEVELOPMENTS
7.8 GLOBAL CROSSING
7.8.1 OVERVIEW
7.8.2 PRIMARY BUSINESS
7.8.3 FINANCIALS
7.8.4 STRATEGY
7.8.5 DEVELOPMENTS
7.9 GOOGLE
7.9.1 OVERVIEW
7.9.2 PRIMARY BUSINESS
7.9.3 FINANCIALS
7.9.4 STRATEGY
7.9.5 DEVELOPMENTS
7.10 IBM
7.10.1 OVERVIEW
7.10.2 PRIMARY BUSINESS
7.10.3 FINANCIALS
7.10.4 STRATEGIC ANALYSIS
7.10.5 DEVELOPMENTS
7.11 METASWITCH
7.11.1 OVERVIEW
7.11.2 PRIMARY BUSINESS
7.11.3 FINANCIALS
7.11.4 STRATEGY
7.11.5 DEVELOPMENTS
7.12 MICROSOFT
7.12.1 OVERVIEW
7.12.2 PRIMARY BUSINESS
7.12.3 FINANCIALS
7.12.4 STRATEGY
7.12.5 DEVELOPMENTS
7.13 MITEL
7.13.1 OVERVIEW
7.13.2 PRIMARY BUSINESS
7.13.3 FINANCIALS
7.13.4 STRATEGY
7.13.5 DEVELOPMENTS
7.14 NOVELL
7.14.1 OVERVIEW
7.14.2 PRIMARY BUSINESS
7.14.3 FINANCIALS
7.14.4 STRATEGY
7.14.5 DEVELOPMENTS
7.15 OPENTEXT
7.15.1 OVERVIEW
7.15.2 PRIMARY BUSINESS
7.15.3 FINANCIALS
7.15.4 STRATEGY
7.15.5 DEVELOPMENTS
7.16 ORACLE
7.16.1 OVERVIEW
7.16.2 PRIMARY BUSINESS
7.16.3 FINANCIALS
7.16.4 STRATEGY
7.16.5 DEVELOPMENTS
7.17 PGI
7.17.1 OVERVIEW
7.17.2 PRIMARY BUSINESS
7.17.3 FINANCIALS
7.17.4 STRATEGY
7.17.5 DEVELOPMENTS
7.18 POLYCOM
7.18.1 OVERVIEW
7.18.2 PRIMARY BUSINESS
7.18.3 FINANCIALS
7.18.4 STRATEGY
7.18.5 DEVELOPMENTS
7.19 RADISYS
7.19.1 OVERVIEW
7.19.2 PRIMARY BUSINESS
7.19.3 FINANCIALS
7.19.4 STRATEGY
7.19.5 DEVELOPMENTS
7.20 SABA SOFTWARE, INC. (SABA)
7.20.1 OVERVIEW
7.20.2 PRIMARY BUSINESS
7.20.3 FINANCIALS
7.20.4 STRATEGY
7.20.5 DEVELOPMENTS
7.21 SIEMENS ENTERPRISE COMMUNICATIONS GMBH & CO KG
7.21.1 OVERVIEW
7.21.2 PRIMARY BUSINESS
7.21.3 FINANCIALS
7.21.4 STRATEGY
7.21.5 DEVELOPMENTS
7.22 SMART TECHNOLOGIES INC.
7.22.1 OVERVIEW
7.22.2 PRIMARY BUSINESS
7.22.3 FINANCIALS
7.22.4 STRATEGY
7.22.5 DEVELOPMENTS
7.23 WEST CORP.
7.23.1 OVERVIEW
7.23.2 PRIMARY BUSINESS
7.23.3 FINANCIALS
7.23.4 STRATEGY
7.23.5 DEVELOPMENTS
7.24 WYDE VOICE
7.24.1 OVERVIEW:
7.24.2 PRIMARY BUSINESS
7.24.3 STRATEGY
7.24.4 DEVELOPMENTS
7.25 YAHOO
7.25.1 OVERVIEW
7.25.2 PRIMARY BUSINESS
7.25.3 FINANCIALS
7.25.4 STRATEGY
7.25.5 DEVELOPMENTS
APPENDIX
U.S. PATENTS
EUROPE PATENTS
JAPAN PATENTS
LIST OF TABLES
TABLE 1 FORECAST ASSUMPTIONS
TABLE 2 GLOBAL COLLABORATION SOLUTIONS MARKET REVENUE, BY TYPES, 2009 � 2015 ($MILLION)
TABLE 3 GLOBAL COLLABORATION SOLUTIONS MARKET, BY TYPES, 2009 � 2015 ($MILLION)
TABLE 4 COLLABORATION SOLUTIONS MARKET, BY TYPES, 2010 � 2015 (Y-O-Y GROWTH RATE)
TABLE 5 GLOBAL COLLABORATION SOLUTIONS MARKET, BY TYPES, 2009 � 2015 (PROPORTION)
TABLE 6 COMPARISON OF SOFTWARE BASED CONFERENCING & WEB BASED CONFERENCING
TABLE 7 IMPACT ANALYSIS OF VARIOUS FACTORS ON COLLABORATION & CONFERENCING MARKET
TABLE 8 FEATURES OF COLLABORATION SOFTWARE/SERVICES
TABLE 9 AVERAGE PRICE OF WEB COLLABORATION SOLUTIONS ($/ MONTH)
TABLE 10 GLOBAL COLLABORATION SERVICES MARKET REVENUE, BY TYPES, 2009 � 2015 ($MILLION)
TABLE 11 COLLABORATION SERVICES MARKET REVENUE, BY TYPES, 2009 � 2015 (Y-O-Y GROWTH RATE)
TABLE 12 COLLABORATION SERVICES MARKET, BY TYPES, 2009 � 2015 (PROPORTION)
TABLE 13 COLLABORATION SOFTWARE MARKET REVENUE, BY TYPES, 2009 � 2015 ($MILLION)
TABLE 14 COLLABORATION SOFTWARE MARKET, BY TYPES, 2010 � 2015 (Y-O-Y GROWTH RATE)
TABLE 15 COLLABORATION SOFTWARE MARKET, BY TYPES, 2009 � 2015 (PROPORTION)
TABLE 16 PROFESSIONAL SERVICES MARKET REVENUE, BY TYPES, 2009 � 2015 ($MILLION)
TABLE 17 PROFESSIONAL SERVICES MARKET, BY TYPES, 2010 � 2015 (Y-O-Y GROWTH RATE)
TABLE 18 PROFESSIONAL SERVICES MARKET, BY TYPES, 2009 � 2015 (PROPORTION)
TABLE 19 GLOBAL COLLABORATION MARKET REVENUE, BY VERTICALS, 2009 � 2015 ($MILLION)
TABLE 20 GLOBAL COLLABORATION MARKET, BY VERTICALS, 2009 � 2015 (Y-O-Y GROWTH RATE)
TABLE 21 GLOBAL COLLABORATION MARKET, BY VERTICALS, 2009 � 2015 (PROPORTION)
TABLE 22 COLLABORATION SOLUTIONS MARKET REVENUE, BY GEOGRAPHY, 2009 � 2015 ($MILLION)
TABLE 23 COLLABORATION SOLUTIONS MARKET, BY GEOGRAPHY, 2010 � 2015 (Y-O-Y GROWTH RATE)
TABLE 24 COLLABORATION SOLUTIONS MARKET, BY GEOGRAPHY, 2009 � 2015 (PROPORTION)
TABLE 25 NORTH AMERICA: COLLABORATION SOLUTIONS MARKET (2009 � 2015)
TABLE 26 NORTH AMERICA: COLLABORATION SOLUTIONS MARKET REVENUE, BY TYPES, 2009 � 2015 ($MILLION)
TABLE 27 NORTH AMERICA: COLLABORATION SOLUTIONS MARKET REVENUE, BY TYPES, 2010 � 2015 (Y-O-Y GROWTH RATE)
TABLE 28 NORTH AMERICA: COLLABORATION SOLUTIONS MARKET, BY TYPES, 2009 � 2015 (PROPORTION)
TABLE 29 NORTH AMERICA: COLLABORATION SOLUTIONS MARKET REVENUE, BY GEOGRAPHY, 2009 � 2015 ($MILLION)
TABLE 30 NORTH AMERICA: COLLABORATION SOLUTIONS MARKET, 2010 � 2015 (Y-O-Y GROWTH RATE)
TABLE 31 NORTH AMERICA: COLLABORATION SOLUTIONS MARKET, BY GEOGRAPHY, 2009 � 2015 (PROPORTION)
TABLE 32 NORTH AMERICA: COLLABORATION SERVICES MARKET REVENUE, BY GEOGRAPHY, 2009 � 2015 ($MILLION)
TABLE 33 NORTH AMERICA: COLLABORATION SERVICES MARKET, BY GEOGRAPHY, 2010 � 2015 (Y-O-Y GROWTH RATE)
TABLE 34 NORTH AMERICA: COLLABORATION SERVICES MARKET, BY GEOGRAPHY, 2009 � 2015 (PROPORTION)
TABLE 35 NORTH AMERICA: COLLABORATION SOFTWARE MARKET REVENUE, BY GEOGRAPHY, 2009 � 2015 ($MILLION)
TABLE 36 NORTH AMERICA: COLLABORATION SOFTWARE MARKET, BY GEOGRAPHY, 2010 � 2015 (Y-O-Y GROWTH RATE )
TABLE 37 NORTH AMERICA: COLLABORATION SOFTWARE MARKET, BY GEOGRAPHY, 2010 � 2015 (PROPORTION)
TABLE 38 NORTH AMERICA: PROFESSIONAL SERVICES MARKET REVENUE, BY GEOGRAPHY, 2009 � 2015 ($MILLION)
TABLE 39 NORTH AMERICA: PROFESSIONAL SERVICES MARKET, BY GEOGRAPHY, 2010 � 2015 (Y-O-Y GROWTH RATE)
TABLE 40 NORTH AMERICA: PROFESSIONAL SERVICES MARKET, BY GEOGRAPHY, 2009 � 2015 (PROPORTION)
TABLE 41 NORTH AMERICA: COLLABORATION SOLUTIONS MARKET REVENUE, BY VERTICALS, 2009 � 2015 ($MILLION)
TABLE 42 NORTH AMERICA: COLLABORATION SOLUTIONS MARKET, BY VERTICALS, 2010 � 2015 (Y-O-Y GROWTH RATE)
TABLE 43 NORTH AMERICA: COLLABORATION SOLUTIONS MARKET, BY VERTICALS, 2009 � 2015 (PROPORTION)
TABLE 44 EMEA: COLLABORATION SOLUTIONS MARKET (2009 � 2015)
TABLE 45 EMEA: COLLABORATION SOLUTIONS MARKET REVENUE, BY TYPES, 2009 � 2015 ($MILLION)
TABLE 46 EMEA: COLLABORATION SOLUTIONS MARKET, BY TYPES, 2010 � 2015 (Y-O-Y GROWTH RATE)
TABLE 47 EMEA: COLLABORATION SOLUTIONS MARKET, BY TYPES, 2009 � 2015 (PROPORTION)
TABLE 48 EMEA: COLLABORATION SOLUTIONS MARKET REVENUE, BY GEOGRAPHY 2009 � 2015 ($MILLION)
TABLE 49 EMEA: COLLABORATION SOLUTIONS MARKET, BY GEOGRAPHY, 2010-2015 ( Y-O-Y GROWTH RATE)
TABLE 50 EMEA: COLLABORATION SOLUTIONS MARKET, BY GEOGRAPHY, 2009 � 2015 (PROPORTION)
TABLE 51 EMEA: COLLABORATION SERVICES MARKET REVENUE, BY GEOGRAPHY, 2009 � 2015 ($MILLION)
TABLE 52 EMEA: COLLABORATION SERVICES MARKET, BY GEOGRAPHY 2010 � 2015 (Y-O-Y GROWTH RATE)
TABLE 53 EMEA: COLLABORATION SERVICES MARKET, BY GEOGRAPHY, 2009 � 2015 (PROPORTION)
TABLE 54 EMEA: COLLABORATION SOFTWARE MARKET REVENUE, BY GEOGRAPHY 2009 � 2015 ($MILLION)
TABLE 55 EMEA: COLLABORATION SOFTWARE MARKET, BY GEOGRAPHY 2010 � 2015 (Y-O-Y GROWTH RATE)
TABLE 56 EMEA: COLLABORATION SOFTWARE MARKET, BY GEOGRAPHY, 2009 � 2015 (PROPORTION)
TABLE 57 EMEA: PROFESSIONAL SERVICES MARKET REVENUE, 2009 � 2015 ($MILLION)
TABLE 58 EMEA: PROFESSIONAL SERVICES MARKET, BY GEOGRAPHY, 2010 � 2015 (Y-O-Y GROWTH RATE)
TABLE 59 EMEA: PROFESSIONAL SERVICES MARKET BY GEOGRAPHY, 2009 � 2015 (PROPORTION)
TABLE 60 EMEA: COLLABORATION SOLUTIONS MARKET, BY VERTICALS, 2009 � 2015 ($MILLION)
TABLE 61 EMEA: COLLABORATION SOLUTIONS MARKET, BY VERTICALS, 2010 � 2015 (Y-O-Y GROWTH RATE)
TABLE 62 EMEA: COLLABORATION SOLUTIONS MARKET, BY VERTICALS, 2009 � 2015 (PROPORTION)
TABLE 63 APJ: COLLABORATION SOLUTIONS MARKET REVENUE, 2009 � 2015 ($MILLION)
TABLE 64 APJ: COLLABORATION SOLUTIONS MARKET REVENUE, BY TYPES, 2009 � 2015 ($MILLION)
TABLE 65 APJ: COLLABORATION SOLUTIONS MARKET, BY TYPES, 2010 � 2015 (Y-O-Y GROWTH RATE)
TABLE 66 APJ: COLLABORATION SOLUTIONS MARKET, BY TYPES, 2009 � 2015 (PROPORTION )
TABLE 67 APJ: COLLABORATION SOLUTIONS MARKET REVENUE, BY GEOGRAPHY, 2009 � 2015 ($MILLION)
TABLE 68 APJ: COLLABORATION SOLUTIONS MARKET, BY GEOGRAPHY, 2010 � 2015 ( Y-O-Y GROWTH RATE)
TABLE 69 APJ: COLLABORATION SOLUTIONS MARKET, BY GEOGRAPHY, 2009 � 2015 (PROPORTION)
TABLE 70 APJ: COLLABORATION SERVICES MARKET REVENUE, BY GEOGRAPHY, 2009 � 2015 ($MILLION)
TABLE 71 APJ: COLLABORATION SERVICES MARKET, BY GEOGRAPHY 2010 � 2015 (Y-O-Y GROWTH RATE)
TABLE 72 APJ: COLLABORATION SERVICES MARKET, BY GEOGRAPHY, 2009 � 2015 (PROPORTION)
TABLE 73 APJ: COLLABORATION SOFTWARE MARKET REVENUE, BY GEOGRAPHY, 2009 � 2015 ($MILLION)
TABLE 74 APJ: COLLABORATION SOFTWARE MARKET, BY GEOGRAPHY, 2010 � 2015 ( Y-O-Y GROWTH RATE)
TABLE 75 APJ: COLLABORATION SOFTWARE MARKET, BY GEOGRAPHY, 2009 � 2015 (PROPORTION)
TABLE 76 APJ: PROFESSIONAL SERVICES MARKET REVENUE, BY GEOGRAPHY, 2009 � 2015 ($MILLION)
TABLE 77 APJ: PROFESSIONAL SERVICES MARKET, BY GEOGRAPHY, 2010 � 2015 (Y-O-Y GROWTH RATE)
TABLE 78 APJ: PROFESSIONAL SERVICES MARKET, BY GEOGRAPHY, 2009 � 2015 (PROPORTION)
TABLE 79 APJ: COLLABORATION SOLUTIONS MARKET REVENUE, BY VERTICALS, 2009 � 2015 ($MILLION)
TABLE 80 APJ: COLLABORATION SOLUTIONS MARKET, BY VERTICALS, 2010 � 2015 (Y-O-Y GROWTH RATE)
TABLE 81 APJ: COLLABORATION SOLUTIONS MARKET, BY VERTICALS, 2009 � 2015 (PROPORTION)
TABLE 82 LATIN AMERICA: COLLABORATION SOLUTIONS MARKET, 2009 � 2015
TABLE 83 LATIN AMERICA: COLLABORATION SOLUTIONS MARKET REVENUE, BY TYPES, 2009 � 2015 ($MILLION)
TABLE 84 LATIN AMERICA: COLLABORATION SOLUTIONS MARKET, BY TYPES, 2010 � 2015 (Y-O-Y GROWTH RATE)
TABLE 85 LATIN AMERICA: COLLABORATION SOLUTIONS MARKET, BY TYPES, 2009 � 2015 (PROPORTION)
TABLE 86 LATIN AMERICA: COLLABORATION SOLUTIONS MARKET, BY GEOGRAPHY, 2009 � 2015 ($MILLION)
TABLE 87 LATIN AMERICA: COLLABORATION SOLUTIONS MARKET, BY GEOGRAPHY, 2009 � 2015 (PROPORTION)
TABLE 88 LATIN AMERICA: COLLABORATION SERVICES MARKET, BY GEOGRAPHY, 2009 � 2015 ($MILLION)
TABLE 89 LATIN AMERICA: COLLABORATION SERVICES MARKET, BY GEOGRAPHY, 2010 � 2015 (Y-O-Y GROWTH RATE)
TABLE 90 LATIN AMERICA: COLLABORATION SERVICES MARKET, BY GEOGRAPHY, 2009 � 2015 (PROPORTION)
TABLE 91 LATIN AMERICA: COLLABORATION SOFTWARE MARKET REVENUE, BY GEOGRAPHY, 2009 � 2015 ($MILLION)
TABLE 92 LATIN AMERICA: COLLABORATION SOFTWARE MARKET, BY GEOGRAPHY, 2010 � 2015 (Y-O-Y GROWTH RATE)
TABLE 93 LATIN AMERICA: COLLABORATION SOFTWARE MARKET, BY GEOGRAPHY, 2009 � 2015 (PROPORTION)
TABLE 94 LATIN AMERICA: PROFESSIONAL SERVICES MARKET REVENUE, BY GEOGRAPHY, 2009 � 2015 ($MILLION)
TABLE 95 LATIN AMERICA: PROFESSIONAL SERVICES MARKET, BY GEOGRAPHY, 2010 � 2015 (Y-O-Y GROWTH RATE)
TABLE 96 LATIN AMERICA: PROFESSIONAL SERVICES MARKET, BY GEOGRAPHY, 2009 � 2015 (PROPORTION)
TABLE 97 LATIN AMERICA: COLLABORATION SOLUTION MARKET REVENUE, BY VERTICALS, 2009 � 2015 ($MILLION)
TABLE 98 LATIN AMERICA: COLLABORATION SOLUTION MARKET, BY VERTICALS, 2010 � 2015 (Y-O-Y GROWTH RATE)
TABLE 99 LATIN AMERICA: COLLABORATION SOLUTION MARKET, BY VERTICALS, 2009 � 2015 (PROPORTION)
TABLE 100 MERGERS & ACQUISITIONS (NOVEMBER 2008 - MARCH 2011)
TABLE 101 AGREEMENTS & COLLABORATIONS
TABLE 102 NEW PRODUCT LAUNCH
TABLE 103 ADOBE: REVENUES BY BUSINESS SEGMENTS, 2008 � 2010 ($MILLION)
TABLE 104 CITRIX: REVENUE BY PRODUCT SEGMENTS, 2008 � 2009 ($MILLION)
TABLE 105 NOVELL: REVENUE BY BUSINESS SEGMENTS, 2008 � 2010 ($MILLION)
TABLE 106 OPENTEXT: REVENUE BY PRODUCTS, 2008 � 2010 ($MILLION)
TABLE 107 ORACLE: REVENUE BY BUSINESS SEGMENTS, 2008 � 2010 ($MILLION)
LIST OF FIGURES
FIGURE 1 APPLICATION OF COLLABORATION SOLUTIONS IN VERTICALS (2010) FIGURE 2 COLLABORATION SOLUTIONS MARKET SEGMENTATION
FIGURE 3 COLLABORATION SOLUTIONS MARKET TRENDS, BY TYPES (2010 � 2015)
FIGURE 4 COLLABORATION SOLUTIONS MARKET, BY TYPES, PROPORTION & FORECAST (2010 - 2015)
FIGURE 5 SOURCES OF COST REDUCTION
FIGURE 6 STAGES IN BUSINESS PROCESS ENHANCEMENT
FIGURE 7 GHG EMISSIONS IN DEVELOPING & DEVELOPED COUNTRIES
FIGURE 8 FIXED BROADBAND SUBSCRIPTIONS PER 100 INHABITANTS
FIGURE 9 APPROACHES OF COLLABORATION
FIGURE 10 OPPORTUNITY MATRIX � COLLABORATION & CONFERENCING MARKET
FIGURE 11 IMPACT OF PORTER�S FIVE FORCES ON GLOBAL TEAM COLLABORATION & WEB CONFERENCING MARKET
FIGURE 12 IMPACT OF BUYER POWER ON GLOBAL TEAM COLLABORATION & WEB CONFERENCING MARKET
FIGURE 13 IMPACT OF SUPPLIER POWER ON GLOBAL TEAM COLLABORATION & WEB CONFERENCING MARKET
FIGURE 14 IMPACT OF NEW ENTRANTS ON GLOBAL TEAM COLLABORATION & WEB CONFERENCING MARKET
FIGURE 15 IMPACT OF SUBSTITUTES ON GLOBAL TEAM COLLABORATION & WEB CONFERENCING MARKET
FIGURE 16 IMPACT OF RIVALS ON GLOBAL TEAM COLLABORATION & WEB CONFERENCING MARKET
FIGURE 17 MARKET SHARE ANALYSIS OF TOP TEN PLAYERS
FIGURE 18 PARAMETERS FOR MARKET PERFORMANCE
FIGURE 19 PARAMETERS FOR MARKET GROWTH
FIGURE 20 GLOBAL TEAM COLLABORATION & WEB CONFERENCING MARKET PATENTS (2006 - FEBRUARY 2011)
FIGURE 21 GLOBAL TEAM COLLABORATION & WEB CONFERENCING MARKET PATENTS, BY TYPES (2006 - FEBRUARY 2011)
FIGURE 22 COLLABORATION SOLUTIONS MARKET, BY TYPES (2010)
FIGURE 23 COLLABORATION SERVICES MARKET TRENDS, BY TYPES (2010 � 2015)
FIGURE 24 COLLABORATION SERVICES MARKET, BY TYPES, PROPORTION & FORECAST (2010 - 2015)
FIGURE 25 COLLABORATION SOFTWARE MARKET GROWTH TRENDS, BY TYPES (2010 � 2015)
FIGURE 26 COLLABORATION SOFTWARE MARKET, BY TYPES, PROPORTION & FORECAST (2010 - 2015)
FIGURE 27 MARKET SHARE OF TOP NETWORKS (2009)
FIGURE 28 PROFESSIONAL SERVICES MARKET GROWTH TRENDS, BY TYPES (2010 � 2015)
FIGURE 29 PROFESSIONAL SERVICES MARKET PROPORTION & FORECAST, BY TYPES (2010 � 2015)
FIGURE 30 COLLABORATION SERVICES MARKET BY DELIVERY MODEL, 2009 ($MILLION)
FIGURE 31 GLOBAL COLLABORATION MARKET, BY VERTICALS, PROPORTION & FORECAST (2010 � 2015)
FIGURE 32 COLLABORATION SOLUTIONS MARKET GROWTH TRENDS, BY GEOGRAPHY (2010 � 2015)
FIGURE 33 COLLABORATION SOLUTIONS MARKET PROPORTION & FORECAST, BY GEOGRAPHY (2010 - 2015)
FIGURE 34 NORTH AMERICA: COLLABORATION SOLUTIONS MARKET GROWTH TRENDS, BY TYPES (2010 � 2015)
FIGURE 35 NORTH AMERICA: COLLABORATION SOLUTIONS MARKET PROPORTION & FORECAST, BY TYPES (2010 � 2015)
FIGURE 36 NORTH AMERICA: COLLABORATION SOLUTIONS MARKET GROWTH TRENDS, BY GEOGRAPHY (2010 � 2015)
FIGURE 37 NORTH AMERICA: COLLABORATION SOLUTIONS MARKET PROPORTION & FORECAST, BY GEOGRAPHY (2010 - 2015)
FIGURE 38 NORTH AMERICA: COLLABORATION SERVICES MARKET GROWTH TRENDS, BY GEOGRAPHY (2010 � 2015)
FIGURE 39 NORTH AMERICA: COLLABORATION SERVICES MARKET PROPORTION & FORECAST, BY GEOGRAPHY (2010 - 2015)
FIGURE 40 NORTH AMERICA: COLLABORATION SOFTWARE MARKET GROWTH TRENDS, BY GEOGRAPHY (2010 � 2015)
FIGURE 41 NORTH AMERICA: COLLABORATION SOFTWARE MARKET PROPORTION & FORECAST, BY GEOGRAPHY (2010 - 2015)
FIGURE 42 NORTH AMERICA: PROFESSIONAL SERVICES MARKET GROWTH TRENDS, BY GEOGRAPHY (2010 � 2015)
FIGURE 43 NORTH AMERICA: PROFESSIONAL SERVICES MARKET PROPORTION & FORECAST, BY GEOGRAPHY (2010 - 2015)
FIGURE 44 NORTH AMERICA: COLLABORATION SOLUTIONS MARKET, BY VERTICALS (2010 � 2015)
FIGURE 45 EMEA: COLLABORATION SOLUTIONS MARKET GROWTH TRENDS, BY TYPES (2010 � 2015)
FIGURE 46 EMEA: COLLABORATION SOLUTIONS MARKET PROPORTION & FORECAST, BY TYPES (2010- 2015)
FIGURE 47 EMEA: COLLABORATION SOLUTIONS GROWTH TRENDS, BY GEOGRAPHY (2010 � 2015)
FIGURE 48 EMEA: COLLABORATION SOLUTIONS MARKET PROPORTION & FORECAST, BY GEOGRAPHY (2010 - 2015)
FIGURE 49 EMEA: COLLABORATION SERVICES MARKET GROWTH TRENDS, BY GEOGRAPHY (2010 � 2015)
FIGURE 50 EMEA: COLLABORATION SERVICES PROPORTION & FORECAST, BY GEOGRAPHY (2010 - 2015)
FIGURE 51 EMEA: COLLABORATION SOFTWARE MARKET GROWTH TRENDS, BY GEOGRAPHY (2010 � 2015)
FIGURE 52 EMEA: COLLABORATION SOFTWARE MARKET PROPORTION & FORECAST, BY GEOGRAPHY (2010 - 2015)
FIGURE 53 EMEA: PROFESSIONAL SERVICES MARKET GROWTH TRENDS, BY GEOGRAPHY (2010 � 2015)
FIGURE 54 EMEA: PROFESSIONAL SERVICES MARKET PROPORTION & FORECAST (2010 -2015)
FIGURE 55 EMEA: COLLABORATION SOLUTIONS MARKET, BY VERTICALS PROPORTION & FORECAST (2010 - 2015)
FIGURE 56 APJ: COLLABORATION SOLUTIONS GROWTH TRENDS, BY TYPES (2010 � 2015)
FIGURE 57 APJ: COLLABORATION SOLUTIONS MARKET PROPORTION & FORECAST, BY TYPES (2010 - 2015)
FIGURE 58 APJ: COLLABORATION SOLUTIONS MARKET GROWTH TRENDS, BY GEOGRAPHY (2010 � 2015)
FIGURE 59 APJ: COLLABORATION SOLUTIONS MARKET PROPORTION & FORECAST, BY GEOGRAPHY (2010 - 2015)
FIGURE 60 APJ: COLLABORATION SERVICES MARKET GROWTH TRENDS, BY GEOGRAPHY (2010 � 2015)
FIGURE 61 APJ: COLLABORATION SERVICES MARKET PROPORTION & FORECAST, BY GEOGRAPHY (2010 - 2015)
FIGURE 62 APJ: COLLABORATION SOFTWARE MARKET GROWTH TRENDS, BY GEOGRAPHY (2010 � 2015)
FIGURE 63 APJ: COLLABORATION SOFTWARE MARKET PROPORTION & FORECAST, BY GEOGRAPHY (2010 - 2015)
FIGURE 64 APJ: PROFESSIONAL SERVICES MARKET GROWTH TRENDS, BY GEOGRAPHY (2010 � 2015)
FIGURE 65 APJ: PROFESSIONAL SERVICES MARKET PROPORTION & FORECAST, BY GEOGRAPHY (2010 - 2015)
FIGURE 66 APJ: COLLABORATION SOLUTIONS MARKET, BY VERTICALS PROPORTION & FORECAST (2010 - 2015)
FIGURE 67 LATIN AMERICA: COLLABORATION SOLUTIONS MARKET GROWTH TRENDS, BY TYPES (2010 � 2015)
FIGURE 68 LATIN AMERICA COLLABORATION SOLUTIONS MARKET PROPORTION & FORECAST, BY TYPES (2010 - 2015)
FIGURE 69 LATIN AMERICA: COLLABORATION SOLUTIONS MARKET GROWTH TRENDS, BY GEOGRAPHY (2010 � 2015)
FIGURE 70 LATIN AMERICA: COLLABORATION SOLUTIONS MARKET PROPORTION & FORECAST, BY GEOGRAPHY (2010 - 2015)
FIGURE 71 LATIN AMERICA: COLLABORATION SERVICES MARKET GROWTH TRENDS, BY GEOGRAPHY (2010 � 2015)
FIGURE 72 LATIN AMERICA: COLLABORATION SERVICES MARKET PROPORTION & FORECAST, BY GEOGRAPHY (2010 - 2015)
FIGURE 73 LATIN AMERICA: COLLABORATION SOFTWARE MARKET GROWTH TRENDS, BY GEOGRAPHY (2010 � 2015)
FIGURE 74 LATIN AMERICA: COLLABORATION SOFTWARE MARKET PROPORTION & FORECAST, BY GEOGRAPHY (2010 - 2015)
FIGURE 75 LATIN AMERICA: PROFESSIONAL SERVICES MARKET GROWTH TRENDS, BY GEOGRAPHY (2010 � 2015)
FIGURE 76 LATIN AMERICA: PROFESSIONAL SERVICES MARKET PROPORTION & FORECAST, BY GEOGRAPHY (2010 - 2015)
FIGURE 77 LATIN AMERICA: COLLABORATION SOLUTION MARKET, BY VERTICALS PROPORTION & FORECAST (2010 � 2015)
FIGURE 78 COMPETITIVE STRATEGIES FOR TEAM COLLABORATION & WEB CONFERENCING MARKET (NOVEMBER 2008 - MARCH 2011)


Growth opportunities and latent adjacency in Team Collaboration Software Market: Audio, Video, Web Conferencing Solutions Market
Interested in understanding market size for collaborative sofware
Interested in understanding Porter`s five force analysis, SWOT,PEST Analysis and Portfolio Analysi