Zinc Chemicals Market by Type (Zinc Oxide, Zinc Sulfate, Zinc Carbonate, Zinc Chloride), Application (Rubber Compounding, Agriculture, Glass & Ceramics, Paint & Coatings, Chemicals, Food & Pharmaceuticals, Textiles), and Region - Global Forecast to 2022


[165 Pages Report] Zinc Chemicals Market size was valued at USD 7.40 Billion in 2016 and is projected to reach USD 10.41 Billion by 2022, at a CAGR of 5.5% during the forecast period. The base year considered for the study is 2016, while the forecast period is between 2017 and 2022.
Objectives of the report are as follows:
- To define and segment the market for zinc chemicals
- To provide detailed information regarding the major factors influencing the growth of the global zinc chemicals market (drivers, restraints, opportunities, and challenges)
- To analyze and forecast the market size of zinc chemicals, in terms of value and volume
- To analyze the market segmentation and project the market size, in terms of value and volume, for key regions, such as North America, Europe, Asia Pacific, South America, and the Middle East & Africa
- To analyze competitive developments, such as new product launches, capacity expansions, mergers & acquisitions, and partnerships & agreements taking place in the market
- To strategically profile key players operating in the global zinc chemicals market
Both, top-down and bottom-up approaches were used to estimate and validate the size of the global zinc chemicals market, and to determine the sizes of various other dependent submarkets. The research study involved extensive use of secondary sources, directories, and databases, such as D&B Hoovers, Bloomberg, Chemical Weekly, Factiva, and other government and private websites to identify and collect information useful for a technical, market-oriented, and commercial study of the global zinc chemicals market.
To know about the assumptions considered for the study, download the pdf brochure
The value chain of the global zinc chemicals market includes sourcing of basic raw materials, manufacturing and supplying raw materials to zinc chemicals manufacturers, and usage of zinc chemicals in various applications. The raw material for zinc chemicals is zinc metal. The major raw material suppliers include Boliden (Sweden), Purity Zinc Metals (US), Nyrstar (Belgium), Hindustan Zinc (India), and Votorantim (Brazil). The raw materials are used by various zinc chemicals manufacturers, which include U.S. Zinc (US), GHC (Canada), Akrochem (US), BruggemannChemical (Germany), Weifang Longda Zinc Industry (China), Hakusuitech (Japan), American Chemet Corporation (US), Rubamin (India), and Zinc Oxide LLC (US).
Key Target Audience:
- Raw Material Suppliers
- Zinc Chemicals Manufacturers
- Traders, Distributors, and Suppliers of Zinc Chemicals
- Government & Regional Agencies, Research Organizations, and Investment Research Firms
Scope of the Report:
This research report categorizes the global zinc chemicals market on the basis of type, application, and region.
On the basis of Type:
- Zinc Oxide
- Zinc Sulfate
- Zinc Carbonate
- Zinc Chloride
- Others
On the basis of Application:
- Rubber Compounding
- Agriculture
- Glass & Ceramics
- Paint & Coatings
- Food & Pharmaceuticals
- Textiles
- Chemicals
- Others
On the basis of Region:
- North America
- Europe
- Asia Pacific
- South America
- Middle East & Africa
The market is further analyzed for key countries in each of these regions.
Available Customizations:
Along with the market data, MarketsandMarkets offers customizations according to the company�s specific needs. The following customization options are available for the report:
Geographic Analysis:
- Further breakdown of a region with respect to major countries
Company Information:
- Detailed analysis and profiles of additional market players
Product Analysis
- Product matrix, which gives a detailed comparison of the product portfolio of each company
The global zinc chemicals market is projected to reach USD 10.41 Billion by 2022, at a CAGR of 5.5% from 2017 to 2022. Zinc chemicals are inorganic compounds manufactured from two different processes such as direct (American), and indirect (French). Zinc oxide produced by the indirect process is pure than that through the direct process. These chemicals are derived from zinc metal. Zinc chemicals are used in rubber compounding, agriculture, paint & coatings, glass & ceramics, chemicals, textiles, and food & pharmaceuticals applications. The growth of these applications drives the zinc chemicals market, globally.
In 2016, the rubber compounding application segment accounted for the largest share of the global zinc chemicals market and is expected to continue to lead during the forecast period. With growing demand for plastics and rubber products in various applications in automobile, electronic gadgets, and footwear industries, the demand for zinc chemicals in rubber compounding segment is likely to increase significantly in the coming years.
Based on type, the zinc sulfate segment is projected to grow at the highest CAGR between 2017 and 2022. Zinc sulfate is used as a fertilizer additive for preventing zinc deficiency in crops. It is expected to be the fastest-growing type segment of the zinc chemicals market, in terms of value, during the forecast period due to its ability to treat a zinc deficiency in humans.
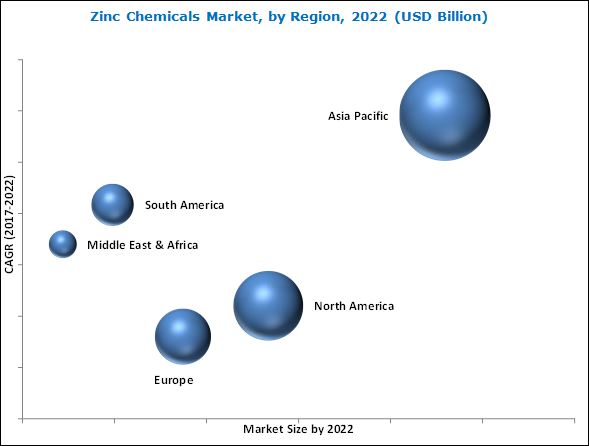
Growth in the agriculture and automotive industries has led to an increase in the demand for zinc chemicals. In 2016, Asia Pacific accounted for the largest share of the global zinc chemicals market. China is expected to account for the largest share of the Asia Pacific zinc chemicals market till 2022, whereas, this market in India is anticipated to grow at the highest CAGR during the forecast period.
Companies have adopted strategies such as agreements & contracts to enhance their existing customer base in the global zinc chemicals market. Key companies operating in this market focus on providing customized products and enhancing their presence in emerging markets. Zinc Oxide LLC (U.S.) signed an agreement with MICRO, SA DE CV (Mexico) to distribute its zinc-related products in Mexican, Central, and South American rubber compounding market. Zinc Oxide LLC aims to capitalize on the market knowledge and extensive experience to boost its revenues. Furthermore, Zinc Oxide LLC signed an agreement with Lintech International (US) to distribute its products for rubber compounding markets in the US. The company aims to increase its market reach through this agreement.
To speak to our analyst for a discussion on the above findings, click Speak to Analyst
 Exclusive indicates content/data unique to MarketsandMarkets and not available with any competitors.
Table of Contents
1 Introduction (Page No. - 16)
1.1 Objectives of the Study
1.2 Market Definition
1.3 Market Scope
1.3.1 Years Considered for the Study
1.4 Currency
1.5 Units Considered
1.6 Limitations
1.7 Stakeholders
2 Research Methodology (Page No. - 19)
2.1 Research Data
2.1.1 Secondary Data
2.1.1.1 Key Data From Secondary Sources
2.1.2 Primary Data
2.1.2.1 Key Data From Primary Sources
2.1.2.2 Key Industry Insights
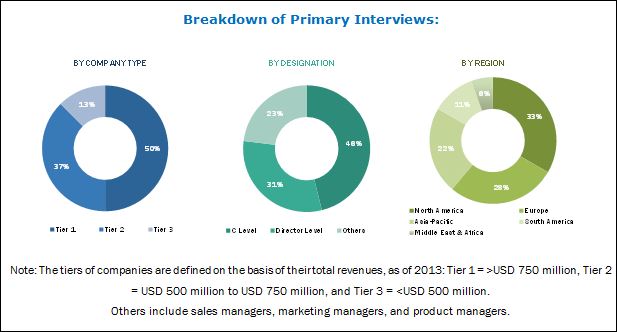
2.1.2.3 Breakdown of Primary Interviews
2.2 Market Size Estimation
2.2.1 Bottom-Up Approach
2.2.2 Top-Down Approach
2.3 Data Triangulation
2.4 Assumptions
3 Executive Summary (Page No. - 27)
4 Premium Insights (Page No. - 30)
4.1 Attractive Growth Opportunities in the Zinc Chemicals Market
4.2 APAC Zinc Chemicals Market, By Application and Country
4.3 Zinc Chemicals Market Attractiveness
4.4 Zinc Chemicals Market, By Region and Application
5 Market Overview (Page No. - 33)
5.1 Introduction
5.2 Market Dynamics
5.2.1 Drivers
5.2.1.1 Rapid Growth in APAC Automotive Industry
5.2.1.2 Increasing Demand for Zinc Chemicals in the Agriculture Industry
5.2.1.3 Expanding Glass & Ceramics Industry
5.2.2 Restraints
5.2.2.1 New Rubber Standards Imposed in China to Impact the Demand for Compounded Rubber
5.2.3 Opportunities
5.2.3.1 Growing Usage of Zinc Chemicals in Electronics & Semiconductors Industry
5.2.4 Challenges
5.2.4.1 Diminishing Usage of Zinc Chemicals in Paints & Coatings Industry
5.2.4.2 Rise in the Prices of Zinc Chemicals
5.3 Porter�s Five Forces Analysis
5.3.1 Bargaining Power of Suppliers
5.3.2 Threat of New Entrants
5.3.3 Threat of Substitutes
5.3.4 Bargaining Power of Buyers
5.3.5 Intensity of Competition Rivalry
6 Zinc Chemicals Market, By Type (Page No. - 41)
6.1 Introduction
6.1.1 Zinc Oxide
6.1.2 Zinc Sulfate
6.1.3 Zinc Carbonate
6.1.4 Zinc Chloride
6.1.5 Others
7 Zinc Chemicals Market, By Application (Page No. - 50)
7.1 Introduction
7.1.1 Rubber Compounding
7.1.2 Agriculture
7.1.3 Glass & Ceramics
7.1.4 Paints & Coatings
7.1.5 Chemicals
7.1.6 Food & Pharmaceuticals
7.1.7 Textiles
7.1.8 Others
8 Zinc Chemicals Market, By Region (Page No. - 66)
8.1 Introduction
8.2 APAC
8.2.1 China
8.2.2 Japan
8.2.3 India
8.2.4 South Korea
8.2.5 Australia & New Zealand
8.2.6 Indonesia
8.2.7 Malaysia
8.2.8 Rest of APAC
8.3 Europe
8.3.1 Germany
8.3.2 France
8.3.3 UK
8.3.4 Russia
8.3.5 Italy
8.3.6 Rest of Europe
8.4 North America
8.4.1 US
8.4.2 Canada
8.4.3 Mexico
8.5 South America
8.5.1 Brazil
8.5.2 Argentina
8.5.3 Rest of South America
8.6 Middle East & Africa
8.6.1 Saudi Arabia
8.6.2 Egypt
8.6.3 Rest of Middle East & Africa
9 Competitive Landscape (Page No. - 136)
9.1 Introduction
9.2 Competitive Scenario
9.2.1 Agreements & Contracts
9.2.2 Expansions
9.2.3 Partnerships & Collaborations
9.2.4 New Product Launches
9.2.5 Mergers & Acquisitions
9.3 Market Ranking
10 Company Profiles (Page No. - 141)
Business Overview, Products Offered, Recent Developments, SWOT Analysis, MnM View
10.1 US Zinc
10.2 GHC
10.3 Akrochem
10.4 Weifang Longda Zinc Industry
10.5 Bruggemannchemical
10.6 Hakusuitech
10.7 American Chemet Corporation
10.8 Zinc Oxide LLC
10.9 Numinor
10.10 Rubamin
*Details Might Not Be Captured in Case of Unlisted Companies.
10.11 Other Companies
10.11.1 Pan-Continental Chemical
10.11.2 Toho Zinc
10.11.3 Uttam Industries
10.11.4 Seyang Zinc Technology
10.11.5 Transpek-Silox
10.11.6 Rech Chemical
11 Appendix (Page No. - 158)
11.1 Insights From Industry Experts
11.2 Discussion Guide
11.3 Knowledge Store: Marketsandmarkets Subscription Portal
11.4 Introducing RT: Real-Time Market Intelligence
11.5 Available Customizations
11.6 Related Reports
11.7 Author Details
List of Tables (160 Tables)
Table 1 Zinc Chemicals Market Size, By Type, 2015�2022 (USD Million)
Table 2 Zinc Chemicals Market Size, By Type, 2015�2022 (Kiloton)
Table 3 Zinc Oxide Market Size, By Region, 2015�2022 (USD Million)
Table 4 Zinc Oxide Market Size, By Region, 2015�2022 (Kiloton)
Table 5 Zinc Sulfate Market Size, By Region, 2015�2022 (USD Million)
Table 6 Zinc Sulfate Market Size, By Region, 2015�2022 (Kiloton)
Table 7 Zinc Carbonate Market Size, By Region, 2015�2022 (USD Million)
Table 8 Zinc Carbonate Market Size, By Region, 2015�2022 (Kiloton)
Table 9 Zinc Chloride Market Size, By Region, 2015�2022 (USD Million)
Table 10 Zinc Chloride Market Size, By Region, 2015�2022 (Kiloton)
Table 11 Other Zinc Chemicals Market Size, By Region, 2015�2022 (USD Million)
Table 12 Other Zinc Chemicals Market Size, By Region, 2015�2022 (Kiloton)
Table 13 Zinc Chemicals Market Size, By Application, 2015�2022 (USD Million)
Table 14 Zinc Chemicals Market Size, By Application, 2015�2022 (Kiloton)
Table 15 Zinc Chemicals Market Size in Rubber Compounding, By Region, 2015�2022 (USD Million)
Table 16 Zinc Chemicals Market Size in Rubber Compounding, By Region, 2015�2022 (Kiloton)
Table 17 Zinc Chemicals Market Size in Agriculture, By Region, 2015�2022 (USD Million)
Table 18 Zinc Chemicals Market Size in Agriculture, By Region, 2015�2022 (Kiloton)
Table 19 Zinc Chemicals Market Size in Glass & Ceramics, By Region, 2015�2022 (USD Million)
Table 20 Zinc Chemicals Market Size in Glass & Ceramics, By Region, 2015�2022 (Kiloton)
Table 21 Zinc Chemicals Market Size in Paints & Coatings, By Region, 2015�2022 (USD Million)
Table 22 Zinc Chemicals Market Size in Paints & Coatings, By Region, 2015�2022 (Kiloton)
Table 23 Zinc Chemicals Market Size in Chemicals, By Region, 2015�2022 (USD Million)
Table 24 Zinc Chemicals Market Size in Chemicals, By Region, 2015�2022 (Kiloton)
Table 25 Zinc Chemicals Market Size in Food & Pharmaceuticals, By Region, 2015�2022 (USD Million)
Table 26 Zinc Chemicals Market Size in Food & Pharmaceuticals, By Region, 2015�2022 (Kiloton)
Table 27 Zinc Chemicals Market Size in Textiles, By Region, 2015�2022 (USD Million)
Table 28 Zinc Chemicals Market Size in Textiles, By Region, 2015�2022 (Kiloton)
Table 29 Zinc Chemicals Market Size in Other Applications, By Region, 2015�2022 (USD Million)
Table 30 Zinc Chemicals Market Size in Other Applications, By Region, 2015�2022 (Kiloton)
Table 31 Zinc Chemicals Market Size, By Region, 2015�2022 (USD Million)
Table 32 Zinc Chemicals Market Size, By Region, 2015�2022 (Kiloton)
Table 33 APAC: Zinc Chemicals Market Size, By Country, 2015�2022 (USD Million)
Table 34 APAC: Zinc Chemicals Market Size, By Country, 2015�2022 (Kiloton)
Table 35 APAC: Zinc Chemicals Market Size, By Type, 2015�2022 (USD Million)
Table 36 APAC: Zinc Chemicals Market Size, By Type, 2015�2022 (Kiloton)
Table 37 APAC: Zinc Chemicals Market Size, By Application, 2015�2022 (USD Million)
Table 38 APAC: Zinc Chemicals Market Size, By Application, 2015�2022 (Kiloton)
Table 39 China: Zinc Chemicals Market Size, By Type, 2015�2022 (USD Million)
Table 40 China: Zinc Chemicals Market Size, By Type, 2015�2022 (Kiloton)
Table 41 China: Zinc Chemicals Market Size, By Application, 2015�2022 (USD Million)
Table 42 China: Zinc Chemicals Market Size, By Application, 2015�2022 (Kiloton)
Table 43 Japan: Zinc Chemicals Market Size, By Type, 2015�2022 (USD Million)
Table 44 Japan: Zinc Chemicals Market Size, By Type, 2015�2022 (Kiloton)
Table 45 Japan: Zinc Chemicals Market Size, By Application, 2015�2022 (USD Million)
Table 46 Japan: Zinc Chemicals Market Size, By Application, 2015�2022 (Kiloton)
Table 47 India: Zinc Chemicals Market Size, By Type, 2015�2022 (USD Million)
Table 48 India: Zinc Chemicals Market Size, By Type, 2015�2022 (Kiloton)
Table 49 India: Zinc Chemicals Market Size, By Application, 2015�2022 (USD Million)
Table 50 India: Zinc Chemicals Market Size, By Application, 2015�2022 (Kiloton)
Table 51 South Korea: Zinc Chemicals Market Size, By Type, 2015�2022 (USD Million)
Table 52 South Korea: Zinc Chemicals Market Size, By Type, 2015�2022 (Kiloton)
Table 53 South Korea: Zinc Chemicals Market Size, By Application, 2015�2022 (USD Million)
Table 54 South Korea: Zinc Chemicals Market Size, By Application, 2015�2022 (Kiloton)
Table 55 Australia & New Zealand: Zinc Chemicals Market Size, By Type, 2015�2022 (USD Million)
Table 56 Australia & New Zealand: Zinc Chemicals Market Size, By Type, 2015�2022 (Kiloton)
Table 57 Australia & New Zealand: Zinc Chemicals Market Size, By Application, 2015�2022 (USD Million)
Table 58 Australia & New Zealand: By Market Size, By Application, 2015�2022 (Kiloton)
Table 59 Indonesia: Zinc Chemicals Market Size, By Type, 2015�2022 (USD Million)
Table 60 Indonesia: Zinc Chemicals Market Size, By Type, 2015�2022 (Kiloton)
Table 61 Indonesia: Zinc Chemicals Market Size, By Application, 2015�2022 (USD Million)
Table 62 Indonesia: Zinc Chemicals Market Size, By Application, 2015�2022 (Kiloton)
Table 63 Malaysia: Zinc Chemicals Market Size, By Type, 2015�2022 (USD Million)
Table 64 Malaysia: Zinc Chemicals Market Size, By Type, 2015�2022 (Kiloton)
Table 65 Malaysia: Zinc Chemicals Market Size, By Application, 2015�2022 (USD Million)
Table 66 Malaysia: Zinc Chemicals Market Size, By Application, 2015�2022 (Kiloton)
Table 67 Rest of APAC: Zinc Chemicals Market Size, By Type, 2015�2022 (USD Million)
Table 68 Rest of APAC: Zinc Chemicals Market Size, By Type, 2015�2022 (Kiloton)
Table 69 Rest of APAC: Zinc Chemicals Market Size, By Application, 2015�2022 (USD Million)
Table 70 Rest of APAC: Zinc Chemicals Market Size, By Application, 2015�2022 (Kiloton)
Table 71 Europe: Zinc Chemicals Market Size, By Country, 2015�2022 (USD Million)
Table 72 Europe: By Market Size, By Country, 2015�2022 (USD Million)
Table 73 Europe: By Market Size, By Type, 2015�2022 (USD Million)
Table 74 Europe: By Market Size, By Type, 2015�2022 (Kiloton)
Table 75 Europe: By Market Size, By Application, 2015�2022 (USD Million)
Table 76 Europe: By Market Size, By Application, 2015�2022 (Kiloton)
Table 77 Germany: By Market Size, By Type, 2015�2022 (USD Million)
Table 78 Germany: By Market Size, By Type, 2015�2022 (Kiloton)
Table 79 Germany: By Market Size, By Application, 2015�2022 (USD Million)
Table 80 Germany: By Market Size, By Application, 2015�2022 (Kiloton)
Table 81 France: By Market Size, By Type, 2015�2022 (USD Million)
Table 82 France: By Market Size, By Type, 2015�2022 (Kiloton)
Table 83 France: By Market Size, By Application, 2015�2022 (USD Million)
Table 84 France: By Market Size, By Application, 2015�2022 (Kiloton)
Table 85 UK: By Market Size, By Type, 2015�2022 (USD Million)
Table 86 UK: By Market Size, By Type, 2015�2022 (Kiloton)
Table 87 UK: By Market Size, By Application, 2015�2022 (USD Million)
Table 88 UK: By Market Size, By Application, 2015�2022 (Kiloton)
Table 89 Russia: By Market Size, By Type, 2015�2022 (USD Million)
Table 90 Russia: By Market Size, By Type, 2015�2022 (Kiloton)
Table 91 Russia: By Market Size, By Application, 2015�2022 (USD Million)
Table 92 Russia: By Market Size, By Application, 2015�2022 (Kiloton)
Table 93 Italy: By Market Size, By Type, 2015�2022 (USD Million)
Table 94 Italy: By Market Size, By Type, 2015�2022 (Kiloton)
Table 95 Italy: By Market Size, By Application, 2015�2022 (USD Million)
Table 96 Italy: By Market Size, By Application, 2015�2022 (Kiloton)
Table 97 Rest of Europe By Market Size, By Type, 015�2022 (USD Million)
Table 98 Rest of Europe By Market Size, By Type, 2015�2022 (Kiloton)
Table 99 Rest of Europe: By Market Size, By Application, 2015�2022 (USD Million)
Table 100 Rest of Europe: By Market Size, By Application, 2015�2022 (Kiloton)
Table 101 North America: By Market Size, By Country, 2015�2022 (USD Million)
Table 102 North America: By Market Size, By Country, 2015�2022 (Kiloton)
Table 103 North America: By Market Size, By Type, 2015�2022 (USD Million)
Table 104 North America: By Market Size, By Type, 2015�2022 (Kiloton)
Table 105 North America: By Market Size, By Application, 2015�2022 (USD Million)
Table 106 North America: By Market Size, By Application, 2015�2022 (Kiloton)
Table 107 US: Zinc Chemicals Market Size, By Type, 2015�2022 (USD Million)
Table 108 US: By Market Size, By Type, 2015�2022 (Kiloton)
Table 109 US: By Market Size, By Application, 2015�2022 (USD Million)
Table 110 US: By Market Size, By Application, 2015�2022 (Kiloton)
Table 111 Canada: By Market Size, By Type, 2015�2022 (USD Million)
Table 112 Canada: By Market Size, By Type, 2015�2022 (Kiloton)
Table 113 Canada: By Market Size, By Application, 2015�2022 (USD Million)
Table 114 Canada: By Market Size, By Application, 2015�2022 (Kiloton)
Table 115 Mexico: By Market Size, By Type, 2015�2022 (USD Million)
Table 116 Mexico: By Market Size, By Type, 2015�2022 (Kiloton)
Table 117 Mexico: By Market Size, By Application, 2015�2022 (USD Million)
Table 118 Mexico: By Market Size, By Application, 2015�2022 (Kiloton)
Table 119 South America: By Market Size, By Country, 2015�2022 (USD Million)
Table 120 South America: By Market Size, By Country, 2015�2022 (Kiloton)
Table 121 South America: By Market Size, By Type, 2015�2022 (USD Million)
Table 122 South America: By Market Size, By Type, 2015�2022 (Kiloton)
Table 123 South America: By Market Size, By Application, 2015�2022 (USD Million)
Table 124 South America: By Market Size, By Application, 2015�2022 (Kiloton)
Table 125 Brazil: By Market Size, By Type, 2015�2022 (USD Million)
Table 126 Brazil: By Market Size, By Type, 2015�2022 (Kiloton)
Table 127 Brazil: By Market Size, By Application, 2015�2022 (USD Million)
Table 128 Brazil: By Market Size, By Application, 2015�2022 (Kiloton)
Table 129 Argentina: By Market Size, By Type, 2015�2022 (USD Million)
Table 130 Argentina: By Market Size, By Type, 2015�2022 (Kiloton)
Table 131 Argentina: By Market Size, By Application, 2015�2022 (USD Million)
Table 132 Argentina: By Market Size, By Application, 2015�2022 (Kiloton)
Table 133 Rest of South America: By Market Size, By Type, 2015�2022 (USD Million)
Table 134 Rest of South America: By Market Size, By Type, 2015�2022 (Kiloton)
Table 135 Rest of South America: By Market Size, By Application, 2015�2022 (USD Million)
Table 136 Rest of South America: By Market Size, By Application, 2015�2022 (Kiloton)
Table 137 Middle East & Africa: By Market Size, By Country, 2015�2022 (USD Million)
Table 138 Middle East & Africa: By Market Size, By Country, 2015�2022 (Kiloton)
Table 139 Middle East & Africa: By Market Size, By Type, 2015�2022 (USD Million)
Table 140 Middle East & Africa: By Market Size, By Type, 2015�2022 (Kiloton)
Table 141 Middle East & Africa: By Market Size, By Application, 2015�2022 (USD Million)
Table 142 Middle East & Africa: By Market Size, By Application, 2015�2022 (Kiloton)
Table 143 Saudi Arabia: By Market Size, By Type, 2015�2022 (USD Million)
Table 144 Saudi Arabia: By Market Size, By Type, 2015�2022 (Kiloton)
Table 145 Saudi Arabia: By Market Size, By Application, 2015�2022 (USD Million)
Table 146 Saudi Arabia: By Market Size, By Application, 2015�2022 (Kiloton)
Table 147 Egypt: By Market Size, By Type, 2015�2022 (USD Million)
Table 148 Egypt: By Market Size, By Type, 2015�2022 (Kiloton)
Table 149 Egypt: By Market Size, By Application, 2015�2022 (USD Million)
Table 150 Egypt: By Market Size, By Application, 2015�2022 (Kiloton)
Table 151 Rest of Middle East & Africa: By Market Size, By Type, 2015�2022 (USD Million)
Table 152 Rest of Middle East & Africa: By Market Size, By Type, 2015�2022 (Kiloton)
Table 153 Rest of Middle East & Africa: By Market Size, By Application, 2015�2022 (USD Million)
Table 154 Rest of Middle East & Africa: By Market Size, By Application, 2015�2022 (Kiloton)
Table 155 Agreements & Contracts, 2013�2016
Table 156 Expansions, 2013�2016
Table 157 Partnerships & Collaborations, 2013�2016
Table 158 New Product Launches, 2013�2016
Table 159 Mergers & Acquisitions, 2013�2016
Table 160 Market Ranking of Zinc Chemicals Manufacturers, 2016
List of Figures (38 Figures)
Figure 1 Zinc Chemicals: Market Segmentation
Figure 2 Zinc Chemicals Market: Research Design
Figure 3 Market Size Estimation: Bottom-Up Approach
Figure 4 Market Size Estimation: Top-Down Approach
Figure 5 Zinc Chemicals Market: Data Triangulation
Figure 6 Zinc Oxide Segment to Lead Overall Zinc Chemicals Market During Forecast Period
Figure 7 Rubber Compounding Segment to Lead Overall Zinc Chemicals Market Between 2017 and 2022
Figure 8 APAC Zinc Chemicals Market to Witness Significant Growth During Forecast Period
Figure 9 Growing Demand for Rubber in Automotive Industry to Drive Zinc Chemicals Market
Figure 10 Rubber Compounding Segment Accounted for Largest Share of Zinc Chemicals Market in APAC
Figure 11 APAC to Be Fastest-Growing Market During Forecast Period
Figure 12 Rubber Compounding Segment Accounted for the Largest Share of Zinc Chemicals Market
Figure 13 Drivers, Restraints, Opportunities, and Challenges in the Zinc Chemicals Market
Figure 14 Zinc Chemicals Market: Porter�s Five Forces Analysis
Figure 15 Zinc Oxide Accounted for Largest Share of Zinc Chemicals Market in Terms of Value, in 2016
Figure 16 APAC to Be Fastest-Growing Market for Zinc Oxide During Forecast Period
Figure 17 APAC to Remain the Largest Market for Zinc Sulfate During Forecast Period
Figure 18 APAC to Be the Fastest-Growing Market for Zinc Carbonate During Forecast Period
Figure 19 APAC to Lead Zinc Chloride During Forecast Period
Figure 20 APAC to Lead Other Zinc Chemicals Market During Forecast Period
Figure 21 Rubber Compounding Was the Largest Segment of the Zinc Chemicals Market in Terms of Value, in 2016
Figure 22 APAC to Be the Fastest-Growing Market for Zinc Chemicals in Rubber Compounding During Forecast Period
Figure 23 APAC to Remain the Largest Market of Zinc Chemicals in Agriculture During Forecast Period
Figure 24 APAC to Be the Fastest-Growing Market for Zinc Chemicals in Glass & Ceramics During Forecast Period
Figure 25 Middle East & Africa to Register the Second-Highest CAGR in Paints & Coatings Between 2017 and 2022
Figure 26 APAC is the Largest Zinc Chemicals Market in Chemical Application During Forecast Period
Figure 27 APAC is the Largest Zinc Chemicals Market in Food & Pharmaceuticals During Forecast Period
Figure 28 APAC is the Largest Zinc Chemicals Market in Textiles During Forecast Period
Figure 29 Europe is the Largest Zinc Chemicals Market in Other Applications During Forecast Period
Figure 30 Regional Snapshot: Rapidly Growing Markets are Emerging as New Hotspots
Figure 31 APAC Snapshot: India to Be Fastest-Growing Market
Figure 32 APAC Market Snapshot: Rubber Compounding to Lead the Demand for Zinc Chemicals
Figure 33 European Market Snapshot: Germany to Lead Zinc Chemicals Market
Figure 34 North America Snapshot: Rubber Compounding to Drive Zinc Chemicals Market
Figure 35 US to Account for the Maximum Share of North American Zinc Chemicals Market
Figure 36 Companies Adopted Agreements & Contracts as the Key Growth Strategy Between 2013 and 2016
Figure 37 Weifang Longda Zinc Industry: SWOT Analysis
Figure 38 Bruggemannchemical: SWOT Analysis


Growth opportunities and latent adjacency in Zinc Chemicals Market