CBCT/Cone Beam Imaging Market by Application (Dental (Oral and Maxillofacial Surgery, Implantology, Orthodontics, Endodontics), Patient Position (Standing/Sitting, Seated, Supine), End User (Hospital, Private Practice) - Global Forecast to 2021


[159 Pages Report] The global cone beam imaging market is expected to reach USD 801.2 Million by 2021 from USD 494.4 Million in 2016, at a CAGR of 10.1% during the forecast period (2016-2021). Growth of this market is primarily driven by factors such as increasing prevalence of dental disorders, growth in geriatric population, growing demand for cosmetic dentistry, and expanding applications of CBCT systems. However, the high costs of the CBCT systems are likely to create impact on the growth of this market.
The cone beam imaging market is categorized on the basis of application, patient position, end user, and region. Based on applications, the market is segmented into dental and other applications. In 2016, the dental applications segment is expected to account for the largest share of the global CBCT systems market as well as register the highest CAGR of during the forecast period. Factors such as low radiation exposure as compared to conventional analog X-rays, increase in the prevalence of dental diseases/conditions, growth in geriatric population, rise in cosmetic dentistry, growing medical tourism for dental services, and introduction of technologically advanced products are contributing to the growth of this segment.
North America is estimated to account for the largest share of the global cone beam imaging market in 2016, followed by Europe. This can be attributed to the factors such as rising incidence of dental disorders, increasing expenditure on dental services, high prevalence of ENT disorders, growing number of orthopedic disorders & sports injuries, rising awareness of CBCT systems through conferences and symposia, and presence of a large number of prominent players in this region.
Prominent players in this market include Danaher Corporation (U.S.), Carestream Health, Inc. (a subsidiary of Onex Corporation) (Canada), Planmeca Group (Finland), Vatech Co., Ltd. (South Korea), Dentsply Sirona (U.S.), Cefla S.C. (Italy), J. Morita MFG. Corp (Japan), Asahi Roentgen IND.CO., LTD. (Japan), PreXion Corporation (Japan), and CurveBeam LLC (U.S.).
Target Audience:
- Cone beam computed tomography (CBCT) manufacturers and suppliers
- Dental/ENT/orthopedic associations
- Dental imaging equipment manufacturers
- Dental/ENT/orthopedic clinics and hospitals
- Academic institutes and universities
- Medical device manufacturers
- Venture capitalists
- Research and consulting firms
To know about the assumptions considered for the study, download the pdf brochure
Scope of the Report
This report categorizes the market into the following segments and subsegments.
Cone Beam Imaging Market, by Application
- Dental Applications
- Implantology
- Oral and Maxillofacial Surgery
- Orthodontics
- Endodontics
- General Dentistry
- Temporomandibular Joint (TMJ) Disorders
- Periodontics
- Forensic Dentistry
- Other Applications*
Cone Beam Imaging Market, by Patient Position
- Standing/Seated
- Seated
- Supine
Cone Beam Imaging Market, by End User
- Hospitals
- Private Practices
- Academic & Research Institutes
Cone Beam Imaging Market, by Region
-
North America
- U.S.
- Canada
-
Europe
- Germany
- U.K.
- France
- Rest of the Europe (RoE)
-
Asia
- Japan
- China
- India
- Rest of Asia (RoA)
- Rest of the World (RoW)*
*Rest of the World (RoW) (Pacific countries, LATAM, the Middle East, and Africa)
*Other Applications include CBCT systems used for orthopedic & sports medicine, ENT and breast imaging
Available Customizations
With the given market data, MarketsandMarkets offers customizations as per the company‘s specific needs.
The following customization options are available for this report.
Company Information
Detailed analysis and profiling of additional market players (up to 5)
Further Split of the Cone beam imaging market for Rest of the World (RoW)
Cone beam imaging market size and growth rarate estimates for Pacific Countries, Latin America, the Middle East, and Africa.
The global cone beam imaging market is expected to reach USD 801.2 Million by 2021 from USD 494.4 Million in 2016, at a CAGR of 10.1% during the forecast period (2016-2021). Factors such as increasing prevalence of dental disorders, growth in geriatric population, growing demand for cosmetic dentistry, and expanding applications of CBCT systems are expected to fuel growth in the market in the coming few years. In addition to this, companies in the market are focusing on collaborating with academic and research institutes to strengthen their brand image as well as to generate future demand for their products. However, the high cost of the CBCT systems is likely to create negative impact on the growth of this market.
On the basis of application, the market is segmented into dental and other applications. In 2016, the dental applications segment is expected to account for the largest share of the global market as well as register the highest CAGR during the forecast period. Factors such as low radiation exposure as compared to conventional analog X-rays, increase in the prevalence of dental diseases/conditions, growth in geriatric population, rise in cosmetic dentistry, growing medical tourism for dental services, and introduction of technologically advanced products are contributing to the growth of this segment.
Based on patient position, the cone beam imaging market is segmented into standing/seated, seated, and supine position. The seated position segment is expected to grow at the highest CAGR from 2016 to 2021. The growth in this segment is driven by the growing preference of CBCT systems for seated position among physicians owing to advantages such as patient comfort and reduced patient movement at the time of scanning.
Based on end users, the market is segmented into hospitals, private practices, and academic & research institutes. The private practices segment is expected to register the highest CAGR during the forecast period. Growing patient preference for treatment in private clinics over hospitals, owing to advantages such as freedom of choosing preferred physicians, quick consultation with doctors, minimum or no hospital stays, and personalized treatment, are driving the growth of the private practices segment in the forecast period.
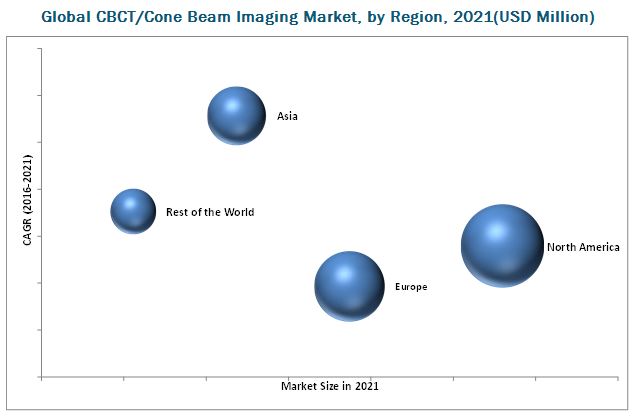
Geographically, North America is estimated to account for the largest share of the global cone beam imaging market in 2016, followed by Europe. Factors such as rising incidence of dental disorders, increasing expenditure on dental services, high prevalence of ENT disorders, growing number of orthopedic disorders & sports injuries, rising awareness of CBCT systems through conferences and symposia, and presence of a large number of prominent players in this region are driving the growth of the North American CBCT systems market in the forecast period.
The cone beam imaging market is a highly competitive one due to the presence of various well established as well as emerging players in the market. Some of the key players in the market are Danaher Corporation (U.S.), Carestream Health, Inc. (a subsidiary of Onex Corporation) (Canada), Planmeca Group (Finland), Vatech Co., Ltd. (South Korea), Dentsply Sirona (U.S.), Cefla S.C. (Italy), J. Morita MFG. Corp (Japan), Asahi Roentgen IND.CO., LTD. (Japan), PreXion Corporation (Japan), and CurveBeam LLC (U.S.).
To speak to our analyst for a discussion on the above findings, click Speak to Analyst
 Exclusive indicates content/data unique to MarketsandMarkets and not available with any competitors.
Table of Contents
1 Introduction (Page No. - 14)
1.1 Objectives of the Study
1.2 Market Definition
1.2.1 Markets Covered
1.2.2 Years Considered for the Study
1.3 Currency
1.4 Limitations
1.5 Stakeholders
2 Research Methodology (Page No. - 17)
2.1 Market Size Estimation
2.2 Market Breakdown and Data Triangulation
2.2.1 Key Data From Secondary Sources
2.2.2 Key Data Points From Primary Sources
2.2.3 Key Industry Insights
2.3 Assumptions for the Study
3 Executive Summary (Page No. - 24)
4 Premium Insights (Page No. - 29)
4.1 Cone Beam Computed Tomography (CBCT) Systems: Market Overview
4.2 Cone Beam Computed Tomography (CBCT) Systems Market Size, By Application, 2016 vs 2021
4.3 Cone Beam Computed Tomography (CBCT) Systems Market Size, By Dental Application
4.4 Cone Beam Computed Tomography (CBCT) Systems Market, By Patient Position
4.5 Cone Beam Computed Tomography (CBCT) Systems Market Size, By End User
4.6 Cone Beam Computed Tomography (CBCT) Systems Market: Geographic Growth Opportunities
5 Market Overview (Page No. - 33)
5.1 Introduction
5.2 Market Dynamics
5.2.1 Market Drivers
5.2.1.1 Rise in Prevalence of Dental Disorders
5.2.1.2 Growing Demand for Cosmetic Dentistry
5.2.1.3 Expanding Application Areas of CBCT Systems
5.2.2 Market Restraints
5.2.2.1 High Cost of CBCT Systems
5.2.3 Market Opportunities
5.2.3.1 Acceptance of CBCT Systems for Breast Imaging
5.2.3.2 Emerging Economies
5.2.4 Market Challenges
5.2.4.1 Management of High Volumes of Image Data
5.2.4.2 Survival of New Entrants and Small Players
6 Cone Beam Imaging Market, By Application (Page No. - 39)
6.1 Introduction
6.2 Dental Applications
6.2.1 Implantology
6.2.2 Oral and Maxillofacial Surgery
6.2.3 Orthodontics
6.2.4 Endodontics
6.2.5 General Dentistry
6.2.6 Temporomandibular Joint (TMJ) Disorders
6.2.7 Periodontics
6.2.8 Forensic Dentistry
6.3 Other Applications
7 Cone Beam Imaging Market, By Patient Position (Page No. - 65)
7.1 Introduction
7.2 Standing/Seated Position
7.3 Seated Position
7.4 Supine Position
8 Cone Beam Imaging Market, By End User (Page No. - 74)
8.1 Introduction
8.2 Hospitals
8.3 Private Practices
8.4 Academic and Research Institutes
9 Cone Beam Imaging Market, By Region (Page No. - 84)
9.1 Introduction
9.2 North America
9.2.1 U.S.
9.2.2 Canada
9.3 Europe
9.3.1 Germany
9.3.2 U.K.
9.3.3 France
9.3.4 Rest of Europe (RoE)
9.4 Asia
9.4.1 Japan
9.4.2 China
9.4.3 India
9.4.4 Rest of Asia (RoA)
9.5 Rest of the World (RoW)
10 Competitive Landscape (Page No. - 124)
10.1 Overview
10.2 Strategic Overview
10.3 Market Ranking Analysis ,By Key Player
10.4 Competitive Situation and Trends
10.4.1 Product Launches and Approvals
10.4.2 Partnerships, Agreements and Collaborations
10.4.3 Mergers & Acquisitions
10.4.4 Expansions
11 Company Profiles (Page No. - 132)
(Overview, Products and Services, Financials, Strategy & Development)*
11.1 Introduction
11.2 Carestream Health, Inc. (Subsidiary of Onex Corporation)
11.3 Danaher Corporation
11.4 Planmeca Group
11.5 Dentsply Sirona
11.6 Vatech Co., Ltd.
11.7 Cefla S.C.
11.8 Asahi RoEntgen Ind. Co., Ltd.
11.9 J. Morita Mfg. Corp.
11.10 Curve Beam LLC
11.11 Prexion Corporation
*Details on Overview, Products and Services, Financials, Strategy & Development Might Not Be Captured in Case of Unlisted Companies.
12 Appendix (Page No. - 149)
12.1 Insights From Industry Experts
12.2 Discussion Guide
12.3 Other Developments
12.3.1 Danaher Corporation
12.3.2 Planmeca Group
12.4 Knowledge Store: Marketsandmarkets’ Subscription Portal
12.6 Available Customizations
12.7 Related Reports
12.8 Author Details
List of Tables (140 Tables)
Table 1 Recent Product Launches (2013–2016)
Table 2 Statistics on Aging Population
Table 3 Recent U.S. Fda Approvals for CBCT Systems in Non-Dental Applications
Table 4 CBCT Systems Market: Strategic Developments in Emerging Markets
Table 5 Global Cone Beam Imaging Systems Market Size, By Application, 2014–2021 (USD Million)
Table 6 Product Launches (2013–2015)
Table 7 Commercially Available Dental CBCT Systems
Table 8 Global CBCT Systems Market Size for Dental Applications, By Type, 2014–2021 (USD Million)
Table 9 Global Cone Beam Imaging Systems Market Size for Implantology, By Region, 2014–2021 (USD Million)
Table 10 North America: CBCT Systems Market Size for Implantology, By Country, 2014–2021 (USD Million)
Table 11 Europe: Market Size for Implantology, By Country, 2014–2021 (USD Million)
Table 12 Asia: Market Size for Implantology, By Country, 2014–2021 (USD Million)
Table 13 Global Cone Beam Imaging Systems Market Size for Oral and Maxillofacial Surgery, By Region, 2014–2021 (USD Million)
Table 14 North America: CBCT Systems Market Size for Oral and Maxillofacial Surgery, By Country, 2014–2021 (USD Million)
Table 15 Europe: Market Size for Oral and Maxillofacial Surgery, By Country, 2014–2021 (USD Million)
Table 16 Asia: Cone Beam Imaging Systems Market Size for Oral and Maxillofacial Surgery, By Country, 2014–2021 (USD Million)
Table 17 Global CBCT Systems Market Size for Orthodontics, By Region, 2014–2021 (USD Million)
Table 18 North America: CBCT Systems Market Size for Orthodontics, By Country, 2014–2021 (USD Million)
Table 19 Europe: Cone Beam Imaging Market Size for Orthodontics, By Country, 2014–2021 (USD Million)
Table 20 Asia: CBCT Systems Market Size for Orthodontics, By Country, 2014–2021 (USD Million)
Table 21 Global CBCT Systems Market Size for Endodontics, By Region, 2014–2021 (USD Million)
Table 22 North America: Cone Beam Imaging Systems Market Size for Endodontics, By Country, 2014–2021 (USD Million)
Table 23 Europe: Market Size for Endodontics, By Country, 2014–2021 (USD Million)
Table 24 Asia: CBCT Systems Market Size for Endodontics, By Country, 2014–2021 (USD Million)
Table 25 Global Cone Beam Imaging Market Size for General Dentistry, By Region, 2014–2021 (USD Million)
Table 26 North America: CBCT Systems Market Size for General Dentistry, By Country, 2014–2021 (USD Million)
Table 27 Europe: CBCT Systems Market Size for General Dentistry, By Country, 2014–2021 (USD Million)
Table 28 Asia: Cone Beam Imaging Systems Market Size for General Dentistry, By Country, 2014–2021 (USD Million)
Table 29 Global CBCT Systems Market Size for TMJ Disorders, By Region, 2014–2021 (USD Million)
Table 30 North America: Market Size for TMJ Disorders, By Country, 2014–2021 (USD Million)
Table 31 Europe: Cone Beam Imaging Market Size for TMJ Disorders, By Country, 2014–2021 (USD Million)
Table 32 Asia: Market Size for TMJ Disorders, By Country, 2014–2021 (USD Million)
Table 33 Global Cone Beam Imaging Systems Market Size for Periodontics, By Region, 2014–2021 (USD Million)
Table 34 North America: CBCT Systems Market Size for Periodontics, By Country, 2014–2021 (USD Million)
Table 35 Europe: Market Size for Periodontics, By Country, 2014–2021 (USD Million)
Table 36 Asia: Market Size for Periodontics, By Country, 2014–2021 (USD Million)
Table 37 Global Cone Beam Imaging Market Size for Forensic Dentistry, By Region, 2014–2021 (USD Million)
Table 38 North America: CBCT Systems Market Size for Forensic Dentistry, By Country, 2014–2021 (USD Million)
Table 39 Europe: Cone Beam Imaging Systems Market Size for Forensic Dentistry, By Country, 2014–2021 (USD Million)
Table 40 Asia: CBCT Systems Market Size for Forensic Dentistry, By Country, 2014–2021 (USD Million)
Table 41 Cone Beam Ct Imaging Applications in Ent (Ear, Nose and Throat)
Table 42 Orthopedic CBCT Systems: Fda Approvals
Table 43 Global CBCT Systems Market Size for Other Applications, By Region, 2014–2021 (USD Million)
Table 44 North America: CBCT Systems Market Size for Other Applications, By Country, 2014–2021 (USD Million)
Table 45 Europe: CBCT Systems Market Size for Other Applications, By Country, 2014–2021 (USD Million)
Table 46 Asia: CBCT Systems Market Size for Other Applications, By Country, 2014–2021 (USD Million)
Table 47 CBCT Systems Market Size, By Patient Position, 2014–2021 (USD Million)
Table 48 Commercially Available CBCT Systems for Standing/Seated Position
Table 49 Cone Beam Imaging Systems Market Size for Standing/Seated Position, By Region, 2014–2021 (USD Million)
Table 50 North America: CBCT Systems Market Size for Standing/Seated Position, By Country, 2014–2021 (USD Million)
Table 51 Europe: Cone Beam Imaging Market Size for Standing/Seated Position, By Country, 2014–2021 (USD Million)
Table 52 Asia: Market Size for Standing/Seated Position, By Country, 2014–2021 (USD Million)
Table 53 Commercially Available CBCT Systems for Seated Position
Table 54 CBCT Systems Market Size for Seated Position, By Region, 2014–2021 (USD Million)
Table 55 North America: Market Size for Seated Position, By Country, 2014–2021 (USD Million)
Table 56 Europe: Cone Beam Imaging Market Size for Seated Position, By Country, 2014–2021 (USD Million)
Table 57 Commercially Available CBCT Systems for Supine Position
Table 58 Cone Beam Imaging Systems Market Size for Supine Position, By Region, 2014–2021 (USD Million)
Table 59 North America: CBCT Systems Market Size for Supine Position, By Country, 2014–2021 (USD Million)
Table 60 Europe: CBCT Systems Market Size for Supine Position, By Country, 2014–2021 (USD Million)
Table 61 Asia: Cone Beam Imaging Market Size for Supine Position, By Country, 2014–2021 (USD Million)
Table 62 CBCT Systems Market Size, By End User, 2014–2021 (USD Million)
Table 63 Market Size for Hospitals, By Region, 2014–2021 (USD Million)
Table 64 North America: CBCT Systems Market Size for Hospitals, By Country, 2014–2021 (USD Million)
Table 65 Europe: Cone Beam Imaging Systems Market Size for Hospitals, By Country, 2014–2021 (USD Million)
Table 66 Asia: CBCT Systems Market Size for Hospitals, By Country, 2014–2021 (USD Million)
Table 67 CBCT Systems Market Size for Private Practices, By Region, 2014–2021 (USD Million)
Table 68 North America: Cone Beam Imaging Market Size for Private Practices, By Country, 2014–2021 (USD Million)
Table 69 Europe: CBCT Systems Market Size for Private Practices, By Country, 2014–2021 (USD Million)
Table 70 Asia: CBCT Systems Market Size for Private Practices, By Country, 2014–2021 (USD Million)
Table 71 Cone Beam Imaging Systems Market Size for Academic and Research Institutes, By Region, 2014–2021 (USD Million)
Table 72 North America: Market Size for Academic and Research Institutes, By Country, 2014–2021 (USD Million)
Table 73 Europe: Market Size for Academic and Research Institutes, By Country, 2014–2021 (USD Million)
Table 74 Asia: Market Size for Academic and Research Institutes, By Country, 2014–2021 (USD Million)
Table 75 CBCT Systems Market Size, By Region, 2014-2021 (USD Million)
Table 76 North America: CBCT Systems Market Size, By Country, 2014-2021 (USD Million)
Table 77 North America: Cone Beam Imaging Systems Market Size, By Application, 2014-2021 (USD Million)
Table 78 North America: CBCT Systems Market Size for Dental Applications, By Type, 2014-2021 (USD Million)
Table 79 North America: Cone Beam Imaging Market Size, By Patient Position, 2014-2021 (USD Million)
Table 80 North America: CBCT Systems Market Size, By End User, 2014-2021 (USD Million)
Table 81 U.S.: CBCT Systems Market Size, By Application, 2014-2021 (USD Million)
Table 82 U.S.: Cone Beam Imaging Systems Market Size for Dental Applications, By Type, 2014-2021 (USD Million)
Table 83 U.S.: CBCT Systems Market Size, By Patient Position, 2014-2021 (USD Million)
Table 84 U.S.: Market Size, By End User, 2014-2021 (USD Million)
Table 85 Canada: CBCT Systems Market Size, By Application, 2014-2021 (USD Million)
Table 86 Canada: Cone Beam Imaging Systems Market Size for Dental Applications, By Type, 2014-2021 (USD Million)
Table 87 Canada: CBCT Systems Market Size, By Patient Position, 2014-2021 (USD Million)
Table 88 Canada: Market Size, By End User, 2014-2021 (USD Million)
Table 89 Europe: CBCT Systems Market Size, By Country/Region, 2014-2021 (USD Million)
Table 90 Europe: Cone Beam Imaging Systems Market Size, By Application, 2014-2021 (USD Million)
Table 91 Europe: CBCT Systems Market Size for Dental Applications, By Type, 2014-2021 (USD Million)
Table 92 Europe: Cone Beam Imaging Market Size, By Patient Position, 2014-2021 (USD Million)
Table 93 Europe: CBCT Systems Market Size, By End User, 2014-2021 (USD Million)
Table 94 Germany: CBCT Systems Market Size, By Application, 2014-2021 (USD Million)
Table 95 Germany: Cone Beam Imaging Systems Market Size for Dental Applications, By Type, 2014-2016 (USD Million)
Table 96 Germany: CBCT Systems Market Size, By Patient Position, 2014-2021 (USD Million)
Table 97 Germany: Market Size, By End User, 2014-2021 (USD Million)
Table 98 U.K.: CBCT Systems Market Size, By Application, 2014-2021 (USD Million)
Table 99 U.K.: Cone Beam Imaging Systems Market Size for Dental Applications, By Type, 2014-2021 (USD Million)
Table 100 U.K.: CBCT Systems Market Size, By Patient Position, 2014-2021 (USD Million)
Table 101 U.K.: Cone Beam Imaging Market Size, By End User, 2014-2021 (USD Million)
Table 102 France: CBCT Systems Market Size, By Application, 2014-2021 (USD Million)
Table 103 France: Cone Beam Imaging Systems Market Size for Dental Applications, By Type, 2014-2021 (USD Million)
Table 104 France: CBCT Systems Market Size, By Patient Position, 2014-2021 (USD Million)
Table 105 France: Cone Beam Imaging Market Size, By End User, 2014-2021 (USD Million)
Table 106 RoE: CBCT Systems Market Size, By Application, 2014-2021 (USD Million)
Table 107 RoE: Cone Beam Imaging Systems Market Size for Dental Applications, By Type, 2014-2021 (USD Million)
Table 108 RoE: CBCT Systems Market Size, By Patient Position, 2014-2021 (USD Million)
Table 109 RoE: Market Size, By End User, 2014-2021 (USD Million)
Table 110 Asia: CBCT Systems Market Size, By Country/Region, 2014-2021,(USD Million)
Table 111 Asia: Cone Beam Imaging Systems Market Size, By Application, 2014-2021 (USD Million)
Table 112 Asia: CBCT Systems Market Size for Dental Applications, By Type, 2014-2021 (USD Million)
Table 113 Asia: Cone Beam Imaging Market Size, By Patient Position, 2014-2021 (USD Million)
Table 114 Asia: CBCT Systems Market Size, By End User, 2014-2021 (USD Million)
Table 115 Japan: CBCT Systems Market Size, By Application, 2014-2021 (USD Million)
Table 116 Japan: Cone Beam Imaging Systems Market Size for Dental Applications, By Type, 2014-2021 (USD Million)
Table 117 Japan: CBCT Systems Market Size, By Patient Position, 2014-2021 (USD Million)
Table 118 Japan: Cone Beam Imaging Market Size, By End User, 2014-2021 (USD Million)
Table 119 China: CBCT Systems Market Size, By Application, 2014-2021 (USD Million)
Table 120 China: Cone Beam Imaging Systems Market Size for Dental Applications, By Type, 2014-2021 (USD Million)
Table 121 China: CBCT Systems Market Size, By Patient Position, 2014-2021 (USD Million)
Table 122 China: Cone Beam Imaging Market Size, By End User, 2014-2021 (USD Million)
Table 123 India: CBCT Systems Market Size, By Application, 2014-2021 (USD Million)
Table 124 India: Cone Beam Imaging Systems Market Size for Dental Applications, By Type, 2014-2021 (USD Million)
Table 125 India: CBCT Systems Market Size, By Patient Position, 2014-2021 (USD Million)
Table 126 India: CBCT Systems Market Size, By End User, 2014-2021 (USD Million)
Table 127 Singapore: Average Cost of Dental Procedures
Table 128 RoA: CBCT Systems Market Size, By Application, 2014-2021 (USD Million)
Table 129 RoA: Cone Beam Imaging Systems Market Size for Dental Applications, By Type, 2014-2021 (USD Million)
Table 130 RoA: CBCT Systems Market Size, By Patient Position, 2014-2021 (USD Million)
Table 131 RoA: CBCT Systems Market Size, By End User, 2014-2021 (USD Million)
Table 132 RoW: CBCT Systems Market Size, By Application, 2014-2021 (USD Million)
Table 133 RoW: Cone Beam Imaging Systems Market Size for Dental Applications, By Type, 2014-2021 (USD Million)
Table 134 RoW: CBCT Systems Market Size, By Patient Positioning, 2014-2021 (USD Million)
Table 135 RoW: CBCT Systems Market Size, By End User, 2014-2021 (USD Million)
Table 136 Cone Beam Computed Technology (CBCT) Systems Market Ranking, By Key Player
Table 137 Product Launches and Approvals, 2013–2016
Table 138 Partnerships, Agreements, and Collaborations, 2013–2016
Table 139 Mergers & Acquisitions, 2013–2016
Table 140 Expansions, 2013–2016
List of Figures (34 Figures)
Figure 1 Cone Beam Computed Tomography (CBCT) Systems: Market Segmentation
Figure 2 Research Design
Figure 3 Market Size Estimation: Bottom-Up Approach
Figure 4 Market Size Estimation: Top Down Approach
Figure 5 Breakdown of Primary Interviews: By Company Type, Designation, and Region
Figure 6 Data Triangulation Methodology
Figure 7 Global Cone Beam Computed Tomography (CBCT) Systems Market Size By Application, 2016 vs 2021 (USD Million)
Figure 8 Global Cone Beam Computed Tomography (CBCT) Systems Market, By Patient Position
Figure 9 Global Cone Beam Computed Tomography (CBCT) Systems Market Size, By End User, 2016 vs 2021 (USD Million)
Figure 10 Geographic Snapshot of the Cone Beam Computed Tomography (CBCT) Systems Market
Figure 11 Expanding Application Areas of CBCT Systems to Drive Market Growth
Figure 12 Dental Application Segment to Dominate the CBCT Systems Market During Forecast Period
Figure 13 Implantology is Expected to Account for the Largest Share in 2016
Figure 14 CBCT Systems for Seated Position to Register the Highest CAGR From 2016 to 2021
Figure 15 Hospitals to Account for the Largest End User Segment of the Cone Beam Imaging Systems Market in 2016
Figure 16 China and India to Witness Highest Growth During the Forecast Period
Figure 17 CBCT Systems Market: Drivers, Restraints, Opportunities, and Challenges
Figure 18 Dental Applications to Witness Highest Growth During the Forecast Period
Figure 19 Implantology to Dominate the Dental Applications Segment During the Forecast Period
Figure 20 North America to Command the Largest Share During the Forecast Period
Figure 21 CBCT Systems for Standing/Seated Position to Dominate the Market During the Forecast Period
Figure 22 Hospitals to Command the Largest Share of the CBCT Systems Market, By End User, in 2016
Figure 23 North America to Dominate the Global Cone Beam Imaging Systems Market in 2016
Figure 24 North America: CBCT Systems Market Snapshot
Figure 25 Europe: Cone Beam Imaging Systems Market Snapshot
Figure 26 Asia: CBCT Systems Market Snapshot
Figure 27 RoW: Cone Beam Imaging Systems Market Snapshot
Figure 28 Key Developments in the CBCT Systems Market, 2013-2016
Figure 29 Market Evolution Framework
Figure 30 Battle for Market Share: Product Launches and Approvals Was the Key Growth Strategy Adopted By Market Players Between 2013 and 2016
Figure 31 Application Benchmarking for the Top 5 Players
Figure 32 Company Snapshot: Onex Corporation
Figure 33 Company Snapshot: Danaher Corporation
Figure 34 Company Snapshot: Dentsply Sirona

 Generating Response ...


Growth opportunities and latent adjacency in CBCT/Cone Beam Imaging Market