Dental Equipment Market Size, Growth by Product (Dental Imaging Equipment (Panoramic, Sensor, Camera), Lasers, Diode Lasers, Dental Chairs, CAD/CAM, Handpieces, Dental Units, Casting Machines) & End User ( Laboratories, Hospitals, Clinics) - Global Forecasts to 2026
Market Size
The dental equipment market size is projected to reach USD 8.9 billion by 2026, at a CAGR of 7.7% during the forecast period.
Market Growth
Growth of this market is mainly driven by factors such as the increasing prevalence of oral health disorders, sedentary and changing lifestyles, growing consumer awareness, and rising dental tourism. On the contrary, lack of reimbursement for dental procedures and high cost of dental imaging systems are factors expected to restrain the market growth to a certain extent.To know about the assumptions considered for the study, Request for Free Sample Report
Dental Equipment Market Dynamics
Drivers: Rising dental tourism in emerging markets
Dental tourism is one of the most lucrative segments of the medical tourism industry. This market has grown exponentially in the last few years, with India, Mexico, Hungary, Poland, and Turkey emerging as fast-growing dental tourism destinations. Growth in these markets can primarily be attributed to their low prices of dental treatments compared to developed economies and infrastructural development. Along with the major cost advantage, dental tourism also offers shorter waiting durations.
The number of patients traveling from high-cost locations to low-cost treatment destinations across Asia, Latin America, and Eastern Europe is expected to increase in the coming years. The distance traveled by patients also plays a major role in the growth of the dental tourism industry in a given country, as traveling costs should also be considered while selecting a treatment destination. Many countries, such as Thailand, Malaysia, and Hungary, offer dental tour packages that encompass the required dental treatments and a vacation, thus attracting patients from developed countries.
As a result, dental tourism provides manufacturers and distributors with abundant opportunities to establish themselves in emerging economies. Such activities fuel the demand for cosmetic dental equipment and consumables and drive the growth of the market.
Furthermore, technologies used in dental diagnostics and treatments have become more effective, less painful, and time & cost-efficient, which are the major factors influencing their adoption. For instance, with the advent of digital radiology, images captured by intraoral and extraoral scanners can be easily viewed on digital displays. Digital dental radiology equipment is easy to operate and provides precise and high-quality images, thus eliminating the time spent, cost, and chemical wastage associated with film processing. This also helps in reducing the time of diagnosis and treatment, as the images are immediately available and can be shared with a practitioner or dental laboratories through the internet to obtain faster consultations/results.
CAD/CAM systems are another example of advanced dental technology; the system effectively designs dental prostheses in a 3D format and manufactures them with the help of milling machines. Restorations designed using CAD/CAM systems are considered more durable, close-fitting, and efficient than traditional lab-fabricated ones. Thus, the digitalization of dental equipment is expected to drive the growth of the dental equipment market.
Opportunities: Increasing number of dental laboratories investing in CAD/CAM
The dental industry is increasingly embracing computer-aided design (CAD)/computer-aided manufacturing (CAM) due to its high precision in dental restoration and digital orthodontics. These technologies are used to develop milled crowns, dentures, bridges, and fabricated abutments used in dental restoration procedures. They can also provide personalized brackets and removable braces for orthodontic treatments. The increasing use of CAD/CAM has reduced the need to wear temporary bridges/crowns during dental restoration treatments, enabled less time-consuming treatment procedures, and reduced the number of doctor visits.
Although most prosthetic elements are still manufactured manually, the use of CAD/CAM prosthetic elements is increasing due to their advantages, such as customization. Their adoption has also grown due to the increasing shift towards digitalization. Recent developments in this regard include:
- In November 2019, 3Shape partnered with Ivoclar to integrate the 3Shape TRIOS Intraoral Scanner and the TRIOS Design Studio to provide an advanced CAD/CAM milling solution.
- During 2016–2018, many leading players in the orthodontic supplies market, including 3M, Ormco, Henry Schein, Align Technology, American Orthodontics, and Rocky Mountain Orthodontics, partnered with 3Shape (Denmark) to integrate its orthodontic workflow software and digital CAD/CAM technologies with their existing product offerings.
Restraints: High cost of dental imaging systems and lack of reimbursement for dental procedures
Digital dental imaging systems, such as digital dental X-ray and dental CBCT systems, enable the accurate diagnosis of dental conditions by offering high-quality images. However, the high costs of these systems are limiting their adoption. As a result, only a limited number of end users can afford these systems—this excludes budget-constrained small or medium-sized hospitals. Moreover, dentists, especially in developing countries, would prefer using cost-effective second-hand or refurbished instruments and equipment.
In developed countries across North America and Europe, most insurance providers consider dental implants and clear aligners as a cosmetic product and provide minimal or no reimbursement. Therefore, a major portion of the cost of these dental procedures has to be borne by patients, with little support from insurance coverage. Due to this, the decision of patients to opt for treatment is largely dependent on its affordability. This is a major factor restricting the adoption of high-cost treatments in developed countries. Developing markets across the Asia Pacific are also facing similar issues; countries such as Japan, China, India, South Korea, and Mexico lack proper dental reimbursement frameworks. Most people in countries like India and China are not covered under dental insurance. As a result, the decision of patients to opt for treatment is largely dependent on its affordability. Also, these countries have many single practitioners who lack the financial resources to procure expensive equipment, which hampers the market growth.
Challenges: Dearth of trained dental practitioners
The demand for dental care services is expected to grow globally due to the changing demographics, growing dental care awareness, sedentary lifestyles, and the rising prevalence of dental diseases. However, a shortage of dental professionals in countries poses a significant challenge. According to the Health Resources and Services Administration (HRSA), 198,517 dentists were active in 2017 in the US, which is expected to increase to 202,600 by 2025. Based on dental workforce data from 2012, it is estimated that the excess growth in demand in relation to dentist supply will result in a national shortage of dental professionals in the US. For instance, as per the National Health Resources and Services Administration, the US will face a shortage of over 4,000 general dentists in 2030.
According to the Health Resources and Services Administration (HRSA), 198,517 dentists were active in 2017 in the US, which is expected to increase to 202,600 by 2025. Similarly, regions such as Africa, Asia, and Latin America have a shortage of oral health personnel. For instance, in Africa, the dentist-to-population ratio is ~1:150,000 (this figure is ~1:2,000 in developed countries). According to the Ministry of Health and Welfare, in 2016, the dentist-to-population ratio in India was 1:8,000 in urban areas and 1:50,000 in rural areas. The shortage of dentists in these countries is one of the major challenges expected to reduce the adoption of dental equipment despite their large target patient population.
Diagnostic dental equipment is expected to be the fastest growing segment in the forecast period.
The therapeutic dental equipment segment held the largest share of the dental equipment market, while diagnostic dental equipment was expected to be the fatsest growing segment in the forecast period. The extraoral imaging systems accounted for the largest share of 62.7% of the diagnostic dental equipment segment. The increasing patient pool, demand for efficient minimally invasive dental surgeries, and rising awareness will augment the demand for extraoral imaging systems.
The dental hospitals & clinics segment dominated the dental equipment market.
The hospitals & clinics segment accounted for the largest segment of the dental equipment market. This can primarily be attributed to factors such as the advent of advanced technologies, rise in the number of dental clinics and hospitals across the globe, rising popularity of dental tourism, and the growing number of group dental practices in developed countries.
Asia Pacific and Latin America expected to grow at the highest CAGR during the forecast period
In 2020, Europe accounted for the largest share of the dental equipment market, followed by North America and the Asia Pacific. Factors like presence of the growing demand for cosmetic dentistry and the rising patient population for dental diseases. Asia Pacific and Latin America were expected to be the fastest growing regions during the forecast period. This growth is driven by factors such as rising dental tourism, relatively flexible regulatory scenario, and increasing number of healthcare facilities.
To know about the assumptions considered for the study, download the pdf brochure
Dental Equipment Market Key Players
Some of the key players operating in this market includes DENTSPLY Sirona (US), Planmeca Group (Finland), Envista Holdings (US), Align Technology (US), A-dec Inc. (US), J. MORITA CORP. (Japan), GC Corporation (Japan), Midmark Corporation (US), Straumann Holdings AG (Switzerland), 3M Company (US), BIOLASE, Inc. (US), 3Shape A/S (Denmark), BEGO GmbH & Co. Kg (Germany), Ultradent Products, Inc. (US), Yoshida Dental MFG. Co., Ltd. (Japan), Nakanishi Inc. (Japan), DentalEZ, Inc. (US), Carestream Dental LLC. (US), Takara Belmont Corporation (Japan), Nova Instruments (UK), NewTom (Italy), Millennium Dental Technologies, Inc. (US), PreXion, Inc. (Japan), Brasseler USA (US), Ivoclar Vivadent AG (Liechtenstein), AMD LASERS (US), Aseptico (US), and BIEN-AIR DENTAL (US), among others.
Scope of the Dental Equipment Market Report
Report Metric |
Details |
Market Size by 2026 |
USD 8.9 billion |
CAGR |
7.7% |
Forecast to |
2026 |
Forecast Unit |
Value (USD Billion) |
Segments Covered |
Product, End user |
Region/Countries Covered |
|
The research report categorizes the dental equipment market into the following segments and sub-segments:
By Product
- Therapeutic Dental Equipment
- Dental Operatory & Treatment Center Equipment
- Dental Units
- Instrument Delivery Systems
- Dental Chairs
- Dental Handpieces
- Dental Light-curing Equipment
- Other Dental Operatory & Treatment Center Equipment
- Dental Units
- General Equipment
- CAD/CAM Systems
- Electrosurgical Systems
- Casting Machines
- Ceramic Furnaces
- Dental Lasers
- Soft-tissue Lasers
- Diode Lasers
- Carbon Dioxide (CO2) Lasers
- Nd:YAG Lasers
- All-Tissue (Hard/Soft) Lasers
- Er:YAG Lasers
- Er,Cr:YSGG Lasers
- Soft-tissue Lasers
- Dental Operatory & Treatment Center Equipment
- Diagnostic Systems
- Extraoral Imaging Systems
- Panoramic Systems
- 3D CBCT Systems
- Panoramic & Cephalometric Systems
- Intraoral Imaging Systems
- Intraoral X-Ray Systems
- Intraoral Sensors
- Intraoral Photostimulable Phosphor Systems
- Intraoral Cameras
- Extraoral Imaging Systems
- Dental Imaging Software
By End User
- Hospitals and Clinics
- Dental Academic & Research Institutes
- Other End Users
By Region
- North America
- US
- Canada
- Europe
- German
- Italy
- France
- Spain
- UK
- Rest of Europe
- Asia Pacific
- China
- Japan
- India
- Rest of APAC
- Latin America
- Middle East and Africa
Recent Developments
- In May 2021, DENTSPLY Sirona Inc. (US) did partnership with North American Dental Group (US). North American Dental Group and DENTSPLY Sirona extended their partnership for technology and clinical solutions.
- In March 2021, Midmark Corporation opened new experience and technology centers located on the company’s Versailles, Ohio campus.
- In January 2021, DENTSPLY Sirona Inc. (US) acquired Byte (LA) for USD 1.04 billion in order to strengthen DENTSPLY Sirona’s clear aligner category and its connections with dental professionals
- In April 2020, Planmeca group launched Planmeca ProScanner 2.0 imaging plate scanner, which is used for fast and dependable intraoral imaging. The system is durable and supports everyday tasks at a dental clinic. This strategy will expand the company’s product portfolio.
Frequently Asked Questions (FAQ):
Which are the top industry players in the dental equipment market?
Some of the top market players in the dental equipment market include DENTSPLY Sirona (US), Planmeca Group (Finland), Envista Holdings (US), Align Technology (US), A-dec Inc. (US), J. MORITA CORP. (Japan), GC Corporation (Japan), Midmark Corporation (US), Straumann Holdings AG (Switzerland), 3M Company (US), BIOLASE, Inc. (US), 3Shape A/S (Denmark), BEGO GmbH & Co. Kg (Germany), Ultradent Products, Inc. (US), Yoshida Dental MFG. Co., Ltd. (Japan), Nakanishi Inc. (Japan), DentalEZ, Inc. (US), Carestream Dental LLC. (US), Takara Belmont Corporation (Japan), Nova Instruments (UK), NewTom (Italy), Millennium Dental Technologies, Inc. (US), PreXion, Inc. (Japan), Brasseler USA (US), Ivoclar Vivadent AG (Liechtenstein), AMD LASERS (US), Aseptico (US), and BIEN-AIR DENTAL (US), among others.
What are the top trends in the dental equipment market?
Trends in the dental equipment market:
- Rising number of minimally invasive dental procedures
- Market consolidation
- Focus on product development
- Increasing preference for dental group practices
- Trends of dental insurance in the US
- Automated Patient Tracking & Management Software
- Robotic dentists and AI
Which dental equipment market, by product type, have been included in this report?
The dental equipment market, by product, is categorized into:
- Therapeutic Dental Equipment
- Dental Operatory & Treatment Center Equipment
- Dental Units
- Instrument Delivery Systems
- Dental Chairs
- Dental Handpieces
- Dental Light-curing Equipment
- Other Dental Operatory & Treatment Center Equipment
- Dental Units
- General Equipment
- CAD/CAM Systems
- Electrosurgical Systems
- Casting Machines
- Ceramic Furnaces
- Dental Lasers
- Soft-tissue Lasers
- Diode Lasers
- Carbon Dioxide (CO2) Lasers
- Nd: YAG Lasers
- All-Tissue (Hard/Soft) Lasers
- Er: YAG Lasers
- Er,Cr: YSGG Lasers
- Soft-tissue Lasers
- Dental Operatory & Treatment Center Equipment
- Diagnostic Systems
- Extraoral Imaging Systems
- Panoramic Systems
- 3D CBCT Systems
- Panoramic & Cephalometric Systems
- Intraoral Imaging Systems
- Intraoral X-Ray Systems
- Intraoral Sensors
- Intraoral Photostimulable Phosphor Systems
- Intraoral Cameras
- Extraoral Imaging Systems
- Dental Imaging Software
Which region is dominating in the dental equipment market?
Geographically, the dental equipment market is segmented into five major regions: North America, Europe, Asia Pacific, Latin America, and the Middle East & Africa. In 2020, Europe accounted for the largest share of the dental equipment market, followed by North America and the Asia Pacific. The growth in developed markets across Europe and North America is mostly driven by the growing demand for cosmetic dentistry and the rising patient population for dental diseases. Emerging markets across the APAC and Latin America are expected to see the highest growth rates, mainly due to rising dental tourism, less-stringent regulations, and the increasing number of healthcare facilities.
Which is the leading end user in the dental equipment market?
Based on the end user, the dental equipment market is segmented into hospitals & clinics, academic & research institutes, and other end users. In 2020, dental hospitals & clinics accounted for the largest share of the dental equipment market. The large market share is attributed to the increasing number of dental clinics and hospitals across the globe, rapid adoption of advanced technologies, increasing dental tourism in emerging markets, and the rising number of group dental practices in developed countries. .
To speak to our analyst for a discussion on the above findings, click Speak to Analyst
TABLE OF CONTENTS
1 INTRODUCTION (Page No. - 38)
1.1 OBJECTIVES OF THE STUDY
1.2 MARKET DEFINITION
1.2.1 INCLUSIONS & EXCLUSIONS
1.3 MARKET SCOPE
1.3.1 MARKETS COVERED
1.3.2 YEARS CONSIDERED FOR THE STUDY
1.4 CURRENCY
TABLE 1 STANDARD CURRENCY CONVERSION RATES (UNIT OF USD)
1.5 LIMITATIONS
1.6 STAKEHOLDERS
1.7 SUMMARY OF CHANGES
2 RESEARCH METHODOLOGY (Page No. - 42)
2.1 RESEARCH DATA
FIGURE 1 RESEARCH DESIGN
2.1.1 SECONDARY DATA
2.1.1.1 Key data from secondary sources
2.1.2 PRIMARY DATA
FIGURE 2 PRIMARY SOURCES
2.1.2.1 Key data from primary sources
2.1.2.2 Key industry insights
FIGURE 3 BREAKDOWN OF PRIMARY INTERVIEWS: SUPPLY-SIDE AND DEMAND-SIDE PARTICIPANTS
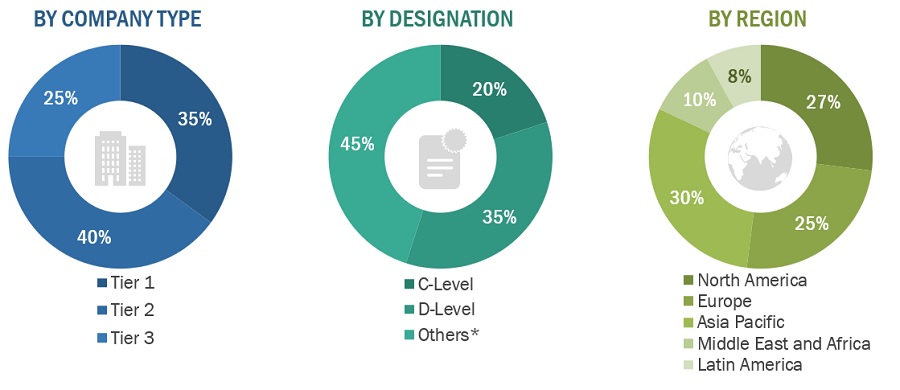
FIGURE 4 BREAKDOWN OF PRIMARY INTERVIEWS: BY COMPANY TYPE, DESIGNATION, AND REGION
FIGURE 5 BREAKDOWN OF PRIMARY INTERVIEWS (DEMAND SIDE): BY END USER, DESIGNATION, AND REGION
2.2 MARKET SIZE ESTIMATION
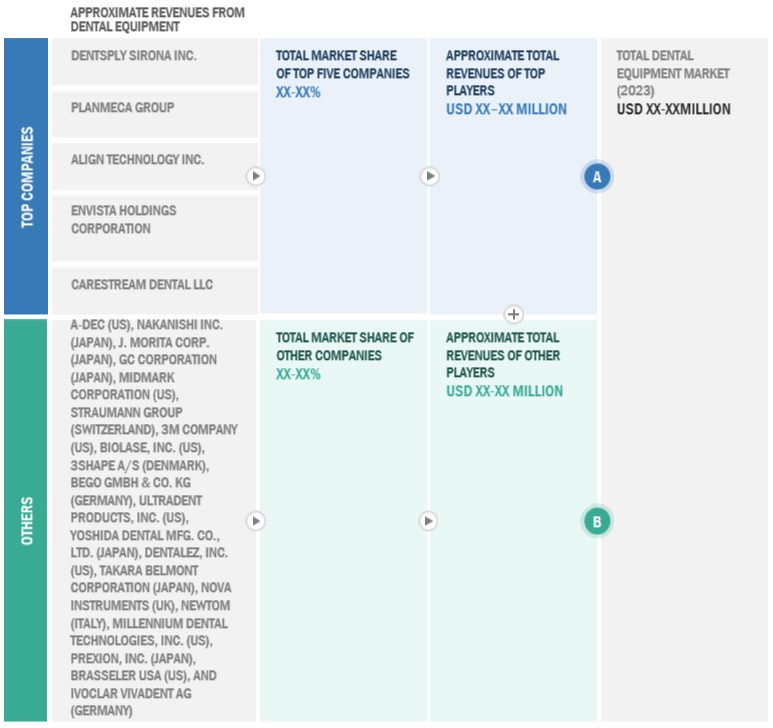
FIGURE 6 SUPPLY-SIDE MARKET SIZE ESTIMATION: REVENUE SHARE ANALYSIS
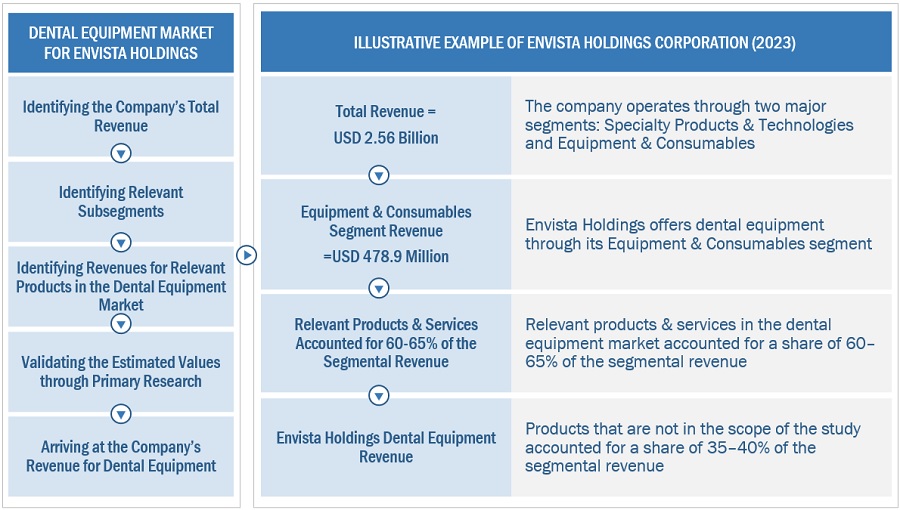
FIGURE 7 REVENUE SHARE ANALYSIS ILLUSTRATION: ENVISTA HOLDINGS
FIGURE 8 SUPPLY-SIDE ANALYSIS: DENTAL EQUIPMENT MARKET (2020)
FIGURE 9 CAGR PROJECTIONS FROM THE ANALYSIS OF DRIVERS, RESTRAINTS, OPPORTUNITIES, AND CHALLENGES IN THE DENTAL EQUIPMENT MARKET (2021–2026)
FIGURE 10 CAGR PROJECTIONS: SUPPLY-SIDE ANALYSIS
FIGURE 11 TOP-DOWN APPROACH
2.3 MARKET BREAKDOWN & DATA TRIANGULATION
FIGURE 12 MARKET DATA TRIANGULATION METHODOLOGY
2.4 MARKET SHARE ASSUMPTIONS
FIGURE 13 ASSUMPTIONS FOR THE STUDY
2.5 RISK ASSESSMENT
TABLE 2 RISK ASSESSMENT: DENTAL EQUIPMENT MARKET
2.6 COVID-19 HEALTH ASSESSMENT
2.7 COVID-19 ECONOMIC ASSESSMENT
2.8 ASSESSMENT OF THE IMPACT OF COVID-19 ON THE ECONOMIC SCENARIO
FIGURE 14 CRITERIA IMPACTING THE GLOBAL ECONOMY
FIGURE 15 RECOVERY SCENARIO OF THE GLOBAL ECONOMY
3 EXECUTIVE SUMMARY (Page No. - 58)
FIGURE 16 DENTAL EQUIPMENT MARKET, BY PRODUCT, 2021 VS. 2026 (USD MILLION)
FIGURE 17 THERAPEUTIC MARKET, BY TYPE, 2021 VS. 2026 (USD MILLION)
FIGURE 18 DIAGNOSTIC MARKET, BY TYPE, 2021 VS. 2026 (USD MILLION)
FIGURE 19 MARKET, BY END USER, 2021 VS. 2026 (USD MILLION)
FIGURE 20 GEOGRAPHIC SNAPSHOT: MARKET
4 PREMIUM INSIGHTS (Page No. - 62)
4.1 DENTAL EQUIPMENT MARKET OVERVIEW
FIGURE 21 THE INCREASING PREVALENCE OF ORAL HEALTH DISORDERS IS A MAJOR FACTOR DRIVING THE MARKET GROWTH
4.2 ASIA PACIFIC: MARKET, BY END USER AND COUNTRY (2020)
FIGURE 22 CHINA ACCOUNTED FOR THE LARGEST SHARE OF THE ASIA PACIFIC MARKET IN 2020
4.3 DENTAL EQUIPMENT MARKET: GEOGRAPHIC GROWTH OPPORTUNITIES
FIGURE 23 INDIA TO REGISTER THE HIGHEST GROWTH RATE DURING THE FORECAST PERIOD
4.4 REGIONAL MIX: MARKET (2021−2026)
FIGURE 24 EUROPE WILL CONTINUE TO DOMINATE THE MARKET DURING THE FORECAST PERIOD
4.5 MARKET: DEVELOPED VS. DEVELOPING MARKETS
FIGURE 25 DEVELOPING MARKETS TO REGISTER HIGHER GROWTH RATES DURING THE FORECAST PERIOD
5 MARKET OVERVIEW (Page No. - 66)
5.1 INTRODUCTION
5.2 MARKET DYNAMICS
FIGURE 26 MARKET: DRIVERS, RESTRAINTS, OPPORTUNITIES, AND CHALLENGES
5.2.1 DRIVERS
5.2.1.1 Development of technologically advanced solutions
5.2.1.2 Increasing prevalence of oral health disorders
5.2.1.2.1 Dental caries (cavities) and other periodontal disorders
5.2.1.2.2 Edentulism
FIGURE 27 US: NUMBER OF PEOPLE SUFFERING FROM ABSENCE OF ALL-NATURAL TEETH, 2018
TABLE 3 INCREASE IN GERIATRIC POPULATION, 2019 VS 2050
5.2.1.3 Changing lifestyles and unhealthy food habits
5.2.1.4 Growing consumer awareness and rising focus on aesthetics
5.2.1.5 Rising dental tourism in emerging markets
TABLE 4 ORTHODONTIC TREATMENT FEES ON AVERAGE
5.2.2 RESTRAINTS
5.2.2.1 High cost of dental imaging systems and lack of reimbursement for dental procedures
TABLE 5 INSTRUMENT COSTS, BY TYPE
5.2.3 OPPORTUNITIES
5.2.3.1 Increasing number of dental laboratories investing in CAD/CAM technologies
5.2.4 CHALLENGES
5.2.4.1 Dearth of trained dental practitioners
6 INDUSTRY INSIGHTS (Page No. - 74)
6.1 INDUSTRY TRENDS
6.1.1 RISING NUMBER OF MINIMALLY INVASIVE DENTAL PROCEDURES
6.1.2 MARKET CONSOLIDATION
TABLE 6 MAJOR ACQUISITIONS IN THE DENTAL EQUIPMENT MARKET (2018–2020)
6.1.3 FOCUS ON PRODUCT DEVELOPMENT
6.1.4 INCREASING PREFERENCE FOR DENTAL GROUP PRACTICES
6.1.5 TRENDS OF DENTAL INSURANCE IN THE US
FIGURE 28 TOTAL DENTAL ENROLLMENT (2009–2018)
6.1.6 AUTOMATED PATIENT TRACKING & MANAGEMENT SOFTWARE
6.1.7 ROBOTIC DENTISTS AND AI
6.2 TECHNOLOGY ANALYSIS
6.3 VALUE CHAIN ANALYSIS
FIGURE 29 MARKET: VALUE CHAIN ANALYSIS
6.4 AVERAGE SYSTEM COST
TABLE 7 AVERAGE SYSTEM COST
6.5 ECOSYSTEM MAP
FIGURE 30 MARKET: ECOSYSTEM MAPPING (2020)
FIGURE 31 DENTAL CONSUMABLES MARKET: SUPPLY CHAIN (2020)
6.6 REGULATORY LANDSCAPE
6.6.1 US
6.6.2 EUROPEAN UNION
6.6.3 CHINA
6.7 PATENT ANALYSIS
6.7.1 PATENT PUBLICATION TRENDS
FIGURE 32 PATENT PUBLICATION TRENDS: 2010 TO 2020
6.7.2 JURISDICTION ANALYSIS: TOP APPLICANTS (COUNTRIES) FOR DENTAL EQUIPMENT PATENTS
TABLE 8 JURISDICTION ANALYSIS: TOP APPLICANT COUNTRIES FOR DENTAL EQUIPMENT PATENTS
FIGURE 33 JURISDICTION ANALYSIS FOR THE US
6.8 TRADE ANALYSIS
TABLE 9 US DENTAL EQUIPMENT AND SUPPLIES: EXPORTS, 2013–2018 (IN 000’)
6.9 YC-YCC SHIFT: DENTAL EQUIPMENT MARKET
FIGURE 34 YC-YCC SHIFT IN THE MARKET
6.10 ADJACENT MARKETS FOR DENTAL EQUIPMENT
FIGURE 35 ADJACENT MARKETS FOR DENTAL EQUIPMENT
6.11 CASE STUDIES
TABLE 10 INNOVATION TRACKING, TECHNOLOGY ASSESSMENT, AND PRODUCT LAUNCHES
TABLE 11 MIDDLE EAST & AFRICA MARKET
TABLE 12 DENTAL IMPLANTS MARKET
6.12 PORTER’S FIVE FORCES ANALYSIS
TABLE 13 MARKET: PORTER’S FIVE FORCES ANALYSIS
6.12.1 THREAT FROM NEW ENTRANTS
6.12.2 THREAT FROM SUBSTITUTES
6.12.3 BARGAINING POWER OF SUPPLIERS
6.12.4 BARGAINING POWER OF BUYERS
6.12.5 INTENSITY OF COMPETITIVE RIVALRY
7 DENTAL EQUIPMENT MARKET, BY PRODUCT (Page No. - 90)
7.1 INTRODUCTION
7.2 IMPACT OF COVID-19 ON THE MARKET, BY PRODUCT
TABLE 14 MARKET, BY PRODUCT, 2019–2026 (USD MILLION)
TABLE 15 MARKET, BY COUNTRY, 2019–2026 (USD MILLION)
7.3 THERAPEUTIC DENTAL EQUIPMENT
TABLE 16 THERAPEUTIC MARKET, BY TYPE, 2019–2026 (USD MILLION)
TABLE 17 THERAPEUTIC MARKET, BY COUNTRY, 2019–2026 (USD MILLION)
7.3.1 DENTAL OPERATORY & TREATMENT CENTER EQUIPMENT
TABLE 18 DENTAL OPERATORY & TREATMENT CENTER EQUIPMENT MARKET, BY TYPE, 2019–2026 (USD MILLION)
TABLE 19 DENTAL OPERATORY & TREATMENT CENTER EQUIPMENT MARKET, BY COUNTRY, 2019–2026 (USD MILLION)
7.3.1.1 Dental units
TABLE 20 DENTAL UNITS MARKET, BY TYPE, 2019–2026 (USD MILLION)
TABLE 21 DENTAL UNITS MARKET, BY COUNTRY, 2019–2026 (USD MILLION)
7.3.1.1.1 Instrument delivery systems
7.3.1.1.1.1 Ease of handling instruments and switches supports the demand for instrument delivery systems
TABLE 22 INSTRUMENT DELIVERY SYSTEMS MARKET, BY COUNTRY, 2019–2026 (USD MILLION)
7.3.1.1.2 Dental chairs
7.3.1.1.2.1 The growing number of dental practices to drive the growth of the segment
TABLE 23 DENTAL CHAIRS MARKET, BY COUNTRY, 2019–2026 (USD MILLION)
7.3.1.2 Dental handpieces
7.3.1.2.1 Demand for high-tech handpieces is expected to increase during the forecast period
TABLE 24 DENTAL HANDPIECES MARKET, BY COUNTRY, 2019–2026 (USD MILLION)
7.3.1.3 Dental light-curing equipment
7.3.1.3.1 The growing demand for in-office teeth whitening procedures to drive the growth of the light-curing equipment market
TABLE 25 DENTAL LIGHT-CURING EQUIPMENT MARKET, BY COUNTRY, 2019–2026 (USD MILLION)
7.3.1.4 Other Dental Operatory & Treatment Center Equipment
TABLE 26 OTHER DENTAL OPERATORY & TREATMENT CENTER EQUIPMENT MARKET, BY COUNTRY, 2019–2026 (USD MILLION)
7.3.2 GENERAL EQUIPMENT
TABLE 27 GENERAL EQUIPMENT MARKET, BY TYPE, 2019–2026 (USD MILLION)
TABLE 28 GENERAL EQUIPMENT MARKET, BY COUNTRY, 2019–2026 (USD MILLION)
7.3.2.1 CAD/CAM systems
7.3.2.1.1 Increasing adoption of single-tooth implants, veneers, and crowns to drive the growth of CAD/CAM systems among end users
TABLE 29 CAD/CAM SYSTEMS MARKET, BY COUNTRY, 2019–2026 (USD MILLION)
7.3.2.2 Electrosurgical systems
7.3.2.2.1 Technology advancements in lasers are expected to hinder the growth of electrosurgical systems in dentistry
TABLE 30 ELECTROSURGICAL SYSTEMS MARKET, BY COUNTRY, 2019–2026 (USD MILLION)
7.3.2.3 Casting machines
7.3.2.3.1 Cast machines are used in creating custom dental restorations
TABLE 31 CASTING MACHINES MARKET, BY COUNTRY, 2019–2026 (USD MILLION)
7.3.2.4 Ceramic furnaces
7.3.2.4.1 Ceramic furnaces use high pressures and temperatures to process ceramic materials
TABLE 32 CERAMIC FURNACES MARKET, BY COUNTRY, 2019–2026 (USD MILLION)
7.3.3 DENTAL LASERS
TABLE 33 DENTAL LASERS MARKET, BY TYPE, 2019–2026 (USD MILLION)
TABLE 34 DENTAL LASERS MARKET, BY COUNTRY, 2019–2026 (USD MILLION)
7.3.3.1 Soft-tissue lasers
TABLE 35 SOFT-TISSUE LASERS MARKET, BY TYPE, 2019–2026 (USD MILLION)
TABLE 36 SOFT-TISSUE LASERS MARKET, BY COUNTRY, 2019–2026 (USD MILLION)
7.3.3.1.1 Diode lasers
7.3.3.1.1.1 Low power consumption, compact size, and low cost will raise demand for diode lasers
TABLE 37 DIODE LASERS MARKET, BY COUNTRY, 2019–2026 (USD MILLION)
7.3.3.1.2 Carbon dioxide lasers
7.3.3.1.2.1 Low prices of CO2 systems have driven their adoption among dentists
TABLE 38 CARBON DIOXIDE LASERS MARKET, BY COUNTRY, 2019–2026 (USD MILLION)
7.3.3.1.3 Nd:YAG lasers
7.3.3.1.3.1 High cost hinders the market growth
TABLE 39 ND:YAG LASERS MARKET, BY COUNTRY, 2019–2026 (USD MILLION)
7.3.3.2 All-tissue lasers
TABLE 40 ALL-TISSUE LASERS MARKET, BY TYPE, 2019–2026 (USD MILLION)
TABLE 41 ALL-TISSUE LASERS MARKET, BY COUNTRY, 2019–2026 (USD MILLION)
7.3.3.2.1 Er:YAG lasers
7.3.3.2.1.1 Er:YAG lasers do not heat the tissue surface and thus result in less pain to patients as compared to other lasers
TABLE 42 ER:YAG LASERS MARKET, BY COUNTRY, 2019–2026 (USD MILLION)
7.3.3.2.2 Er,Cr:YSGG lasers
7.3.3.2.2.1 Low need for anesthesia drives demand growth for Er,Cr:YSGG lasers
TABLE 43 ER,CR:YSGG LASERS MARKET, BY COUNTRY, 2019–2026 (USD MILLION)
7.4 DIAGNOSTIC DENTAL EQUIPMENT
TABLE 44 DIAGNOSTIC DENTAL EQUIPMENT MARKET, BY TYPE, 2019–2026 (USD MILLION)
TABLE 45 DIAGNOSTIC MARKET, BY COUNTRY, 2019–2026 (USD MILLION)
7.4.1 EXTRAORAL IMAGING SYSTEMS
TABLE 46 EXTRAORAL IMAGING SYSTEMS MARKET, BY TYPE, 2019–2026 (USD MILLION)
TABLE 47 EXTRAORAL IMAGING SYSTEMS MARKET, BY COUNTRY, 2019–2026 (USD MILLION)
7.4.1.1 Panoramic systems
7.4.1.1.1 Increasing prevalence of dental disorders to support the growth of this market segment
TABLE 48 LIST OF KEY PANORAMIC SYSTEMS AVAILABLE IN THE MARKET
TABLE 49 PANORAMIC SYSTEMS MARKET, BY COUNTRY, 2019–2026 (USD MILLION)
7.4.1.2 3D CBCT systems
7.4.1.2.1 Growth in the dental implants market to drive the demand for 3D CBCT systems
TABLE 50 LIST OF KEY 3D CBCT SYSTEMS AVAILABLE IN THE MARKET
TABLE 51 3D CBCT SYSTEMS MARKET, BY COUNTRY, 2019–2026 (USD MILLION)
7.4.1.3 Panoramic & cephalometric systems
7.4.1.3.1 Panoramic & cephalometric systems offer a single digital platform for dental treatments
TABLE 52 LIST OF KEY PANORAMIC & CEPHALOMETRIC SYSTEMS AVAILABLE IN THE MARKET
TABLE 53 PANORAMIC & CEPHALOMETRIC SYSTEMS MARKET, BY COUNTRY, 2019–2026 (USD MILLION)
7.4.2 INTRAORAL IMAGING SYSTEMS
TABLE 54 INTRAORAL IMAGING SYSTEMS MARKET, BY TYPE, 2019–2026 (USD MILLION)
TABLE 55 INTRAORAL IMAGING SYSTEMS MARKET, BY COUNTRY, 2019–2026 (USD MILLION)
7.4.2.1 Intraoral X-ray systems
7.4.2.1.1 Efficient and faster intraoral diagnostics are the major advantages of intraoral X-ray systems
TABLE 56 LIST OF KEY INTRAORAL X-RAY UNITS AVAILABLE IN THE MARKET
TABLE 57 INTRAORAL X-RAY SYSTEMS MARKET, BY COUNTRY, 2019–2026 (USD MILLION)
7.4.2.2 Intraoral sensors
7.4.2.2.1 Intraoral sensors reduce operating times significantly
TABLE 58 LIST OF KEY INTRAORAL SENSORS AVAILABLE IN THE MARKET
TABLE 59 INTRAORAL SENSORS MARKET, BY COUNTRY, 2019–2026 (USD MILLION)
7.4.2.3 Intraoral photostimulable phosphor systems
7.4.2.3.1 Phosphor imaging plates are an economical option for intraoral imaging
TABLE 60 LIST OF KEY PSP SYSTEMS AVAILABLE IN THE MARKET
TABLE 61 INTRAORAL PHOTOSTIMULABLE PHOSPHOR SYSTEMS MARKET, BY COUNTRY, 2019–2026 (USD MILLION)
7.4.2.4 Intraoral cameras
7.4.2.4.1 Intraoral cameras help in the early detection and accurate representation of dental conditions
TABLE 62 LIST OF KEY INTRAORAL CAMERAS AVAILABLE IN THE MARKET
TABLE 63 INTRAORAL CAMERAS MARKET, BY COUNTRY, 2019–2026 (USD MILLION)
7.4.3 DENTAL IMAGING SOFTWARE
7.4.3.1 Sophisticated workflow offered by dental imaging software will drive its adoption over the coming years
TABLE 64 DENTAL IMAGING SOFTWARE MARKET, BY COUNTRY, 2019–2026 (USD MILLION)
8 DENTAL EQUIPMENT MARKET, BY END USER (Page No. - 128)
8.1 INTRODUCTION
TABLE 65 MARKET, BY END USER, 2019–2026 (USD MILLION)
8.2 IMPACT OF COVID-19 ON END USERS OF DENTAL EQUIPMENT
8.3 HOSPITALS & CLINICS
8.3.1 THE INCREASING NUMBER OF DENTAL HOSPITALS & CLINICS IN EMERGING MARKETS WILL DRIVE SEGMENT GROWTH
TABLE 66 TOP DESTINATIONS FOR COST-EFFECTIVE DENTAL TREATMENT
TABLE 67 MARKET FOR HOSPITALS & CLINICS, BY COUNTRY, 2019–2026 (USD MILLION)
8.4 ACADEMIC & RESEARCH INSTITUTES
8.4.1 AN INCREASING NUMBER OF INDUSTRY-ACADEMIC AGREEMENTS AND RISING FUNDING FOR DENTAL RESEARCH PROJECTS WILL PROPEL THE GROWTH OF THIS SEGMENT
TABLE 68 TOP 10 NIDCR GRANTS TO US DENTAL INSTITUTIONS
TABLE 69 MARKET FOR ACADEMIC & RESEARCH INSTITUTES, BY COUNTRY, 2019–2026 (USD MILLION)
8.5 OTHER END USERS
TABLE 70 MARKET FOR OTHER END USERS, BY COUNTRY, 2019–2026 (USD MILLION)
9 DENTAL EQUIPMENT MARKET, BY REGION (Page No. - 135)
9.1 INTRODUCTION
TABLE 71 MARKET, BY REGION, 2019–2026 (USD MILLION)
9.2 EUROPE
TABLE 72 EUROPE: SPENDING ON ORAL HEALTHCARE SERVICES, BY COUNTRY, 2010–2020 (USD BILLION)
FIGURE 36 EUROPE: MARKET SNAPSHOT
TABLE 73 EUROPE: MARKET, BY COUNTRY, 2019–2026 (USD MILLION)
TABLE 74 EUROPE: MARKET, BY PRODUCT, 2019–2026 (USD MILLION)
TABLE 75 EUROPE: THERAPEUTIC DENTAL EQUIPMENT MARKET, BY TYPE, 2019–2026 (USD MILLION)
TABLE 76 EUROPE: DENTAL OPERATORY & TREATMENT CENTER EQUIPMENT MARKET, BY TYPE, 2019–2026 (USD MILLION)
TABLE 77 EUROPE: DENTAL UNITS MARKET, BY TYPE, 2019–2026 (USD MILLION)
TABLE 78 EUROPE: GENERAL EQUIPMENT MARKET, BY TYPE, 2019–2026 (USD MILLION)
TABLE 79 EUROPE: DENTAL LASERS MARKET, BY TYPE, 2019–2026 (USD MILLION)
TABLE 80 EUROPE: SOFT-TISSUE LASERS MARKET, BY TYPE, 2019–2026 (USD MILLION)
TABLE 81 EUROPE: ALL-TISSUE LASERS MARKET, BY TYPE, 2019–2026 (USD MILLION)
TABLE 82 EUROPE: DIAGNOSTIC DENTAL EQUIPMENT MARKET, BY TYPE, 2019–2026 (USD MILLION)
TABLE 83 EUROPE: EXTRAORAL IMAGING SYSTEMS MARKET, BY TYPE, 2019–2026 (USD MILLION)
TABLE 84 EUROPE: INTRAORAL IMAGING SYSTEMS MARKET, BY TYPE, 2019–2026 (USD MILLION)
TABLE 85 EUROPE: MARKET, BY END USER, 2019–2026 (USD MILLION)
9.2.1 GERMANY
9.2.1.1 Favorable government policies are driving the demand for dental equipment in the country
TABLE 86 GERMANY: DENTAL INDUSTRY OVERVIEW, 2011–2018
TABLE 87 GERMANY: MACROECONOMIC INDICATORS
TABLE 88 GERMANY: MARKET, BY PRODUCT, 2019–2026 (USD MILLION)
TABLE 89 GERMANY: THERAPEUTIC DENTAL EQUIPMENT MARKET, BY TYPE, 2019–2026 (USD MILLION)
TABLE 90 GERMANY: DENTAL OPERATORY & TREATMENT CENTER EQUIPMENT MARKET, BY TYPE, 2019–2026 (USD MILLION)
TABLE 91 GERMANY: DENTAL UNITS MARKET, BY TYPE, 2019–2026 (USD MILLION)
TABLE 92 GERMANY: GENERAL EQUIPMENT MARKET, BY TYPE, 2019–2026 (USD MILLION)
TABLE 93 GERMANY: DENTAL LASERS MARKET, BY TYPE, 2019–2026 (USD MILLION)
TABLE 94 GERMANY: SOFT-TISSUE LASERS MARKET, BY TYPE, 2019–2026 (USD MILLION)
TABLE 95 GERMANY: ALL-TISSUE LASERS MARKET, BY TYPE, 2019–2026 (USD MILLION)
TABLE 96 GERMANY: DIAGNOSTIC DENTAL EQUIPMENT MARKET, BY TYPE, 2019–2026 (USD MILLION)
TABLE 97 GERMANY: EXTRAORAL IMAGING SYSTEMS MARKET, BY TYPE, 2019–2026 (USD MILLION)
TABLE 98 GERMANY: INTRAORAL IMAGING SYSTEMS MARKET, BY TYPE, 2019–2026 (USD MILLION)
TABLE 99 GERMANY: MARKET, BY END USER, 2019–2026 (USD MILLION)
9.2.2 FRANCE
9.2.2.1 Favorable government healthcare strategies are fueling market growth in France
TABLE 100 FRANCE: MACROECONOMIC INDICATORS
TABLE 101 FRANCE: MARKET, BY PRODUCT, 2019–2026 (USD MILLION)
TABLE 102 FRANCE: THERAPEUTIC DENTAL EQUIPMENT MARKET, BY TYPE, 2019–2026 (USD MILLION)
TABLE 103 FRANCE: DENTAL OPERATORY & TREATMENT CENTER EQUIPMENT MARKET, BY TYPE, 2019–2026 (USD MILLION)
TABLE 104 FRANCE: DENTAL UNITS MARKET, BY TYPE, 2019–2026 (USD MILLION)
TABLE 105 FRANCE: GENERAL EQUIPMENT MARKET, BY TYPE, 2019–2026 (USD MILLION)
TABLE 106 FRANCE: DENTAL LASERS MARKET, BY TYPE, 2019–2026 (USD MILLION)
TABLE 107 FRANCE: SOFT-TISSUE LASERS MARKET, BY TYPE, 2019–2026 (USD MILLION)
TABLE 108 FRANCE: ALL-TISSUE LASERS MARKET, BY TYPE, 2019–2026 (USD MILLION)
TABLE 109 FRANCE: DIAGNOSTIC DENTAL EQUIPMENT MARKET, BY TYPE, 2019–2026 (USD MILLION)
TABLE 110 FRANCE: EXTRAORAL IMAGING SYSTEMS MARKET, BY TYPE, 2019–2026 (USD MILLION)
TABLE 111 FRANCE: INTRAORAL IMAGING SYSTEMS MARKET, BY TYPE, 2019–2026 (USD MILLION)
TABLE 112 FRANCE: MARKET, BY END USER, 2019–2026 (USD MILLION)
9.2.3 UK
9.2.3.1 Increasing incidence of dental disorders is a major factor driving the demand for dental equipment in the UK
TABLE 113 UK: MACROECONOMIC INDICATORS
TABLE 114 UK: MARKET, BY PRODUCT, 2019–2026 (USD MILLION)
TABLE 115 UK: THERAPEUTIC DENTAL EQUIPMENT MARKET, BY TYPE, 2019–2026 (USD MILLION)
TABLE 116 UK: DENTAL OPERATORY & TREATMENT CENTER EQUIPMENT MARKET, BY TYPE, 2019–2026 (USD MILLION)
TABLE 117 UK: DENTAL UNITS MARKET, BY TYPE, 2019–2026 (USD MILLION)
TABLE 118 UK: GENERAL EQUIPMENT MARKET, BY TYPE, 2019–2026 (USD MILLION)
TABLE 119 UK: DENTAL LASERS MARKET, BY TYPE, 2019–2026 (USD MILLION)
TABLE 120 UK: SOFT-TISSUE LASERS MARKET, BY TYPE, 2019–2026 (USD MILLION)
TABLE 121 UK: ALL-TISSUE LASERS MARKET, BY TYPE, 2019–2026 (USD MILLION)
TABLE 122 UK: DIAGNOSTIC DENTAL EQUIPMENT MARKET, BY TYPE, 2019–2026 (USD MILLION)
TABLE 123 UK: EXTRAORAL IMAGING SYSTEMS MARKET, BY TYPE, 2019–2026 (USD MILLION)
TABLE 124 UK: INTRAORAL IMAGING SYSTEMS MARKET, BY TYPE, 2019–2026 (USD MILLION)
TABLE 125 UK: DENTAL EQUIPMENT MARKET, BY END USER, 2019–2026 (USD MILLION)
9.2.4 ITALY
9.2.4.1 Low-cost treatments and growing penetration of dental products to drive the market for dental equipment in Italy
TABLE 126 ITALY: MACROECONOMIC INDICATORS
TABLE 127 ITALY: DENTAL EQUIPMENT MARKET, BY PRODUCT, 2019–2026 (USD MILLION)
TABLE 128 ITALY: THERAPEUTIC DENTAL EQUIPMENT MARKET, BY TYPE, 2019–2026 (USD MILLION)
TABLE 129 ITALY: DENTAL OPERATORY & TREATMENT CENTER EQUIPMENT MARKET, BY TYPE, 2019–2026 (USD MILLION)
TABLE 130 ITALY: DENTAL UNITS MARKET, BY TYPE, 2019–2026 (USD MILLION)
TABLE 131 ITALY: GENERAL EQUIPMENT MARKET, BY TYPE, 2019–2026 (USD MILLION)
TABLE 132 ITALY: DENTAL LASERS MARKET, BY TYPE, 2019–2026 (USD MILLION)
TABLE 133 ITALY: SOFT-TISSUE LASERS MARKET, BY TYPE, 2019–2026 (USD MILLION)
TABLE 134 ITALY: ALL-TISSUE LASERS MARKET, BY TYPE, 2019–2026 (USD MILLION)
TABLE 135 ITALY: DIAGNOSTIC DENTAL EQUIPMENT MARKET, BY TYPE, 2019–2026 (USD MILLION)
TABLE 136 ITALY: EXTRAORAL IMAGING SYSTEMS MARKET, BY TYPE, 2019–2026 (USD MILLION)
TABLE 137 ITALY: INTRAORAL IMAGING SYSTEMS MARKET, BY TYPE, 2019–2026 (USD MILLION)
TABLE 138 ITALY: DENTAL EQUIPMENT MARKET, BY END USER, 2019–2026 (USD MILLION)
9.2.5 SPAIN
9.2.5.1 Increasing demand for cosmetic dentistry and growing medical tourism are driving the demand for dental equipment in Spain
TABLE 139 SPAIN: MACROECONOMIC INDICATORS
TABLE 140 SPAIN: DENTAL EQUIPMENT MARKET, BY PRODUCT, 2019–2026 (USD MILLION)
TABLE 141 SPAIN: THERAPEUTIC DENTAL EQUIPMENT MARKET, BY TYPE, 2019–2026 (USD MILLION)
TABLE 142 SPAIN: DENTAL OPERATORY & TREATMENT CENTER EQUIPMENT MARKET, BY TYPE, 2019–2026 (USD MILLION)
TABLE 143 SPAIN: DENTAL UNITS MARKET, BY TYPE, 2019–2026 (USD MILLION)
TABLE 144 SPAIN: GENERAL EQUIPMENT MARKET, BY TYPE, 2019–2026 (USD MILLION)
TABLE 145 SPAIN: DENTAL LASERS MARKET, BY TYPE, 2019–2026 (USD MILLION)
TABLE 146 SPAIN: SOFT-TISSUE LASERS MARKET, BY TYPE, 2019–2026 (USD MILLION)
TABLE 147 SPAIN: ALL-TISSUE LASERS MARKET, BY TYPE, 2019–2026 (USD MILLION)
TABLE 148 SPAIN: DIAGNOSTIC DENTAL EQUIPMENT MARKET, BY TYPE, 2019–2026 (USD MILLION)
TABLE 149 SPAIN: EXTRAORAL IMAGING SYSTEMS MARKET, BY TYPE, 2019–2026 (USD MILLION)
TABLE 150 SPAIN: INTRAORAL IMAGING SYSTEMS MARKET, BY TYPE, 2019–2026 (USD MILLION)
TABLE 151 SPAIN: DENTAL EQUIPMENT MARKET, BY END USER, 2019–2026 (USD MILLION)
9.2.6 REST OF EUROPE
TABLE 152 ROE: DENTAL EQUIPMENT MARKET, BY PRODUCT, 2019–2026 (USD MILLION)
TABLE 153 ROE: THERAPEUTIC DENTAL EQUIPMENT MARKET, BY TYPE, 2019–2026 (USD MILLION)
TABLE 154 ROE: DENTAL OPERATORY & TREATMENT CENTER EQUIPMENT MARKET, BY TYPE, 2019–2026 (USD MILLION)
TABLE 155 ROE: DENTAL UNITS MARKET, BY TYPE, 2019–2026 (USD MILLION)
TABLE 156 ROE: GENERAL EQUIPMENT MARKET, BY TYPE, 2019–2026 (USD MILLION)
TABLE 157 ROE: DENTAL LASERS MARKET, BY TYPE, 2019–2026 (USD MILLION)
TABLE 158 ROE: SOFT-TISSUE LASERS MARKET, BY TYPE, 2019–2026 (USD MILLION)
TABLE 159 ROE: ALL-TISSUE LASERS MARKET, BY TYPE, 2019–2026 (USD MILLION)
TABLE 160 ROE: DIAGNOSTIC DENTAL EQUIPMENT MARKET, BY TYPE, 2019–2026 (USD MILLION)
TABLE 161 ROE: EXTRAORAL IMAGING SYSTEMS MARKET, BY TYPE, 2019–2026 (USD MILLION)
TABLE 162 ROE: INTRAORAL IMAGING SYSTEMS MARKET, BY TYPE, 2019–2026 (USD MILLION)
TABLE 163 ROE: MARKET, BY END USER, 2019–2026 (USD MILLION)
9.3 NORTH AMERICA
TABLE 164 NORTH AMERICA: MARKET, BY COUNTRY, 2019–2026 (USD MILLION)
TABLE 165 NORTH AMERICA: MARKET, BY PRODUCT, 2019–2026 (USD MILLION)
TABLE 166 NORTH AMERICA: THERAPEUTIC DENTAL EQUIPMENT MARKET, BY TYPE, 2019–2026 (USD MILLION)
TABLE 167 NORTH AMERICA: DENTAL OPERATORY & TREATMENT CENTER EQUIPMENT MARKET, BY TYPE, 2019–2026 (USD MILLION)
TABLE 168 NORTH AMERICA: DENTAL UNITS MARKET, BY TYPE, 2019–2026 (USD MILLION)
TABLE 169 NORTH AMERICA: GENERAL EQUIPMENT MARKET, BY TYPE, 2019–2026 (USD MILLION)
TABLE 170 NORTH AMERICA: DENTAL LASERS MARKET, BY TYPE, 2019–2026 (USD MILLION)
TABLE 171 NORTH AMERICA: SOFT-TISSUE LASERS MARKET, BY TYPE, 2019–2026 (USD MILLION)
TABLE 172 NORTH AMERICA: ALL-TISSUE LASERS MARKET, BY TYPE, 2019–2026 (USD MILLION)
TABLE 173 NORTH AMERICA: DIAGNOSTIC DENTAL EQUIPMENT MARKET, BY TYPE, 2019–2026 (USD MILLION)
TABLE 174 NORTH AMERICA: EXTRAORAL IMAGING SYSTEMS MARKET, BY TYPE, 2019–2026 (USD MILLION)
TABLE 175 NORTH AMERICA: INTRAORAL IMAGING SYSTEMS MARKET, BY TYPE, 2019–2026 (USD MILLION)
TABLE 176 NORTH AMERICA: MARKET, BY END USER, 2019–2026 (USD MILLION)
9.3.1 US
9.3.1.1 The US forms one of the largest markets for dental equipment globally
FIGURE 37 US: RISE IN DENTAL EXPENDITURE, 2010–2019
TABLE 177 US: MACROECONOMIC INDICATORS
TABLE 178 US: MARKET, BY PRODUCT, 2019–2026 (USD MILLION)
TABLE 179 US: THERAPEUTIC DENTAL EQUIPMENT MARKET, BY TYPE, 2019–2026 (USD MILLION)
TABLE 180 US: DENTAL OPERATORY & TREATMENT CENTER EQUIPMENT MARKET, BY TYPE, 2019–2026 (USD MILLION)
TABLE 181 US: DENTAL UNITS MARKET, BY TYPE, 2019–2026 (USD MILLION)
TABLE 182 US: GENERAL EQUIPMENT MARKET, BY TYPE, 2019–2026 (USD MILLION)
TABLE 183 US: DENTAL LASERS MARKET, BY TYPE, 2019–2026 (USD MILLION)
TABLE 184 US: SOFT-TISSUE LASERS MARKET, BY TYPE, 2019–2026 (USD MILLION)
TABLE 185 US: ALL-TISSUE LASERS MARKET, BY TYPE, 2019–2026 (USD MILLION)
TABLE 186 US: DIAGNOSTIC DENTAL EQUIPMENT MARKET, BY TYPE, 2019–2026 (USD MILLION)
TABLE 187 US: EXTRAORAL IMAGING SYSTEMS MARKET, BY TYPE, 2019–2026 (USD MILLION)
TABLE 188 US: INTRAORAL IMAGING SYSTEMS MARKET, BY TYPE, 2019–2026 (USD MILLION)
TABLE 189 US: MARKET, BY END USER, 2019–2026 (USD MILLION)
9.3.2 CANADA
9.3.2.1 The rising incidence of dental caries is expected to further fuel the growth of the dental equipment market in the country
TABLE 190 CANADA: MACROECONOMIC INDICATORS
TABLE 191 CANADA: MARKET, BY PRODUCT, 2019–2026 (USD MILLION)
TABLE 192 CANADA: THERAPEUTIC DENTAL EQUIPMENT MARKET, BY TYPE, 2019–2026 (USD MILLION)
TABLE 193 CANADA: DENTAL OPERATORY & TREATMENT CENTER EQUIPMENT MARKET, BY TYPE, 2019–2026 (USD MILLION)
TABLE 194 CANADA: DENTAL UNITS MARKET, BY TYPE, 2019–2026 (USD MILLION)
TABLE 195 CANADA: GENERAL EQUIPMENT MARKET, BY TYPE, 2019–2026 (USD MILLION)
TABLE 196 CANADA: DENTAL LASERS MARKET, BY TYPE, 2019–2026 (USD MILLION)
TABLE 197 CANADA: SOFT-TISSUE LASERS MARKET, BY TYPE, 2019–2026 (USD MILLION)
TABLE 198 CANADA: ALL-TISSUE LASERS MARKET, BY TYPE, 2019–2026 (USD MILLION)
TABLE 199 CANADA: DIAGNOSTIC DENTAL EQUIPMENT MARKET, BY TYPE, 2019–2026 (USD MILLION)
TABLE 200 CANADA: EXTRAORAL IMAGING SYSTEMS MARKET, BY TYPE, 2019–2026 (USD MILLION)
TABLE 201 CANADA: INTRAORAL IMAGING SYSTEMS MARKET, BY TYPE, 2019–2026 (USD MILLION)
TABLE 202 CANADA: MARKET, BY END USER, 2019–2026 (USD MILLION)
9.4 ASIA PACIFIC
FIGURE 38 ASIA PACIFIC: MARKET SNAPSHOT
TABLE 203 ASIA PACIFIC: MARKET, BY COUNTRY, 2019–2026 (USD MILLION)
TABLE 204 ASIA PACIFIC: MARKET, BY PRODUCT, 2019–2026 (USD MILLION)
TABLE 205 ASIA PACIFIC: THERAPEUTIC DENTAL EQUIPMENT MARKET, BY TYPE, 2019–2026 (USD MILLION)
TABLE 206 ASIA PACIFIC: DENTAL OPERATORY & TREATMENT CENTER EQUIPMENT MARKET, BY TYPE, 2019–2026 (USD MILLION)
TABLE 207 ASIA PACIFIC: DENTAL UNITS MARKET, BY TYPE, 2019–2026 (USD MILLION)
TABLE 208 ASIA PACIFIC: GENERAL EQUIPMENT MARKET, BY TYPE, 2019–2026 (USD MILLION)
TABLE 209 ASIA PACIFIC: DENTAL LASERS MARKET, BY TYPE, 2019–2026 (USD MILLION)
TABLE 210 ASIA PACIFIC: SOFT-TISSUE LASERS MARKET, BY TYPE, 2019–2026 (USD MILLION)
TABLE 211 ASIA PACIFIC: ALL-TISSUE LASERS MARKET, BY TYPE, 2019–2026 (USD MILLION)
TABLE 212 ASIA PACIFIC: DIAGNOSTIC DENTAL EQUIPMENT MARKET, BY TYPE, 2019–2026 (USD MILLION)
TABLE 213 ASIA PACIFIC: EXTRAORAL IMAGING SYSTEMS MARKET, BY TYPE, 2019–2026 (USD MILLION)
TABLE 214 ASIA PACIFIC: INTRAORAL IMAGING SYSTEMS MARKET, BY TYPE, 2019–2026 (USD MILLION)
TABLE 215 ASIA PACIFIC: MARKET, BY END USER, 2019–2026 (USD MILLION)
9.4.1 CHINA
9.4.1.1 Growing prevalence of dental diseases to drive market growth in China
TABLE 216 CHINA: MACROECONOMIC INDICATORS
TABLE 217 CHINA: MARKET, BY PRODUCT, 2019–2026 (USD MILLION)
TABLE 218 CHINA: THERAPEUTIC DENTAL EQUIPMENT MARKET, BY TYPE, 2019–2026 (USD MILLION)
TABLE 219 CHINA: DENTAL OPERATORY & TREATMENT CENTER EQUIPMENT MARKET, BY TYPE, 2019–2026 (USD MILLION)
TABLE 220 CHINA: DENTAL UNITS MARKET, BY TYPE, 2019–2026 (USD MILLION)
TABLE 221 CHINA: GENERAL EQUIPMENT MARKET, BY TYPE, 2019–2026 (USD MILLION)
TABLE 222 CHINA: DENTAL LASERS MARKET, BY TYPE, 2019–2026 (USD MILLION)
TABLE 223 CHINA: SOFT-TISSUE LASERS MARKET, BY TYPE, 2019–2026 (USD MILLION)
TABLE 224 CHINA: ALL-TISSUE LASERS MARKET, BY TYPE, 2019–2026 (USD MILLION)
TABLE 225 CHINA: DIAGNOSTIC DENTAL EQUIPMENT MARKET, BY TYPE, 2019–2026 (USD MILLION)
TABLE 226 CHINA: EXTRAORAL IMAGING SYSTEMS MARKET, BY TYPE, 2019–2026 (USD MILLION)
TABLE 227 CHINA: INTRAORAL IMAGING SYSTEMS MARKET, BY TYPE, 2019–2026 (USD MILLION)
TABLE 228 CHINA: MARKET, BY END USER, 2019–2026 (USD MILLION)
9.4.2 JAPAN
9.4.2.1 The rising geriatric population and favorable reimbursement scenario are supporting market growth in Japan
TABLE 229 JAPAN: MACROECONOMIC INDICATORS
TABLE 230 JAPAN: MARKET, BY PRODUCT, 2019–2026 (USD MILLION)
TABLE 231 JAPAN: THERAPEUTIC DENTAL EQUIPMENT MARKET, BY TYPE, 2019–2026 (USD MILLION)
TABLE 232 JAPAN: DENTAL OPERATORY & TREATMENT CENTER EQUIPMENT MARKET, BY TYPE, 2019–2026 (USD MILLION)
TABLE 233 JAPAN: DENTAL UNITS MARKET, BY TYPE, 2019–2026 (USD MILLION)
TABLE 234 JAPAN: GENERAL EQUIPMENT MARKET, BY TYPE, 2019–2026 (USD MILLION)
TABLE 235 JAPAN: DENTAL LASERS MARKET, BY TYPE, 2019–2026 (USD MILLION)
TABLE 236 JAPAN: SOFT-TISSUE LASERS MARKET, BY TYPE, 2019–2026 (USD MILLION)
TABLE 237 JAPAN: ALL-TISSUE LASERS MARKET, BY TYPE, 2019–2026 (USD MILLION)
TABLE 238 JAPAN: DIAGNOSTIC DENTAL EQUIPMENT MARKET, BY TYPE, 2019–2026 (USD MILLION)
TABLE 239 JAPAN: EXTRAORAL IMAGING SYSTEMS MARKET, BY TYPE, 2019–2026 (USD MILLION)
TABLE 240 JAPAN: INTRAORAL IMAGING SYSTEMS MARKET, BY TYPE, 2019–2026 (USD MILLION)
TABLE 241 JAPAN: DENTAL EQUIPMENT MARKET, BY END USER, 2019–2026 (USD MILLION)
9.4.3 INDIA
9.4.3.1 Growth of the dental care sector and rising foreign investment in India will drive the dental equipment market
TABLE 242 INDIA: MACROECONOMIC INDICATORS
TABLE 243 INDIA: DENTAL EQUIPMENT MARKET, BY PRODUCT, 2019–2026 (USD MILLION)
TABLE 244 INDIA: THERAPEUTIC DENTAL EQUIPMENT MARKET, BY TYPE, 2019–2026 (USD MILLION)
TABLE 245 INDIA: DENTAL OPERATORY & TREATMENT CENTER EQUIPMENT MARKET, BY TYPE, 2019–2026 (USD MILLION)
TABLE 246 INDIA: DENTAL UNITS MARKET, BY TYPE, 2019–2026 (USD MILLION)
TABLE 247 INDIA: GENERAL EQUIPMENT MARKET, BY TYPE, 2019–2026 (USD MILLION)
TABLE 248 INDIA: DENTAL LASERS MARKET, BY TYPE, 2019–2026 (USD MILLION)
TABLE 249 INDIA: SOFT-TISSUE LASERS MARKET, BY TYPE, 2019–2026 (USD MILLION)
TABLE 250 INDIA: ALL-TISSUE LASERS MARKET, BY TYPE, 2019–2026 (USD MILLION)
TABLE 251 INDIA: DIAGNOSTIC DENTAL EQUIPMENT MARKET, BY TYPE, 2019–2026 (USD MILLION)
TABLE 252 INDIA: EXTRAORAL IMAGING SYSTEMS MARKET, BY TYPE, 2019–2026 (USD MILLION)
TABLE 253 INDIA: INTRAORAL IMAGING SYSTEMS MARKET, BY TYPE, 2019–2026 (USD MILLION)
TABLE 254 INDIA: DENTAL EQUIPMENTS MARKET, BY END USER, 2019–2026 (USD MILLION)
9.4.4 REST OF ASIA PACIFIC
TABLE 255 ROAPAC: DENTAL EQUIPMENTS MARKET, BY PRODUCT, 2019–2026 (USD MILLION)
TABLE 256 ROAPAC: THERAPEUTIC DENTAL EQUIPMENTS MARKET, BY TYPE, 2019–2026 (USD MILLION)
TABLE 257 ROAPAC: DENTAL OPERATORY & TREATMENT CENTER EQUIPMENT MARKET, BY TYPE, 2019–2026 (USD MILLION)
TABLE 258 ROAPAC: DENTAL UNITS MARKET, BY TYPE, 2019–2026 (USD MILLION)
TABLE 259 ROAPAC: GENERAL EQUIPMENT MARKET, BY TYPE, 2019–2026 (USD MILLION)
TABLE 260 ROAPAC: DENTAL LASERS MARKET, BY TYPE, 2019–2026 (USD MILLION)
TABLE 261 ROAPAC: SOFT-TISSUE LASERS MARKET, BY TYPE, 2019–2026 (USD MILLION)
TABLE 262 ROAPAC: ALL-TISSUE LASERS MARKET, BY TYPE, 2019–2026 (USD MILLION)
TABLE 263 ROAPAC: DIAGNOSTIC DENTAL EQUIPMENTS MARKET, BY TYPE, 2019–2026 (USD MILLION)
TABLE 264 ROAPAC: EXTRAORAL IMAGING SYSTEMS MARKET, BY TYPE, 2019–2026 (USD MILLION)
TABLE 265 ROAPAC: INTRAORAL IMAGING SYSTEMS MARKET, BY TYPE, 2019–2026 (USD MILLION)
TABLE 266 ROAPAC: MARKET, BY END USER, 2019–2026 (USD MILLION)
9.5 LATIN AMERICA
9.5.1 GROWING DENTAL TOURISM TO DRIVE MARKET GROWTH IN LATIN AMERICA
TABLE 267 LATIN AMERICA: MARKET, BY PRODUCT, 2019–2026 (USD MILLION)
TABLE 268 LATIN AMERICA: THERAPEUTIC DENTAL EQUIPMENTS MARKET, BY TYPE, 2019–2026 (USD MILLION)
TABLE 269 LATIN AMERICA: DENTAL OPERATORY & TREATMENT CENTER EQUIPMENT MARKET, BY TYPE, 2019–2026 (USD MILLION)
TABLE 270 LATIN AMERICA: DENTAL UNITS MARKET, BY TYPE, 2019–2026 (USD MILLION)
TABLE 271 LATIN AMERICA: GENERAL EQUIPMENT MARKET, BY TYPE, 2019–2026 (USD MILLION)
TABLE 272 LATIN AMERICA: DENTAL LASERS MARKET, BY TYPE, 2019–2026 (USD MILLION)
TABLE 273 LATIN AMERICA: SOFT-TISSUE LASERS MARKET, BY TYPE, 2019–2026 (USD MILLION)
TABLE 274 LATIN AMERICA: ALL-TISSUE LASERS MARKET, BY TYPE, 2019–2026 (USD MILLION)
TABLE 275 LATIN AMERICA: DIAGNOSTIC MARKET, BY TYPE, 2019–2026 (USD MILLION)
TABLE 276 LATIN AMERICA: EXTRAORAL IMAGING SYSTEMS MARKET, BY TYPE, 2019–2026 (USD MILLION)
TABLE 277 LATIN AMERICA: INTRAORAL IMAGING SYSTEMS MARKET, BY TYPE, 2019–2026 (USD MILLION)
TABLE 278 LATIN AMERICA: MARKET, BY END USER, 2019–2026 (USD MILLION)
9.6 MIDDLE EAST AND AFRICA
9.6.1 GROWING AWARENESS ABOUT DENTAL HYGIENE TO DRIVE MARKET GROWTH
TABLE 279 MEA: MARKET, BY PRODUCT, 2019–2026 (USD MILLION)
TABLE 280 MEA: THERAPEUTIC DENTAL EQUIPMENTS MARKET, BY TYPE, 2019–2026 (USD MILLION)
TABLE 281 MEA: DENTAL OPERATORY & TREATMENT CENTER EQUIPMENT MARKET, BY TYPE, 2019–2026 (USD MILLION)
TABLE 282 MEA: DENTAL UNITS MARKET, BY TYPE, 2019–2026 (USD MILLION)
TABLE 283 MEA: GENERAL EQUIPMENT MARKET, BY TYPE, 2019–2026 (USD MILLION)
TABLE 284 MEA: DENTAL LASERS MARKET, BY TYPE, 2019–2026 (USD MILLION)
TABLE 285 MEA: SOFT-TISSUE LASERS MARKET, BY TYPE, 2019–2026 (USD MILLION)
TABLE 286 MEA: ALL-TISSUE LASERS MARKET, BY TYPE, 2019–2026 (USD MILLION)
TABLE 287 MEA: DIAGNOSTIC DENTAL EQUIPMENTS MARKET, BY TYPE, 2019–2026 (USD MILLION)
TABLE 288 MEA: EXTRAORAL IMAGING SYSTEMS MARKET, BY TYPE, 2019–2026 (USD MILLION)
TABLE 289 MEA: INTRAORAL IMAGING SYSTEMS MARKET, BY TYPE, 2019–2026 (USD MILLION)
TABLE 290 MEA: MARKET, BY END USER, 2019–2026 (USD MILLION)
10 COMPETITIVE LANDSCAPE (Page No. - 212)
10.1 OVERVIEW
10.2 KEY PLAYER STRATEGIES
FIGURE 39 KEY STRATEGIC DEVELOPMENTS IN THE DENTAL EQUIPMENTS MARKET
10.3 REVENUE SHARE ANALYSIS OF THE TOP MARKET PLAYERS
FIGURE 40 TOP MARKET PLAYERS DOMINATE THE DENTAL EQUIPMENTS MARKET
10.4 DENTAL EQUIPMENTS MARKET SHARE (2020)
TABLE 291 DENTAL EQUIPMENTS MARKET: DEGREE OF COMPETITION
10.5 MARKET SHARE ANALYSIS
FIGURE 41 DENTAL EQUIPMENTS MARKET SHARE, BY KEY PLAYER, 2020
10.6 COMPANY EVALUATION QUADRANT
10.6.1 STARS
10.6.2 EMERGING LEADERS
10.6.3 PERVASIVE PLAYERS
10.6.4 PARTICIPANTS
FIGURE 42 MARKET: COMPANY EVALUATION QUADRANT (2020)
10.7 COMPANY EVALUATION QUADRANT FOR SMES/START-UPS (2020)
10.7.1 PROGRESSIVE COMPANIES
10.7.2 DYNAMIC COMPANIES
10.7.3 STARTING BLOCKS
10.7.4 RESPONSIVE COMPANIES
FIGURE 43 DENTAL EQUIPMENTS MARKET: COMPANY EVALUATION QUADRANT FOR SMES/START-UPS, 2020
10.8 COMPANY PRODUCT FOOTPRINT
FIGURE 44 COMPANY PRODUCT FOOTPRINT: DENTAL EQUIPMENTS MARKET
10.9 COMPANY GEOGRAPHIC FOOTPRINT
FIGURE 45 GEOGRAPHIC REVENUE MIX: DENTAL EQUIPMENT MARKET (2020)
10.10 DENTAL EQUIPMENTS MARKET: R&D EXPENDITURE
FIGURE 46 R&D EXPENDITURE OF KEY PLAYERS IN THE DENTAL EQUIPMENTS MARKET (2019/2020)
10.11 COMPETITIVE SCENARIO
10.11.1 PRODUCT LAUNCHES
10.11.2 DEALS
10.11.3 OTHER DEVELOPMENTS
11 COMPANY PROFILES (Page No. - 223)
(Business Overview, Products & services Offered, Recent Developments, and MnM View (Key strengths/Right to Win, Strategic Choices Made, and Weaknesses and Competitive Threats))*
11.1 KEY PLAYERS
11.1.1 DENTSPLY SIRONA
TABLE 295 DENTSPLY SIRONA: BUSINESS OVERVIEW
FIGURE 47 DENTSPLY SIRONA: COMPANY SNAPSHOT (2020)
11.1.2 PLANMECA GROUP
TABLE 296 PLANMECA GROUP: BUSINESS OVERVIEW
11.1.3 ENVISTA HOLDINGS CORPORATION
TABLE 297 ENVISTA HOLDINGS CORPORATION: BUSINESS OVERVIEW
FIGURE 48 ENVISTA HOLDINGS CORPORATION: COMPANY SNAPSHOT (2020)
11.1.4 A-DEC
TABLE 298 A-DEC: BUSINESS OVERVIEW
11.1.5 J. MORITA CORP.
TABLE 299 J. MORITA CORP: BUSINESS OVERVIEW
11.1.6 IVOCLAR VIVADENT
TABLE 300 IVOCLAR VIVADENT: BUSINESS OVERVIEW
11.1.7 GC CORPORATION
TABLE 301 GC CORPORATION: BUSINESS OVERVIEW
11.1.8 ALIGN TECHNOLOGY
TABLE 302 ALIGN TECHNOLOGY: BUSINESS OVERVIEW
FIGURE 49 ALIGN TECHNOLOGY: COMPANY SNAPSHOT (2020)
11.1.9 MIDMARK CORPORATION
TABLE 303 MIDMARK CORPORATION.: BUSINESS OVERVIEW
11.1.10 3SHAPE
TABLE 304 3SHAPE: BUSINESS OVERVIEW
11.2 OTHER PLAYERS
11.2.1 STRAUMANN HOLDINGS AG
TABLE 305 STRAUMANN HOLDINGS AG: BUSINESS OVERVIEW
FIGURE 50 STRAUMANN HOLDING AG: COMPANY SNAPSHOT (2020)
11.2.2 ULTRADENT PRODUCTS
TABLE 306 ULTRADENT PRODUCTS: BUSINESS OVERVIEW
11.2.3 BIOLASE
TABLE 307 BIOLASE: BUSINESS OVERVIEW
FIGURE 51 BIOLASE: COMPANY SNAPSHOT (2020)
11.2.4 3M
TABLE 308 3M: BUSINESS OVERVIEW
FIGURE 52 3M: COMPANY SNAPSHOT (2020)
11.2.5 BEGO
TABLE 309 BEGO: BUSINESS OVERVIEW
11.2.6 YOSHIDA DENTAL
TABLE 310 YOSHIDA DENTAL: BUSINESS OVERVIEW
11.2.7 NAKANISHI
TABLE 311 NAKANISHI: BUSINESS OVERVIEW
11.2.8 DENTALEZ
TABLE 312 DENTAL EZ: BUSINESS OVERVIEW
11.2.9 CARESTREAM DENTAL
TABLE 313 CARESTREAM DENTAL: BUSINESS OVERVIEW
11.2.10 TAKARA BELMONT
TABLE 314 TAKARA BELMONT: BUSINESS OVERVIEW
11.2.11 NOVA INSTRUMENTS
11.2.12 NEWTOM
11.2.13 MILLENNIUM DENTAL TECHNOLOGIES
11.2.14 PREXION
11.2.15 BRASSELER USA
11.2.16 AMD LASERS
11.2.17 ASEPTICO
11.2.18 BIEN-AIR DENTAL
*Details on Business Overview, Products & services Offered, Recent Developments, and MnM View (Key strengths/Right to Win, Strategic Choices Made, and Weaknesses and Competitive Threats) might not be captured in case of unlisted companies.
12 APPENDIX (Page No. - 276)
12.1 DISCUSSION GUIDE
12.2 KNOWLEDGE STORE: MARKETSANDMARKETS’ SUBSCRIPTION PORTAL
12.3 AVAILABLE CUSTOMIZATIONS
12.4 RELATED REPORTS
12.5 AUTHOR DETAILS
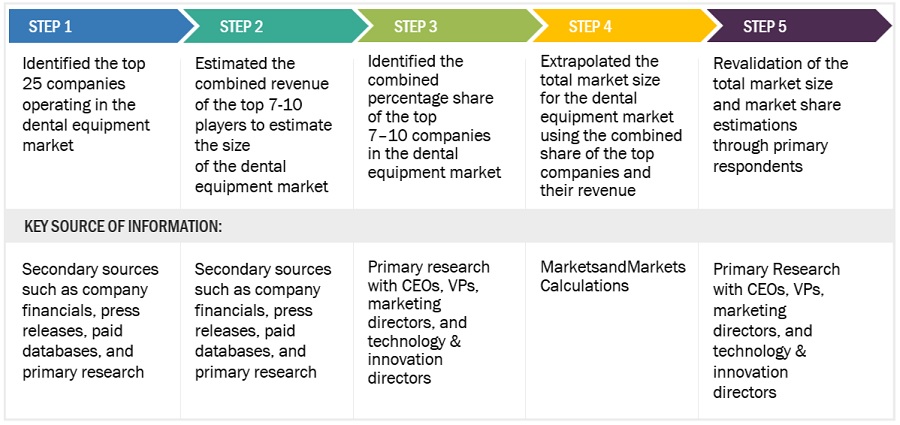
The bottom-up approach was used to estimate and validate the total size of the dental equipment market (value and volume). These approaches were also used extensively to estimate the size of various subsegments in the market. After arriving at the overall market size—using the market size estimation processes explained above—the market was split into several segments and subsegments. To complete the overall market engineering process and arrive at the exact statistics of each market segment and subsegment, data triangulation, and market breakdown procedures were employed, wherever applicable. The data was triangulated by studying various factors and trends from both the demand and supply sides of the dental equipment industry.
To know about the assumptions considered for the study, download the pdf brochure
Data Triangulation
After arriving at the overall market size—using the market size estimation processes as explained above—the market was split into several segments and subsegments. In order to complete the overall market engineering process and arrive at the exact statistics of each market segment and subsegment, the data triangulation and market breakdown procedures were employed, wherever applicable. The data was triangulated by studying various factors and trends from both, the demand and supply sides.
Approach to calculate the revenue of different players in the dental equipment market
The size of the dental equipment market was obtained from annual reports, SEC filings, online publications, and extensive primary interviews. A percentage split was applied to arrive at the size of market segments. Further splits were applied to arrive at the size for each sub-segment. Primary participants validated these percentage splits. The country-level market sizes obtained from the annual reports, SEC filings, online publications, and extensive primary interviews were added up to reach the total market size for regions. By adding up the market sizes for all the countries, the dental equipment market was derived.
Approach to derive the market size and estimate market growth
The market size and market growth were estimated through primary interviews on a regional and global level. All responses were collated, and a weighted average was taken to derive a probabilistic estimate of the market size and growth rate.
Objectives of the Study
- To define, describe, analyze, and forecast the Dental equipment market by product, end user and region
- To provide detailed information about the major factors influencing the market growth (such as drivers, restraints, opportunities, and challenges)
- To strategically analyze micromarkets with respect to individual growth trends, prospects, and contributions to the overall Dental equipment market
- To analyze market opportunities for stakeholders and provide details of the competitive landscape for key players
- To forecast the size of the dental equipment market in Europe, North America, the Asia Pacific, Latin America, and the Middle East and Africa.
- To profile key players and comprehensively analyze their market ranking and core competencies in the dental equipment market
- To track and analyze competitive developments such as acquisitions, product launches, and expansions in the Dental equipment market
Available Customizations
With the given market data, MarketsandMarkets offers customizations as per the company’s specific needs. The following customization options are available for the report:
Geographic Analysis
- A further breakdown of the Rest of Europe dental equipment market into the Netherlands, Belgium, Switzerland, and other countries
- A further breakdown of the Rest of the Asia Pacific dental equipment market into New Zealand and other countries
- A further breakdown of the Latin American dental equipment market into Brazil, Mexico, and other countries
Company Information
- Detailed analysis and profiling of additional market players
Growth opportunities and latent adjacency in Dental Equipment Market