BRIC Diagnostic Imaging Equipment Market by Modality ((X-Ray Imaging (Digital, Analog), MRI (High & Low Field), CT (Conventional, CBCT), Nuclear Imaging (SPECT, Hybrid PET)), End User (Hospitals, Imaging Centers) - Global Forecast to 2024


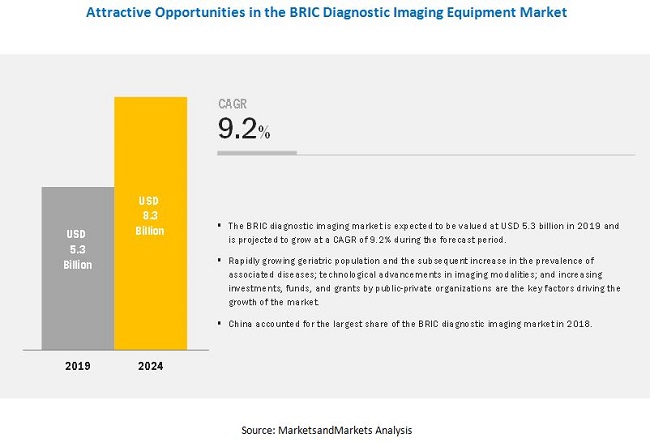
[175 Pages Report] The BRIC diagnostic imaging equipment market is projected to reach USD 8.3 billion by 2024 from USD 5.3 billion in 2019, at a CAGR of 9.2% during the forecast period. The major factors driving the growth of the BRIC diagnostic imaging equipment market include the rising burden of target diseases and increasing investments, funds, and grants for the modernization of imaging facilities.
The MRI systems segment accounted for the largest share of the BRIC diagnostic imaging equipment market in 2018
Based on modality, the BRIC diagnostic imaging equipment market is broadly segmented into six segments�X-ray imaging systems, CT scanners, ultrasound imaging systems, MRI systems, nuclear imaging systems, and mammography systems. The MRI systems segment held the largest share of the BRIC diagnostic imaging equipment market in 2018. One of the major factors driving the growth of this segment includes the rising disposable income in BRIC countries.
Hospitals accounted for the largest share of the market in 2018
Based on end user, the BRIC diagnostic imaging equipment market is segmented into hospitals, diagnostic imaging centers, and other end users. The hospitals segment commanded the largest share of the BRIC diagnostic imaging equipment market in 2018. The large share of this segment can be attributed to the rising number of diagnostic imaging procedures performed in hospitals, growing inclination of hospitals towards the automation and digitization of radiology patient workflow, increasing adoption of minimally invasive procedures (including diagnostic imaging systems) in hospitals to improve the quality of patient care, and rising adoption of advanced imaging modalities to improve workflow efficiency in hospitals.
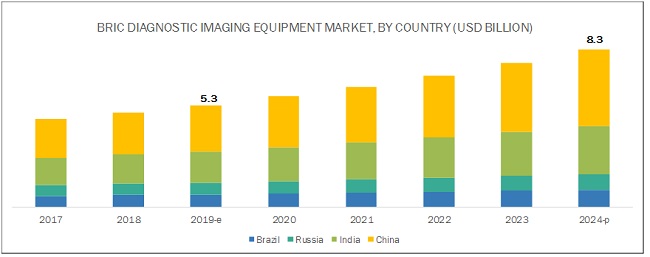
China is expected to grow at the highest CAGR during the forecast period
On the basis of country, the BRIC diagnostic imaging equipment market is segmented into Brazil, Russia, India, and China. China is expected to grow at the highest CAGR during the forecast period primarily due to the improving healthcare infrastructure, rising investments in diagnostic imaging, improving reimbursement scenario, and the growing insurance coverage in China.
Key Market Players
The major players in the market include GE Healthcare (US), Siemens Healthineers (Germany), Koninklijke Philips N.V. (Netherlands), Canon Medical Systems Corporation (Japan), Carestream Health, Inc. (US), Hologic, Inc. (US), Hitachi, Ltd. (Japan), Allengers (India), CURA Healthcare (India), Neusoft Corporation (China), NP JSC Amico (Russia), SONTU Medical Imaging Equipment Co., Ltd. (China), FUJIFILM Holdings Corporation (Japan), and United Imaging Healthcare Co, Ltd. (China), among others.
An analysis of the market developments between 2016 and 2019 revealed that several growth strategies such as product launches, upgrades, and enhancements; agreements, partnerships, and collaborations; expansions; acquisitions; and other strategies were adopted by market players to strengthen their product portfolios and maintain a competitive position in the BRIC diagnostic imaging equipment market. Among these business strategies, product launches, upgrades, and enhancements was the most widely adopted growth strategy by market players.
Koninklijke Philips N.V. (Netherlands) is a leader in diagnostic imaging, patient monitoring, image-guided therapy, and health informatics. The company held a major share of the BRIC diagnostic imaging equipment market in 2018. Philips has a strong geographical presence across the globe, with 93 production sites in 25 countries and sales & services spread across more than 100 countries. The company is focusing on expanding its presence in China and India due to its large patient pool and developing healthcare infrastructure. In line with the strategy, Philips launched Epiq Elite Ultrasound System, Ingenia Ambition MRI systems, and Ingenia Elition MRI systems in India.
Scope of the Report
|
Report Metric |
Details |
|
Market Size Available for Years |
2017�2024 |
|
Base Year Considered |
2018 |
|
Forecast Period |
2019�2024 |
|
Forecast Units |
Value (USD) |
|
Segments Covered |
Modality, End User, and Country |
|
Countries Covered |
Brazil, Russia, India, and China |
|
Companies Covered |
The major players in the market include GE Healthcare (US), Siemens Healthineers (Germany), Koninklijke Philips N.V. (Netherlands), Canon Medical Systems Corporation (Japan), Carestream Health, Inc. (US), Hologic, Inc. (US), Hitachi, Ltd. (Japan), Allengers (India), CURA Healthcare (India), Neusoft Corporation (China), NP JSC Amico (Russia), SONTU Medical Imaging Equipment Co., Ltd. (China), FUJIFILM Holdings Corporation (Japan), and United Imaging Healthcare Co, Ltd. (China), among others. |
This research report categorizes the diagnostic imaging equipment market based on modality, end user, and country.
BRIC Diagnostic Imaging Equipment Market, by Modality
- X-ray Imaging Systems
- By Technology
- X-ray Digital Imaging Systems
- Direct Radiography (DR)
- Computed Radiography (CR)
- X-ray Analog Imaging Systems
- X-ray Digital Imaging Systems
- By Portability
- Stationary
- Portable
- Computed Tomography (CT) Scanners
- By Technology
- Conventional CT systems
- Cone Beam CT Systems (CBCT)
- Conventional CT Systems Market, by Technology
- High-slice CT Scanners
- Mid-slice CT Scanners
- Low-slice CT Scanners
- Ultrasound Systems
- By Technology
- 2D Ultrasound
- 3D and 4D Ultrasound
- Doppler Ultrasound
- Magnetic Resonance Imaging (MRI) Systems
- By Architecture
- Closed MRI
- Open MRI
- By Field Strength
- High- and Very-high-field MRI Systems
- Low-to-mid-field MRI Systems
- Ultra-high-field MRI Systems
- Nuclear Imaging Systems
- SPECT Systems
- Standalone SPECT Systems
- Hybrid SPECT Systems
- Hybrid PET Systems
- Mammography Systems
BRIC Diagnostic Imaging Equipment Market, by End User
- Hospitals
- Diagnostic Imaging Centers
- Other End Users (Pharmaceutical & Biotechnology Companies, Academic & Research Centers, Dental Clinics, Sports Academies, and CROs)
BRIC Diagnostic Imaging Equipment Market, by Country
- Brazil
- Russia
- India
- China
Recent Developments:
- In 2019, GE Healthcare (US) has launched �Vector CT Scan� in China.
- In 2019, Hitachi, Ltd. (Japan) launched three new systems ARIETTA 65, ARIETTA 50, and ARIETTA 50 LE at the European Society of Radiology (ECR) in Russia.
- In 2019, Koninklijke Philips N.V. (Netherlands) launched the EPIQ Elite ultrasound system for general imaging as well as obstetrics & gynecology platforms in India.
- In 2018, Siemens Healthineers (Germany) introduced its Mammomat Revelation Mammography System and NX Series Ultrasound machines in India.
- In 2018, Canon Medical Systems Corporation (Japan) launched Aplio i 800, a high-end ultrasound diagnostic system.
- In 2017, Carestream Health (US) introduced the CS 9300 CBCT for dental 3D imaging in India.
Key Questions Addressed by the Report:
- What are the growth opportunities related to the adoption of diagnostic imaging across BRIC countries in the future?
- Which modality type will register a high adoption rate during the forecast period?
- Where will all the advancements in products offered by various companies take the industry in the mid- to long-term?
- Which end users are estimated to adopt diagnostic imaging products?
- What are the key strategies adopted by the key players operating in the market?
Frequently Asked Questions (FAQ):
What is the expected addressable market value of BRIC diagnostic imaging equipment market over a 5-year period?
Based on the prevailing trends and estimated market value data as of 2019, BRIC diagnostic imaging equipment market is projected to reach USD 8.3 billion by 2024.
What are the major challenges faced by the players operating in the BRIC diagnostic imaging equipment market?
High product cost, technological limitations of standalone systems, and increasing adoption of refurbished diagnostic imaging systems are few major challenges faced by players active in BRIC diagnostic imaging equipment Market.
Which modality segments are expected to garner highest traction within BRIC diagnostic imaging equipment market?
The MRI systems segment accounted for the largest share of the BRIC diagnostic imaging equipment market in 2018. The large share of this segment is attributed to the increasing geriatric population and the subsequent growth in the incidence of various diseases and the rising disposable income in BRIC countries.
What are the opportunities available for new entrants as well as existing market players in the BRIC diagnostic imaging equipment market?
Rapid expansion of diagnostic infrastructure in emerging countries, rising awareness on early disease detection, adoption of AI and analytics in diagnostic imaging are some of the key available opportunities for players in this market. Of all the major imaging modalities, the adoption of AI is higher in CT and MRI systems; likewise, based on applications, AI is majorly used in neuroradiology. Furthermore, several companies are significantly progressing in their offerings in the field of AI; key market players have also identified this opportunity and are focusing on the launch of AI-based platforms.
To speak to our analyst for a discussion on the above findings, click Speak to Analyst
 Exclusive indicates content/data unique to MarketsandMarkets and not available with any competitors.
Table of Contents
1 Introduction (Page No. - 17)
1.1 Objectives of the Study
1.2 Market Definition
1.3 Markets Scope
1.3.1 Markets Covered
1.3.2 Years Considered for the Study
1.4 Currency
1.5 Limitations
1.6 Stakeholders
2 Research Methodology (Page No. - 21)
2.1 Research Methodology Steps
2.2 Secondary and Primary Research Methodology
2.2.1 Secondary Research
2.2.1.1 Key Data From Secondary Sources
2.2.2 Primary Research
2.2.2.1 Key Data From Primary Sources
2.3 Market Size Estimation
2.3.1 Product-Based Market Estimation
2.3.2 Primary Research Validation
2.4 Market Breakdown and Data Triangulation
2.5 Research Assumptions and Limitations
2.5.1 Assumptions for the Study
2.5.2 Limitations
3 Executive Summary (Page No. - 32)
4 Premium Insights (Page No. - 36)
4.1 BRIC Diagnostic Imaging: Market Overview
4.2 Geographic Analysis: BRIC Diagnostic Imaging Equipment Market Share, By Modality and Country, 2019
4.3 BRIC Diagnostic Imaging Equipment Market, By End User, 2019 vs 2024 (USD Million)
4.4 Geographic Snapshot of the BRIC Diagnostic Imaging Equipment Market
5 Market Overview (Page No. - 40)
5.1 Introduction
5.2 Market Dynamics
5.2.1 Drivers
5.2.1.1 Growing Burden of Cancer
5.2.1.2 Rising Awareness on Early Disease Detection
5.2.1.3 Funding & Investments for the Modernization of Healthcare Facilities
5.2.1.4 Technological Advancements in Diagnostic Imaging Modalities
5.2.1.5 Expanding Applications of Diagnostic Imaging Equipment
5.2.2 Restraints
5.2.2.1 High Product Costs
5.2.2.2 Insufficient Helium Supply
5.2.3 Opportunities
5.2.3.1 Adoption of AI and Analytics in Diagnostic Imaging
5.2.3.2 Contract-Based Radiology Solutions and Mobile Solutions
5.2.4 Challenges
5.2.4.1 Increasing Adoption of Refurbished Diagnostic Imaging Systems
5.2.4.2 Technological Limitations of Standalone Systems
5.2.5 Pricing Analysis, 2018 (USD)
6 BRIC Diagnostic Imaging Equipment Market, By Modality (Page No. - 48)
6.1 Introduction
6.2 Magnetic Resonance Imaging (MRI) Systems
6.2.1 MRI Systems Market, By Architecture
6.2.1.1 Closed MRI Systems
6.2.1.1.1 Closed MRI Systems Segment Dominates the BRIC MRI Systems Market as They Offer Higher Image Quality and Throughput
6.2.1.2 Open MRI Systems
6.2.1.2.1 Open MRI Systems are Cost-Effective With Lower Upfront and Maintenance Costs
6.2.2 MRI Systems Market, By Field Strength
6.2.2.1 High- and Very-High-Field MRI Systems (1.5t to 6t)
6.2.2.1.1 High- and Very-High-Field MRI Systems Dominate the BRIC MRI Systems Market, Due to the Growing Need for High-Resolution Images and Demand for MRI With Higher Field Strength
6.2.2.2 Low-To-Mid-Field MRI Systems (<1.5t)
6.2.2.2.1 Low-To-Mid-Field MRI Systems Offer Lower Cost, Easy Installations, and Lesser Electricity Consumption
6.2.2.3 Ultra-High-Field MRI Systems (7.0t and Above)
6.2.2.3.1 Ultra-High-Field MRI Systems Find Applications in Research and Clinical Investigations
6.3 Ultrasound Imaging Systems
6.3.1 Ultrasound Imaging Systems Market, By Technology
6.3.1.1 2D Ultrasound Imaging Systems
6.3.1.1.1 Availability of Significant Medical Reimbursements & Ongoing Technological Advancements in the Field of 2D Ultrasound Imaging to Support Market Growth
6.3.1.2 3D & 4D Imaging Systems
6.3.1.2.1 Growing Number of Diagnostic Clinics Coupled With the High Birth Rate in BRIC Nations is the Major Factor Driving the Adoption of 3D & 4D Systems
6.3.1.3 Doppler Imaging
6.3.1.3.1 Doppler Imaging is Associated With Certain Disadvantages Such as the Heating of Tissues Being Scanned
6.4 Computed Tomography (CT) Scanners
6.4.1 CT Scanners Market, By Type
6.4.1.1 Conventional CT Scanners
6.4.1.1.1 High-Slice CT Scanners
6.4.1.1.1.1 High-Slice CT Scanners Offer Enhanced Image Clarity and Resolution, Faster Exams, and Improved Imaging of Vascular Structures
6.4.1.1.2 Mid-Slice CT Scanners
6.4.1.1.2.1 Mid-Slice CT Scanners Create 64 High-Resolution Images Per Rotation, Which Decreases the Scan Time to Several Seconds
6.4.1.1.3 Low-Slice CT Scanners
6.4.1.1.3.1 Low-Slice CT Scanners Provide an Economic Advantage to Healthcare Providers
6.4.1.2 Cone Beam CT Scanners
6.4.1.2.1 High Cost Associated With CBCT Scanners is Hampering the Growth of This Market
6.5 X-Ray Imaging Systems
6.5.1 X-Ray Imaging Systems Market, By Technology
6.5.1.1 Digital X-Ray Imaging
6.5.1.1.1 Direct Radiography Systems
6.5.1.1.1.1 Dr Systems have High Demand in Hospital Radiology Departments as They Provide Improved Image Quality, Improved Workflows, and Higher Number of Scans Per Day Compared to Other Diagnostic Imaging Modalities
6.5.1.1.2 Computed Radiography (CR)
6.5.1.1.2.1 Rising Prevalence of Breast Cancer to Drive the Adoption of CR Systems as the CR Technology is Widely Used to Detect Breast Cancer
6.5.1.2 Analog X-Ray Imaging
6.5.1.2.1 Higher Risk of Radiation Exposure and Technological Limitations are Hampering the Growth of This Market
6.5.2 X-Ray Imaging Systems Market, By Portability
6.5.2.1 Stationary X-Ray Imaging Systems
6.5.2.1.1 Stationary X-Ray Imaging Systems Provide Enhanced Image Quality and Ease of Operation
6.5.2.2 Portable X-Ray Imaging Systems
6.5.2.2.1 Issues Related to the Transfer of Images, Connectivity Issues, and Problems Related to Battery Life are Restraining the Adoption of Portable X-Ray Systems
6.6 Nuclear Imaging Systems
6.6.1 SPECT Systems
6.6.1.1 Hybrid SPECT Systems
6.6.1.1.1 Hybrid SPECT Systems Offer Accurate Disease Staging, Early Diagnosis, and Effective Response to the Treatment of Various Chronic Conditions
6.6.1.2 Standalone SPECT Systems
6.6.1.2.1 Low Cost, Technological Advancements, and Long Radiotracer Half-Life have All Contributed to Market Growth
6.6.2 Hybrid PET Systems
6.6.2.1 High Cost of Hybrid PET Systems is Hampering Its Adoption in Small and Medium-Sized Hospitals
6.7 Mammography Systems
6.7.1 Mammography Systems Segment to Register the Highest Growth in the BRIC Diagnostic Imaging Equipment Market During the Forecast Period
7 BRIC Diagnostic Imaging Equipment Market, By End User (Page No. - 88)
7.1 Introduction
7.2 Hospitals
7.2.1 Hospitals are the Largest End-User Segment in the Diagnostic Imaging Market in BRIC
7.3 Diagnostic Imaging Centers
7.3.1 Rising Prevalence of Diseases and Growing Awareness have Driven the Importance of Diagnostic Imaging Centers
7.4 Other End Users
8 BRIC Diagnostic Imaging Equipment Market, By Country (Page No. - 94)
8.1 Introduction
8.2 China
8.2.1 China�s Rapidly Growing Population and Disease Incidence have Driven the Demand for Diagnostic Imaging
8.3 India
8.3.1 India Accounts for the Second-Largest Share of the BRIC Market
8.4 Brazil
8.4.1 Brazil�s Universal Healthcare System has Played A Pivotal Role in Driving the Use of Advanced Diagnostics
8.5 Russia
8.5.1 Complex Regulatory Scenario has Limited Market Growth in Russia
9 Competitive Landscape (Page No. - 120)
9.1 Introduction
9.2 Market Ranking, By Players (2018)
9.2.1 Diagnostic Imaging Market Ranking in China
9.2.2 Diagnostic Imaging Market Ranking in India
9.2.3 Diagnostic Imaging Market Ranking in Brazil
9.2.4 Diagnostic Imaging Market in Russia
9.3 Competitive Situation and Trends
9.4 Competitive Leadership Mapping
9.5 Vendor Inclusion Criteria
9.6 Vendor Dive
9.6.1 Visionary Leaders
9.6.2 Innovators
9.6.3 Dynamic Differentiators
9.6.4 Emerging Players
10 Company Profiles (Page No. - 127)
(Business Overview, Products Offered, Recent Developments, MnM View)*
10.1 Allengers
10.2 Canon
10.3 Carestream Health
10.4 CURA Healthcare
10.5 FUJIFILM
10.6 GE Healthcare (General Electric Company)
10.7 Hitachi Ltd.
10.8 Hologic, Inc.
10.9 Koninklijke Philips N.V.
10.10 Neusoft Corporation
10.11 NP JSC Amico
10.12 Siemens Healthineers (Subsidiary of Siemens Group)
10.13 Shimadzu Corporation
10.14 SONTU Medical Imaging Equipment Co., Ltd
10.15 United Imaging Healthcare Co., Ltd.
*Business Overview, Products Offered, Recent Developments, MnM View Might Not Be Captured in Case of Unlisted Companies.
11 Appendix (Page No. - 165)
11.1 Discussion Guide
11.2 Knowledge Store: Marketsandmarkets� Subscription Portal
11.3 Available Customizations
11.4 Related Reports
11.5 Author Details
List of Tables (93 Tables)
Table 1 BRIC Diagnostic Imaging Equipment Market, By Modality, 2017�2024 (USD Million)
Table 2 BRIC MRI Systems Market, By Country, 2017�2024 (USD Million)
Table 3 BRIC MRI Systems Market, By Architecture, 2017�2024 (USD Million)
Table 4 Closed MRI Systems Market, By Country, 2017�2024 (USD Million)
Table 5 Open MRI Systems Market, By Country, 2017�2024 (USD Million)
Table 6 MRI Systems Market, By Field Strength, 2017�2024 (USD Million)
Table 7 High- and Very-High Field MRI Systems Market, By Country, 2017�2024 (USD Million)
Table 8 Low-To-Mid-Field MRI Systems Market, By Country, 2017�2024 (USD Million)
Table 9 Ultra-High-Field MRI Systems Market, By Country, 2017�2024 (USD Million)
Table 10 Ultrasound Imaging Systems Market, By Country, 2017�2024 (USD Million)
Table 11 BRIC Ultrasound Systems Market, By Technology, 2017�2024 (USD Million)
Table 12 2D Ultrasound Imaging Systems Market, By Country, 2017�2024 (USD Million)
Table 13 3D & 4D Ultrasound Imaging Systems Market, By Country, 2017�2024 (USD Million)
Table 14 Doppler Imaging Ultrasound Systems Market, By Country, 2017�2024 (USD Million)
Table 15 BRIC CT Scanners Market, By Country, 2017�2024 (USD Million)
Table 16 BRIC CT Scanners Market, By Type, 2017�2024 (USD Million)
Table 17 Application Comparison Analysis of the Different Types of Conventional CT Scanners
Table 18 Conventional CT Scanners Market, By Slice Type, 2017�2024 (USD Million)
Table 19 High-Slice CT Scanners Market, By Country, 2017�2024 (USD Million)
Table 20 Mid-Slice CT Scanners Market, By Country, 2017�2024 (USD Million)
Table 21 Low-Slice CT Scanners Market, By Country, 2017�2024 (USD Million)
Table 22 Cbct Scanners Market, By Country, 2017�2024 (USD Million)
Table 23 BRIC X-Ray Imaging Systems Market, By Country, 2017�2024 (USD Million)
Table 24 BRIC X-Ray Imaging Systems Market, By Technology, 2017�2024 (USD Million)
Table 25 Digital X-Ray Imaging Systems Market, By Country, 2017�2024 (USD Million)
Table 26 Digital X-Ray Imaging Systems Market, By Type, 2017�2024 (USD Million)
Table 27 Direct Radiography X-Ray Systems Market, By Country, 2017�2024 (USD Million)
Table 28 Computed Radiography X-Ray Systems Market, By Country, 2017�2024 (USD Million)
Table 29 Analog X-Ray Imaging Systems Market, By Country, 2017�2024 (USD Million)
Table 30 BRIC X-Ray Imaging Systems Market, By Portability, 2017�2024 (USD Million)
Table 31 Stationary X-Ray Imaging Systems Market, By Country, 2017�2024 (USD Million)
Table 32 Portable X-Ray Imaging Systems Market, By Country, 2017�2024 (USD Million)
Table 33 Nuclear Imaging Systems Market, By Country, 2017�2024 (USD Million)
Table 34 BRIC Diagnostic Imaging Equipment Market, By Modality, 2017�2024 (USD Million)
Table 35 Spect Systems Market, By Country, 2017�2024 (USD Million)
Table 36 Spect Systems Market, By Type, 2017�2024 (USD Million)
Table 37 Hybrid Spect Systems Market, By Country, 2017�2024 (USD Million)
Table 38 Standalone Spect Systems Market, By Country, 2017�2024 (USD Million)
Table 39 Hybrid Pet Systems Market, By Country, 2017�2024 (USD Million)
Table 40 Mammography Systems Market, By Country, 2017�2024 (USD Million)
Table 41 BRIC Diagnostic Imaging Equipment Market, By End User, 2017�2024 (USD Million)
Table 42 BRIC Diagnostic Imaging Equipment Market for Hospitals, By Country, 2017�2024 (USD Million)
Table 43 BRIC Diagnostic Imaging Equipment Market for Diagnostic Imaging Centers, By Country, 2017�2024 (USD Million)
Table 44 BRIC Diagnostic Imaging Equipment Market for Other End Users, By Country, 2017�2024 (USD Million)
Table 45 Diagnostic Imaging Market, By Country, 2017�2024 (USD Million)
Table 46 China: Diagnostic Imaging Market, By Modality, 2017�2024 (USD Million)
Table 47 China: MRI Systems Market, By Architecture, 2017�2024 (USD Million)
Table 48 China: MRI Systems Market, By Field Strength, 2017�2024 (USD Million)
Table 49 China: CT Scanners Market, By Type, 2017�2024 (USD Million)
Table 50 China: Conventional CT Scanners Market, By Slice Type, 2017�2024 (USD Million)
Table 51 China: Ultrasound Imaging Systems Market, By Technology, 2017�2024 (USD Million)
Table 52 China: X-Ray Imaging Systems Market, By Technology, 2017�2024 (USD Million)
Table 53 China: Digital X-Ray Imaging Systems Market, By Type, 2017�2024 (USD Million)
Table 54 China: X-Ray Imaging Systems Market, By Portability, 2017�2024 (USD Million)
Table 55 China: Nuclear Imaging Systems Market, By Modality, 2017�2024 (USD Million)
Table 56 China: Spect Systems Market, By Type, 2017�2024 (USD Million)
Table 57 India: Diagnostic Imaging Market, By Modality, 2017�2024 (USD Million)
Table 58 India: MRI Systems Market, By Architecture, 2017�2024 (USD Million)
Table 59 India: MRI Systems Market, By Field Strength, 2017�2024 (USD Million)
Table 60 India: Ultrasound Imaging Systems Market, By Technology, 2017�2024 (USD Million)
Table 61 India: CT Scanners Market, By Type, 2017�2024 (USD Million)
Table 62 India: Conventional CT Scanners Market, By Slice Type, 2017�2024 (USD Million)
Table 63 India: X-Ray Imaging Systems Market, By Technology, 2017�2024 (USD Million)
Table 64 India: Digital X-Ray Imaging Systems Market, By Type, 2017�2024 (USD Million)
Table 65 India: X-Ray Imaging Systems Market, By Portability, 2017�2024 (USD Million)
Table 66 India: Nuclear Imaging Systems Market, By Modality, 2017�2024 (USD Million)
Table 67 India: Spect Systems Market, By Type, 2017�2024 (USD Million)
Table 68 Brazil: Diagnostic Imaging Market, By Modality, 2017�2024 (USD Million)
Table 69 Brazil: MRI Systems Market, By Architecture, 2017�2024 (USD Million)
Table 70 Brazil: MRI Systems Market, By Field Strength, 2017�2024 (USD Million)
Table 71 Brazil: CT Scanners Market, By Type, 2017�2024 (USD Million)
Table 72 Brazil: Conventional CT Scanners Market, By Slice Type, 2017�2024 (USD Million)
Table 73 Brazil: Ultrasound Imaging Systems Market, By Technology, 2017�2024 (USD Million)
Table 74 Brazil: X-Ray Imaging Systems Market, By Technology, 2017�2024 (USD Million)
Table 75 Brazil: Digital X-Ray Imaging Systems Market, By Type, 2017�2024 (USD Million)
Table 76 Brazil: X-Ray Imaging Systems Market, By Portability, 2017�2024 (USD Million)
Table 77 Brazil: Nuclear Imaging Systems Market, By Modality, 2017�2024 (USD Million)
Table 78 Brazil: Spect Systems Market, By Type, 2017�2024 (USD Million)
Table 79 Russia: Diagnostic Imaging Market, By Modality, 2017�2024 (USD Million)
Table 80 Russia: MRI Systems Market, By Architecture, 2017�2024 (USD Million)
Table 81 Russia: MRI Systems Market, By Field Strength, 2017�2024 (USD Million)
Table 82 Russia: Ultrasound Imaging Systems Market, By Technology, 2017�2024 (USD Million)
Table 83 Russia: CT Scanners Market, By Type, 2017�2024 (USD Million)
Table 84 Russia: Conventional CT Scanners Market, By Slice Type, 2017�2024 (USD Million)
Table 85 Russia: X-Ray Imaging Systems Market, By Technology, 2017�2024 (USD Million)
Table 86 Russia: Digital X-Ray Imaging Systems Market, By Type, 2017�2024 (USD Million)
Table 87 Russia: X-Ray Imaging Systems Market, By Portability, 2017�2024 (USD Million)
Table 88 Russia: Nuclear Imaging Systems Market, By Modality, 2017�2024 (USD Million)
Table 89 Russia: Spect Systems Market, By Type, 2017�2024 (USD Million)
Table 90 Product Launches and Approvals
Table 91 Agreements, Partnerships, and Collaborations
Table 92 Expansions
Table 93 Acquisitions
List of Figures (46 Figures)
Figure 1 BRIC Diagnostic Imaging Equipment Market: Research Methodology Steps
Figure 2 Research Design
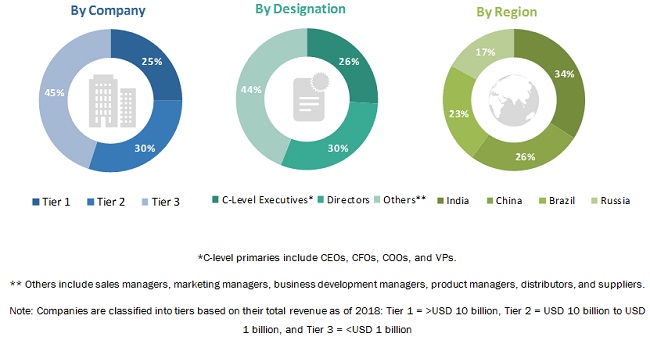
Figure 3 Breakdown of Supply-Side Primary Interviews: By Company Type, Designation, and Country
Figure 4 Research Methodology: Hypothesis Building
Figure 5 Bottom-Up Approach Market Size Estimation: BRIC Diagnostic Imaging Equipment Market
Figure 6 Top-Down Approach Market Size Estimation: BRIC Diagnostic Imaging Equipment Market
Figure 7 BRIC Diagnostic Imaging Equipment Market: Data Triangulation Methodology
Figure 8 BRIC Diagnostic Imaging Equipment Market, By Modality, 2019 vs 2024 (USD Million)
Figure 9 MRI Systems Market Share, By Field Strength, 2019 vs 2024 (USD Million)
Figure 10 BRIC Diagnostic Imaging Equipment Market, By End User, 2019 vs 2024 (USD Million)
Figure 11 Geographical Snapshot of the BRIC Diagnostic Imaging Equipment Market
Figure 12 Increasing Geriatric Population to Drive Market Growth
Figure 13 MRI Systems are Expected to Hold the Largest Market Share in 2019
Figure 14 Hospitals to Grow at the Highest CAGR During the Forecast Period
Figure 15 China to Register the Highest CAGR During the Forecast Period
Figure 16 BRIC Diagnostic Imaging Equipment Market: Drivers, Restraints, Opportunities, and Challenges
Figure 17 Number of New Cases Diagnosed in BRIC (2018)
Figure 18 New Cancer Cases Diagnosed in BRIC, 2018: an Overview
Figure 19 MRI Systems Segment Accounted for the Largest Share of the BRIC Diagnostic Imaging Equipment Market in 2018
Figure 20 Closed MRI Systems Segment to Witness the Highest Growth in the BRIC MRI Systems Market, By Architecture, During the Forecast Period
Figure 21 High- and Very-High-Field Systems Segment is Expected to Dominate the MRI Systems Market, By Field Strength, During the Forecast Period
Figure 22 2D Ultrasound Imaging Systems Segment Accounted for the Largest Share of the BRIC Ultrasound Imaging Systems Market in 2018
Figure 23 India: Crude Birth Rate (CBR) By State, 2016
Figure 24 Conventional CT Scanners Segment Will Continue to Dominate the BRIC CT Scanners Market During the Forecast Period
Figure 25 Digital X-Ray Imaging Systems Segment Accounted for the Larger Share of the X-Ray Imaging Systems Market, By Technology, in 2018
Figure 26 Portable X-Ray Imaging Systems Segment to Register Higher Growth in the X-Ray Imaging Systems Market During the Forecast Period
Figure 27 Spect Systems Segment Accounted for the Larger Share of the Nuclear Imaging Systems Market in 2018
Figure 28 Hybrid Spect Systems Segment to Witness the Highest Growth in the Spect Systems Market During the Forecast Period
Figure 29 BRIC Diagnostic Imaging Equipment Market, By End User, 2019 vs 2024 (USD Million)
Figure 30 China Market to Grow at the Highest CAGR During the Forecast Period
Figure 31 India: Diagnostic Imaging Market Snapshot
Figure 32 Brazil: Diagnostic Imaging Market Snapshot
Figure 33 China Diagnostic Imaging Market Ranking, By Key Player, 2018
Figure 34 India Diagnostic Imaging Market Ranking, By Players, 2018
Figure 35 Brazil Diagnostic Imaging Market Ranking, By Players, 2018
Figure 36 Russia Diagnostic Imaging Market Ranking, By Players, 2018
Figure 37 BRIC Diagnostic Imaging Equipment Market Competitive Leadership Mapping, 2018
Figure 38 Canon, Inc.: Company Snapshot
Figure 39 Fujifilm Holdings Corporation: Company Snapshot
Figure 40 General Electric Company: Company Snapshot
Figure 41 Hitachi Ltd.: Company Snapshot
Figure 42 Hologic, Inc.: Company Snapshot
Figure 43 Koninklijke Philips N.V.: Company Snapshot
Figure 44 Neusoft Corporation: Company Snapshot (2018)
Figure 45 Siemens Group: Company Snapshot
Figure 46 Shimadzu Corporation: Company Snapshot
The study involved four major activities to estimate the current size of the BRIC diagnostic imaging equipment market. Exhaustive secondary research was done to collect information on the market and its different subsegments. The next step was to validate these findings, assumptions, and sizing with industry experts across the value chain through primary research. Both top-down and bottom-up approaches were employed to estimate the complete market size. Thereafter, market breakdown and data triangulation procedures were used to estimate the size of the segments and subsegments.
Secondary Research
This research study involved the extensive use of secondary sources, directories, and databases (such as D&B Hoovers, Bloomberg Businessweek, and Factiva), along with government databases, which were used to identify and collect information for this method-based, market-oriented, and commercial study of the BRIC diagnostic imaging equipment market.
In-depth interviews were conducted with various primary respondents that mainly include key industry participants, medical practitioners, subject-matter experts (SMEs), C-level and D-level executives of key market players, and industry consultants to obtain and verify critical qualitative and quantitative information as well as to assess prospects of the BRIC diagnostic imaging equipment market.
Primary Research
Extensive primary research was conducted after acquiring knowledge about the BRIC diagnostic imaging equipment market scenario through secondary research. A significant number of primary interviews were conducted with both the demand (healthcare providers, research institutes, physicians, and healthcare professionals) and supply sides (developers, manufacturers, and distributors of diagnostic imaging products). The primaries interviewed for this study include experts from the diagnostic imaging and medical devices industry (such as CEOs, VPs, directors, sales heads, and marketing managers of tier 1, 2, and 3 companies engaged in offering diagnostic imaging solutions across BRIC countries) and administrators & purchase managers of hospitals & diagnostic centers, radiologists, oncologists, neurologists, and healthcare service providers.
Around 60% and 40% primary interviews were conducted with the supply and demand sides, respectively. A robust primary research methodology has been adopted to validate the contents of the report and to fill gaps. Telephonic and e-mail communications were adopted to conduct interviews (questionnaires were designed and sent to primary participants as per their convenience). The following is the breakdown of primary respondents:
To know about the assumptions considered for the study, download the pdf brochure
Market Size Estimation
A detailed market estimation approach was followed to estimate and validate the size of the BRIC diagnostic imaging equipment market and other dependent submarkets, as mentioned above. The key players in the BRIC diagnostic imaging equipment market were identified through secondary research, and their market shares in the respective countries were determined through primary and secondary research. Research methodology includes the study of the annual and quarterly financial reports of the top market players as well as interviews with industry experts for key insights (both quantitative and qualitative trends) on this market. All percentage shares, splits, and breakdowns were determined by using secondary sources and verified through primary sources. All the possible parameters that affect the market segments covered in this research study have been accounted for, viewed in extensive detail, verified through primary research, and analyzed to get the final quantitative and qualitative data. This data was consolidated and added to detailed inputs and analysis from MarketsandMarkets, and presented in this report. The research methodology used to estimate the market size includes the following:
- The key players in the industry and markets have been identified through extensive secondary research.
- The industry�s supply chain and market size, in terms of value, have been determined through primary and secondary research processes.
- All percentage shares, splits, and breakdowns have been determined using secondary sources and verified through primary sources.
Data Triangulation
After arriving at the overall market size of the BRIC diagnostic imaging equipment industry from the market estimation approach explained above, the BRIC market was split into several segments and subsegments. To complete the overall market engineering process and arrive at the exact market value data, data triangulation and market breakdown methodology methods were employed, wherever applicable. The data was triangulated by studying various factors and trends from both the demand- and supply-side analysis.
Report Objectives
- To define, describe, and forecast the BRIC diagnostic imaging equipment market on the basis of modality, end user, and country
- To provide detailed information regarding the major factors influencing the growth of the market (such as drivers, restraints, opportunities, and industry-specific challenges)
- To strategically analyze the micromarkets with respect to individual growth trends, future prospects, and contributions to the BRIC diagnostic imaging equipment market
- To analyze the opportunities in the market for stakeholders and provide details of the competitive landscape for market leaders
- To forecast the revenue of the market segments with respect to four main countries, namely, Brazil, Russia, India, and China
- To strategically profile the key players and comprehensively analyze their market shares and core competencies
- To track and analyze competitive developments such as new product launches; agreements, partnerships, and joint ventures; mergers & acquisitions; business expansions; and research & development activities in the BRIC diagnostic imaging equipment market
Available Customizations
With the given market data, MarketsandMarkets offers customizations as per the company�s specific needs. The following customization options are available for the present BRIC diagnostic imaging equipment market report:
Product Analysis
Product matrix, which gives a detailed comparison of the product portfolios of the top five companies
Company Information
Detailed analysis and profiling of additional market players (up to 5)

 Generating Response ...


Growth opportunities and latent adjacency in BRIC Diagnostic Imaging Equipment Market