[232 Pages Report] The ultrasound market is projected to reach USD 8.2 billion by 2025 from USD 6.1 billion in 2020, at a CAGR of 6.1% during the forecast period. Ongoing technological advancements in the field of diagnostic & therapeutic ultrasound imaging, availability of medical reimbursements for diagnostic ultrasound procedures in mature markets, and the growing applications of emerging ultrasound techniques (such as Doppler ultrasound in vascular imaging and 3D/4D ultrasound in oncology) are driving the growth of ultrasound market.
To know about the assumptions considered for the study, Request for Free Sample Report
The ultrasound market has been negatively impacted by the pandemic, and this trend is expected to continue till December 2020. Unfavorable changes in regulations and guidelines are hampering the growth of this market. The closing down of manufacturing facilities due to lockdowns, disruptions in supply chains, and recruitment challenges for clinical trials have further impacted the growth of the overall ultrasound market.
To address various challenges in the current scenario and ensure the safety of patients, various societies and national authorities, such as the American Institute of Ultrasound in Medicine, have developed international guidelines. These guidelines are focused on helping patients, allied healthcare staff, industry representatives, and hospital administrators identify potential risks of exposure to patients, and manage ultrasound procedures and clinic visits during the COVID-19 pandemic.
The high and increasing incidence of target diseases and conditions will boost the adoption of effective diagnostic and therapeutic procedures. As ultrasound technologies are cost-effective, safer, and offer earlier diagnosis & treatment of target diseases, their demand in disease management is expected to increase during the forecast period. Important statistics related to other major target diseases have been mentioned below:
In August 2012, the US government planned to reduce Medicare spending by USD 716 billion over the next ten years (until 2022). Many industry participants expect that this health reform will negatively affect the cash flow for medical device companies operating in the US (including those involved in the manufacturing and marketing of ultrasound systems). This may limit the adoption of such devices in the US, as a number of healthcare facilities depend on government funds for purchasing high-end, highly expensive instruments.
Minimally invasive therapies and image-guided procedures are increasingly being adopted by healthcare professionals and patients across the world. The ultrasound industry has witnessed a significant shift from being a conventional diagnostic modality for OB/GYN imaging to a therapeutic technique for renal stones, cancers, and other clinical conditions. It can be expected that such efforts will open up new avenues for revenue growth for manufacturers in this market.
Due to the high prices of novel ultrasound technologies (such as focused ultrasound) and budgetary constraints faced by small-sized healthcare providers, the preference for refurbished ultrasound equipment has grown. For instance, a typical 3D/4D ultrasound system costs USD 20,000–75,000 in North America, while a refurbished 3D/4D ultrasound system costs USD 5,000–40,000. The growing preference for refurbished systems is, therefore, expected to pose a significant challenge to market growth.
To know about the assumptions considered for the study, download the pdf brochure
Based on technology, the ultrasound market is segmented into diagnostic ultrasound (2D, 3D & 4D, and Doppler ultrasound) and therapeutic ultrasound (focused ultrasound and shockwave lithotripsy). The diagnostic ultrasound segment is expected to account for the larger share of the ultrasound market in 2019. The large share of this segment can be attributed to the significant usage of 2D ultrasound in women’s health, availability of medical reimbursements for diagnostic ultrasound procedures in mature markets, ongoing technological advancements in the field of diagnostic ultrasound imaging, and the growing applications of emerging ultrasound techniques.
On the basis of system portability, the ultrasound market is segmented into trolley/cart-based ultrasound systems, compact/handheld ultrasound systems, and point-of-care ultrasound systems. The trolley/cart-based ultrasound systems segment is expected to account for the largest share of the ultrasound market in 2019. The large share of this segment is attributed to the growing adoption of these systems across major markets due to their increased usage in acute care settings and emergency care in hospitals and healthcare institutions.
On the basis of application, the ultrasound market is segmented into radiology/general imaging, obstetrics/gynecology, cardiologic applications, vascular applications, urological applications, orthopedic & musculoskeletal applications, pain management, and other applications. The radiology/general imaging applications segment is expected to command the largest share of the ultrasound market in 2018. Factors such as the rising incidence of various cancers across major countries, technological advancements in the field of ultrasound-based diagnosis and treatment, growing market availability and physician preference for HIFU in cancer treatment, increasing usage of ultrasound in cancer diagnosis and tissue biopsy, and the rising adoption of focused ultrasound in disease therapies are driving the growth of the radiology/general imaging segment.
Based on end user, the ultrasound market is segmented into hospitals, surgical centers, and diagnostic centers; maternity centers; ambulatory care centers; research and academia; and other end users. The hospitals, surgical centers, and diagnostic centers segment is expected to account for the largest share of the ultrasound market in 2019. The large share of this segment can be attributed to factors such as a significant number of ultrasound-based medical procedures performed in hospitals, coupled with the growing number of hospitals across major markets, and rising adoption of minimally invasive diagnostic & surgical procedures in these facilities.
The report covers the ultrasound market across five major geographies, namely, Europe, North America, Asia Pacific, Latin America and MEA. Europe is expected to command the largest share of the ultrasound market in 2019. Factors such as the large number of ongoing clinical research projects in the field of ultrasound, expansions in the clinical applications of focused ultrasound and the early commercialization of these devices in the region, and the significant healthcare expenditure across mature European countries (such as Germany, France, the UK, Italy, and Spain) are driving the growth of the ultrasound market in Europe.
The major players in the ultrasound market are GE Healthcare (US), Koninklijke Philips N.V. (Netherlands), Canon Medical Systems Corporation (Japan), Siemens Healthineers AG (Germany), Hitachi, Ltd. (Japan), Samsung Electronics , Ltd. (Korea), and FUJIFILM Holdings Corporation (Japan). The other prominent players operating in this market include Esaote S.p.A. (Italy), Mindray Medical International Ltd. (China), Shimadzu Corporation (Japan), Analogic Corporation (US), Carestream (US), Hologic (US), Mobisnate (US), and Chison Medical Imaging (China).
GE Healthcare (a key business division of General Electric Company) is among the top players engaged in the development and manufacturing of diagnostic ultrasound systems. The company focuses on maintaining its leadership position in the ultrasound market through pipeline development and product commercialization. From 2017 to 2020, the ultrasound market witnessed the commercialization of key ultrasound products by GE Healthcare, including the Versana Premier ultrasound system, Invenia Automated Breast Ultrasound (ABUS) 2.0 system, and Versana Essential ultrasound. The company is expected to witness sustainable growth during the forecast period with its broad and technologically advanced product portfolio, wide geographic reach, and high product promotional activities.
Report Metric |
Details |
Market size available for years |
2018–2025 |
Base year considered |
2019 |
Forecast period |
2020–2025 |
Forecast units |
Value (USD million) and Volume (annual sales units) |
Segments covered |
Technology, Device Display, System Portability, Application, End User, and Region |
Geographies covered |
Europe, North America, the Asia Pacific, Latin America, and Middle East and Africa |
Companies covered |
GE Healthcare (US), Koninklijke Philips N.V. (Netherlands), Canon Medical Systems Corporation (Japan), Hitachi, Ltd. (Japan), Siemens Healthineers AG (Germany), Hologic, Inc. (US), FUJIFILM Holdings Corporation (Japan), Samsung Electronics Co., Ltd. (Korea), Mindray Medical International Limited (China), Analogic Corporation (US), Esaote S.p.A (Italy), Shimadzu Corporation (Japan), Carestream Health (US), CURA Healthcare (India), Chison Medical Technologies Co., Ltd. (China), Mobisante, Inc. (US), Neusoft Corporation (China), Clarius Mobile Health (Canada), Medgyn Products, Inc. (US), and United Imaging Healthcare Co., Ltd. (China), among others |
This report has segmented the global ultrasound market based on technology, device display, system portability, application, end user, and region.
In 2020, Hitachi launched ARIETTA 750, a new model in the ARIETTA diagnostic ultrasound series.
In 2020, Philips received US FDA approval for its wide range of ultrasound solutions—such as EPIQ series, Affiniti series, Lumify, CX50, and Sparq diagnostic ultrasound systems— for the management of COVID-19-related lung and cardiac complications.
In 2020, Mindray introduced the novel ME series of portable ultrasound systems to fight the COVID-19 pandemic. These systems feature smart fluid management solutions, comprehensive disinfection solutions, convenient and agile mobility, intuitive interface, and flexible battery solutions to help clinicians address diagnostic challenges and make rapid decisions. The ME series is available in Europe and selected countries.
To speak to our analyst for a discussion on the above findings, click Speak to Analyst
TABLE OF CONTENTS
1 INTRODUCTION (Page No. - 29)
1.1 OBJECTIVES OF THE STUDY
1.2 MARKET DEFINITION
1.2.1 INCLUSIONS & EXCLUSIONS
1.3 MARKET SCOPE
1.3.1 MARKETS COVERED
1.3.2 YEARS CONSIDERED FOR THE STUDY
1.4 CURRENCY
1.5 LIMITATIONS
1.6 STAKEHOLDERS
1.7 SUMMARY OF CHANGES
2 RESEARCH METHODOLOGY (Page No. - 35)
2.1 RESEARCH DATA
FIGURE 1 GLOBAL ULTRASOUND MARKET: RESEARCH METHODOLOGY STEPS
FIGURE 2 RESEARCH DESIGN
2.1.1 SECONDARY DATA
2.1.1.1 Key data from secondary sources
2.1.2 PRIMARY DATA
2.1.2.1 Breakdown of primaries
FIGURE 3 BREAKDOWN OF PRIMARY INTERVIEWS: BY COMPANY TYPE, DESIGNATION, AND REGION
2.1.2.2 Key data from primary sources
2.2 MARKET SIZE ESTIMATION
FIGURE 4 RESEARCH METHODOLOGY: HYPOTHESIS BUILDING
2.2.1 VENDOR REVENUE-BASED MARKET ESTIMATION
FIGURE 5 MARKET SIZE ESTIMATION: BOTTOM-UP APPROACH
2.2.2 END USER-BASED MARKET SIZE ESTIMATION
FIGURE 6 ULTRASOUND MARKET: END-USER BASED ESTIMATION
2.2.3 PRIMARY RESEARCH VALIDATION
2.3 MARKET BREAKDOWN AND DATA TRIANGULATION
FIGURE 7 DATA TRIANGULATION METHODOLOGY
2.4 RESEARCH LIMITATIONS
3 EXECUTIVE SUMMARY (Page No. - 46)
FIGURE 8 ULTRASOUND MARKET, BY TECHNOLOGY, 2020 VS. 2025 (USD MILLION)
FIGURE 9 ULTRASOUND MARKET SHARE, BY DEVICE DISPLAY, 2020 VS. 2025
FIGURE 10 ULTRASOUND MARKET, BY SYSTEM PORTABILITY, 2020 VS. 2025 (USD MILLION)
FIGURE 11 ULTRASOUND MARKET SHARE, BY APPLICATION, 2020 VS. 2025 (USD MILLION)
FIGURE 12 ULTRASOUND MARKET SHARE, BY END USER, 2020 VS. 2025
FIGURE 13 GEOGRAPHICAL SNAPSHOT OF THE ULTRASOUND MARKET
4 PREMIUM INSIGHTS (Page No. - 51)
4.1 ULTRASOUND MARKET OVERVIEW
FIGURE 14 TECHNOLOGICAL ADVANCEMENTS AND NEW PRODUCT LAUNCHES DRIVING THE GROWTH OF THE ULTRASOUND MARKET
4.2 EUROPE: ULTRASOUND MARKET, BY TECHNOLOGY, 2020 VS. 2025 (USD MILLION)
FIGURE 15 THERAPEUTIC ULTRASOUND SEGMENT WILL WITNESS HIGH GROWTH DURING THE FORECAST PERIOD
4.3 EUROPE: DIAGNOSTIC ULTRASOUND MARKET, BY TYPE AND COUNTRY
FIGURE 16 GERMANY IS THE LARGEST MARKET FOR DIAGNOSTIC ULTRASOUND IN EUROPE
4.4 ULTRASOUND MARKET, BY APPLICATION, 2020 VS. 2025 (USD MILLION)
FIGURE 17 VASCULAR APPLICATIONS SEGMENT TO REGISTER SUBSTANTIAL GROWTH DURING THE FORECAST PERIOD
4.5 GEOGRAPHIC SNAPSHOT OF THE ULTRASOUND MARKET
FIGURE 18 CHINA TO REGISTER THE HIGHEST GROWTH DURING THE FORECAST PERIOD
5 MARKET OVERVIEW (Page No. - 55)
5.1 INTRODUCTION
5.2 MARKET DYNAMICS
FIGURE 19 ULTRASOUND MARKET: DRIVERS, RESTRAINTS, OPPORTUNITIES, AND CHALLENGES
5.2.1 DRIVERS
5.2.1.1 Increasing prevalence of target diseases
5.2.1.2 Rising patient preference for minimally invasive procedures
5.2.1.3 Technological advancements
TABLE 1 RECENT PRODUCT LAUNCHES IN THE ULTRASOUND MARKET
5.2.1.4 Growing public and private investments, funding, and grants
5.2.1.5 Increasing number of diagnostic centers & hospitals
5.2.2 RESTRAINTS
5.2.2.1 Unfavorable healthcare reforms in the US
5.2.3 OPPORTUNITIES
5.2.3.1 Expanding applications of therapeutic ultrasound
5.2.3.2 Emerging markets
5.2.3.3 Development of POC ultrasound devices
5.2.4 CHALLENGES
5.2.4.1 Growing end-user preference for refurbished equipment
5.2.4.2 Dearth of skilled and well-trained sonographers
5.3 INDUSTRY TRENDS
5.3.1 DEVELOPMENT OF APPLICATION-SPECIFIC ULTRASOUND DEVICES
5.4 PRICING TREND ANALYSIS (2017-2020)
5.4.1 NORTH AMERICA
5.4.2 EUROPE
5.4.3 ASIA PACIFIC
5.4.4 REST OF THE WORLD
5.5 VALUE CHAIN ANALYSIS
FIGURE 20 VALUE CHAIN ANALYSIS: MAXIMUM VALUE ADDED DURING THE MANUFACTURING PHASE
5.6 REGULATORY ANALYSIS
5.6.1 NORTH AMERICA
5.6.1.1 US
TABLE 2 US FDA: MEDICAL DEVICE CLASSIFICATION
TABLE 3 US: MEDICAL DEVICE REGULATORY APPROVAL PROCESS
5.6.1.2 Canada
TABLE 4 CANADA: MEDICAL DEVICE REGULATORY APPROVAL PROCESS
FIGURE 21 CANADA: REGULATORY APPROVAL PROCESS FOR MEDICAL DEVICES
5.6.2 EUROPE
FIGURE 22 EUROPE: REGULATORY APPROVAL PROCESS FOR MEDICAL DEVICES (MDR)
5.6.3 ASIA PACIFIC
5.6.3.1 Japan
TABLE 5 JAPAN: MEDICAL DEVICE CLASSIFICATION UNDER PMDA
5.6.3.2 China
TABLE 6 CHINA: CLASSIFICATION OF MEDICAL DEVICES
5.6.3.3 India
5.7 COVID-19 IMPACT ON THE ULTRASOUND MARKET
6 ULTRASOUND MARKET, BY TECHNOLOGY (Page No. - 75)
6.1 INTRODUCTION
TABLE 7 ULTRASOUND MARKET, BY TECHNOLOGY, 2018-2025 (USD MILLION)
6.2 DIAGNOSTIC ULTRASOUND
TABLE 8 DIAGNOSTIC ULTRASOUND MARKET, BY TYPE, 2018-2025 (USD MILLION)
TABLE 9 DIAGNOSTIC ULTRASOUND MARKET, BY REGION, 2018-2025 (USD MILLION)
6.2.1 DIAGNOSTIC ULTRASOUND MARKET, BY DEVICE DISPLAY, 2018-2025 (USD MILLION)
TABLE 10 DIAGNOSTIC ULTRASOUND MARKET, BY DEVICE DISPLAY, 2018-2025 (USD MILLION)
6.2.2 DIAGNOSTIC ULTRASOUND MARKET, BY SYSTEM PORTABILITY, 2018-2025 (USD MILLION)
TABLE 11 DIAGNOSTIC ULTRASOUND MARKET, BY SYSTEM PORTABILITY, 2018-2025 (USD MILLION)
6.2.3 DIAGNOSTIC ULTRASOUND MARKET, BY APPLICATION, 2018-2025 (USD MILLION)
TABLE 12 DIAGNOSTIC ULTRASOUND MARKET, BY APPLICATION, 2018-2025 (USD MILLION)
6.2.4 DIAGNOSTIC ULTRASOUND MARKET, BY END USER, 2018-2025 (USD MILLION)
TABLE 13 DIAGNOSTIC ULTRASOUND MARKET, BY END USER, 2018-2025 (USD MILLION)
6.2.5 2D ULTRASOUND
6.2.5.1 Strong market demand from less-developed and emerging countries to sustain revenue growth of the segment
TABLE 14 2D ULTRASOUND MARKET, BY REGION, 2018-2025 (USD MILLION)
6.2.5.2 2D Ultrasound Market, by Device Display, 2018-2025 (USD Million)
TABLE 15 2D ULTRASOUND MARKET, BY DEVICE DISPLAY, 2018-2025 (USD MILLION)
6.2.5.3 2D Ultrasound Market, by System Portability, 2018-2025 (USD Million)
TABLE 16 2D ULTRASOUND MARKET, BY SYSTEM PORTABILITY, 2018-2025 (USD MILLION)
6.2.5.4 2D Ultrasound Market, by Application, 2018-2025 (USD Million)
TABLE 17 2D ULTRASOUND MARKET, BY APPLICATION, 2018-2025 (USD MILLION)
6.2.5.5 2D Ultrasound Market, by End User, 2018-2025 (USD Million)
TABLE 18 2D ULTRASOUND MARKET, BY END USER, 2018-2025 (USD MILLION)
6.2.6 3D AND 4D ULTRASOUND
6.2.6.1 Greater diagnostic accuracy and improved imaging capabilities to boost the global market demand for 3D/4D ultrasound
TABLE 19 3D AND 4D ULTRASOUND MARKET, BY REGION, 2018-2025 (USD MILLION)
6.2.6.2 3D and 4D Ultrasound Market, by Device Display, 2018-2025 (USD Million)
TABLE 20 3D AND 4D ULTRASOUND MARKET, BY DEVICE DISPLAY, 2018-2025 (USD MILLION)
6.2.6.3 3D and 4D Ultrasound Market, by System Portability, 2018-2025 (USD Million)
TABLE 21 3D AND 4D ULTRASOUND MARKET, BY SYSTEM PORTABILITY, 2018-2025 (USD MILLION)
6.2.6.4 3D and 4D Ultrasound Market, by Application, 2018-2025 (USD Million)
TABLE 22 3D AND 4D ULTRASOUND MARKET, BY APPLICATION, 2018-2025 (USD MILLION)
6.2.6.5 3D and 4D Ultrasound Market, by End User, 2018-2025 (USD Million)
TABLE 23 3D AND 4D ULTRASOUND MARKET, BY END USER, 2018-2025 (USD MILLION)
6.2.7 DOPPLER ULTRASOUND
6.2.7.1 Growing application in pain management, cardiovascular imaging, and emergency care to drive market growth
TABLE 24 DOPPLER ULTRASOUND MARKET, BY REGION, 2018-2025 (USD MILLION)
6.2.7.2 Doppler Ultrasound Market, by Device Display, 2018-2025 (USD Million)
TABLE 25 DOPPLER ULTRASOUND MARKET, BY DEVICE DISPLAY, 2018-2025 (USD MILLION)
6.2.7.3 Doppler Ultrasound Market, by System Portability, 2018-2025 (USD Million)
TABLE 26 DOPPLER ULTRASOUND MARKET, BY SYSTEM PORTABILITY, 2018-2025 (USD MILLION)
6.2.7.4 Doppler Ultrasound Market, by Application, 2018-2025 (USD Million)
TABLE 27 DOPPLER ULTRASOUND MARKET, BY APPLICATION, 2018-2025 (USD MILLION)
6.2.7.5 Doppler Ultrasound Market, by End User, 2018-2025 (USD Million)
TABLE 28 DOPPLER ULTRASOUND MARKET, BY END USER, 2018-2025 (USD MILLION)
6.3 THERAPEUTIC ULTRASOUND
TABLE 29 THERAPEUTIC ULTRASOUND MARKET, BY TYPE, 2018-2025 (USD MILLION)
TABLE 30 THERAPEUTIC ULTRASOUND MARKET, BY REGION, 2018-2025 (USD MILLION)
6.3.1 THERAPEUTIC ULTRASOUND MARKET, BY DEVICE DISPLAY, 2018-2025 (USD MILLION)
TABLE 31 THERAPEUTIC ULTRASOUND MARKET, BY DEVICE DISPLAY, 2018-2025 (USD MILLION)
6.3.2 THERAPEUTIC ULTRASOUND MARKET, BY SYSTEM PORTABILITY, 2018-2025 (USD MILLION)
TABLE 32 THERAPEUTIC ULTRASOUND MARKET, BY SYSTEM PORTABILITY, 2018-2025 (USD MILLION)
6.3.3 THERAPEUTIC ULTRASOUND MARKET, BY APPLICATION, 2018-2025 (USD MILLION)
TABLE 33 THERAPEUTIC ULTRASOUND MARKET, BY APPLICATION, 2018-2025 (USD MILLION)
6.3.4 THERAPEUTIC ULTRASOUND MARKET, BY END USER, 2018-2025 (USD MILLION)
TABLE 34 THERAPEUTIC ULTRASOUND MARKET, BY END USER, 2018-2025 (USD MILLION)
6.3.5 EXTRACORPOREAL SHOCKWAVE LITHOTRIPSY
6.3.5.1 Growing emphasis on the minimally invasive treatment of kidney and gall bladder stones to drive the demand for ESWL
TABLE 35 EXTRACORPOREAL SHOCKWAVE LITHOTRIPSY MARKET, BY REGION, 2018-2025 (USD MILLION)
6.3.5.2 Extracorporeal Shockwave Lithotripsy Market, by Device Display, 2018-2025 (USD Million)
TABLE 36 EXTRACORPOREAL SHOCKWAVE LITHOTRIPSY MARKET, BY DEVICE DISPLAY, 2018-2025 (USD MILLION)
6.3.5.3 Extracorporeal Shockwave Lithotripsy Market, by System Portability, 2018-2025 (USD Million)
TABLE 37 EXTRACORPOREAL SHOCKWAVE LITHOTRIPSY MARKET, BY SYSTEM PORTABILITY, 2018-2025 (USD MILLION)
6.3.5.4 Extracorporeal Shockwave Lithotripsy Market, by Application, 2018-2025 (USD Million)
TABLE 38 EXTRACORPOREAL SHOCKWAVE LITHOTRIPSY MARKET, BY APPLICATION, 2018-2025 (USD MILLION)
6.3.5.5 Extracorporeal Shockwave Lithotripsy Market, by End User, 2018-2025 (USD Million)
TABLE 39 EXTRACORPOREAL SHOCKWAVE LITHOTRIPSY MARKET, BY END USER, 2018-2025 (USD MILLION)
6.3.6 HIGH-INTENSITY FOCUSED ULTRASOUND
6.3.6.1 Promising results associated with HIFU for the treatment of various cancers to drive market growth
TABLE 40 HIGH-INTENSITY FOCUSED ULTRASOUND MARKET, BY REGION, 2018-2025 (USD MILLION)
6.3.6.2 High-intensity Focused Ultrasound Market, by Device Display, 2018-2025 (USD Million)
TABLE 41 HIGH-INTENSITY FOCUSED ULTRASOUND MARKET, BY DEVICE DISPLAY, 2018-2025 (USD MILLION)
6.3.6.3 High-intensity Focused Ultrasound Market, by System Portability, 2018-2025 (USD Million)
TABLE 42 HIGH-INTENSITY FOCUSED ULTRASOUND MARKET, BY SYSTEM PORTABILITY, 2018-2025 (USD MILLION)
6.3.6.4 High-intensity Focused Ultrasound Market, by Application, 2018-2025 (USD Million)
TABLE 43 HIGH-INTENSITY FOCUSED ULTRASOUND MARKET, BY APPLICATION, 2018-2025 (USD MILLION)
6.3.6.5 High-intensity Focused Ultrasound Market, by End User, 2018-2025 (USD Million)
TABLE 44 HIGH-INTENSITY FOCUSED ULTRASOUND MARKET, BY END USER, 2018-2025 (USD MILLION)
7 ULTRASOUND MARKET, BY DEVICE DISPLAY (Page No. - 97)
7.1 INTRODUCTION
TABLE 45 ULTRASOUND MARKET, BY DEVICE DISPLAY, 2018-2025 (USD MILLION)
TABLE 46 ULTRASOUND MARKET, BY DEVICE DISPLAY, 2018-2025 (ANNUAL UNIT SALES)
7.2 COLOR ULTRASOUND DEVICES
7.2.1 GREATER MARKET AVAILABILITY OF ADVANCED COLOR ULTRASOUND DEVICES TO DRIVE THE MARKET TILL 2025
TABLE 47 COLOR ULTRASOUND DEVICES MARKET, BY REGION, 2018-2025 (USD MILLION)
TABLE 48 COLOR ULTRASOUND DEVICES MARKET, BY REGION, 2018-2025 (ANNUAL UNIT SALES)
7.3 BLACK & WHITE ULTRASOUND DEVICES
7.3.1 ASIA PACIFIC REGION TO REGISTER SUSTAINED DEMAND FOR B/W ULTRASOUND DEVICES
TABLE 49 BLACK & WHITE ULTRASOUND DEVICES MARKET, BY REGION, 2018-2025 (USD MILLION)
TABLE 50 BLACK & WHITE ULTRASOUND DEVICES MARKET, BY REGION, 2018-2025 (ANNUAL UNIT SALES)
8 ULTRASOUND MARKET, BY SYSTEM PORTABILITY (Page No. - 102)
8.1 INTRODUCTION
TABLE 51 ULTRASOUND MARKET, BY SYSTEM PORTABILITY, 2018-2025 (USD MILLION)
TABLE 52 ULTRASOUND MARKET, BY SYSTEM PORTABILITY, 2018-2025 (ANNUAL UNIT SALES)
8.2 TROLLEY/CART-BASED DEVICES
8.2.1 INCREASED USAGE OF TROLLEY-BASED SYSTEMS FOR ACUTE CARE & EMERGENCY CARE TO DRIVE MARKET GROWTH
TABLE 53 ULTRASOUND MARKET FOR TROLLEY/CART-BASED DEVICES, BY REGION, 2018-2025 (USD MILLION)
TABLE 54 ULTRASOUND MARKET FOR TROLLEY/CART-BASED DEVICES, BY REGION, 2018-2025 (ANNUAL UNIT SALES)
8.3 COMPACT/TABLE-TOP DEVICES
8.3.1 DEVICE AFFORDABILITY AS WELL AS PROCEDURAL & TECHNICAL BENEFITS OFFERED BY TABLE-TOP DEVICES TO DRIVE MARKET GROWTH
TABLE 55 ULTRASOUND MARKET FOR COMPACT/TABLE-TOP DEVICES, BY REGION, 2018-2025 (USD MILLION)
TABLE 56 ULTRASOUND MARKET FOR COMPACT/TABLE-TOP DEVICES, BY REGION, 2018-2025 (ANNUAL UNIT SALES)
8.4 POC/PORTABLE DEVICES
8.4.1 IMPROVED OPERATIONAL AND CLINICAL EFFICACY TO BOOST THE DEMAND FOR POC ULTRASOUND DEVICES
TABLE 57 ULTRASOUND MARKET FOR POC/PORTABLE DEVICES, BY REGION, 2018-2025 (USD MILLION)
TABLE 58 ULTRASOUND MARKET FOR POC/PORTABLE DEVICES, BY REGION, 2018-2025 (ANNUAL UNIT SALES)
9 ULTRASOUND MARKET, BY APPLICATION (Page No. - 109)
9.1 INTRODUCTION
TABLE 59 ULTRASOUND MARKET, BY APPLICATION, 2018-2025 (USD MILLION)
9.2 RADIOLOGY/GENERAL IMAGING APPLICATIONS
9.2.1 GROWING NUMBER OF IMAGE-GUIDED SURGERIES/RADIOLOGY PROCEDURES TO DRIVE THIS APPLICATION SEGMENT
TABLE 60 ULTRASOUND MARKET FOR RADIOLOGY/GENERAL IMAGING APPLICATIONS, BY REGION, 2018-2025 (USD MILLION)
9.3 CARDIOLOGY APPLICATIONS
9.3.1 RISING PREVALENCE OF CARDIAC DISORDERS ACROSS MAJOR HEALTHCARE MARKETS TO DRIVE THIS APPLICATION SEGMENT
TABLE 61 ULTRASOUND MARKET FOR CARDIOLOGY APPLICATIONS, BY REGION, 2018-2025 (USD MILLION)
9.4 OBSTETRICS/GYNECOLOGY APPLICATIONS
9.4.1 ULTRASOUND IS WIDELY USED IN THE FIELD OF OBSTETRICS AND GYNECOLOGY
TABLE 62 ULTRASOUND MARKET FOR OBSTETRICS/GYNECOLOGY APPLICATIONS, BY REGION, 2018-2025 (USD MILLION)
9.5 VASCULAR APPLICATIONS
9.5.1 VASCULAR APPLICATIONS SEGMENT TO WITNESS THE HIGHEST GROWTH DURING THE FORECAST PERIOD
TABLE 63 ULTRASOUND MARKET FOR VASCULAR APPLICATIONS, BY REGION, 2018-2025 (USD MILLION)
9.6 UROLOGICAL APPLICATIONS
9.6.1 ULTRASOUND IS WIDELY USED IN THE DIAGNOSIS AND TREATMENT OF VARIOUS UROLOGICAL DISORDERS
TABLE 64 ULTRASOUND MARKET FOR UROLOGICAL APPLICATIONS, BY REGION, 2018-2025 (USD MILLION)
9.7 ORTHOPEDIC AND MUSCULOSKELETAL APPLICATIONS
9.7.1 RISING PATIENT PREFERENCE FOR EFFECTIVE & EARLY DISEASE DIAGNOSIS TO DRIVE THE GROWTH OF THIS APPLICATION SEGMENT
TABLE 65 ULTRASOUND MARKET FOR ORTHOPEDIC AND MUSCULOSKELETAL APPLICATIONS, BY REGION, 2018-2025 (USD MILLION)
9.8 PAIN MANAGEMENT APPLICATIONS
9.8.1 ULTRASOUND DEVICES ARE INCREASINGLY BEING UTILIZED FOR TRAUMA & EMERGENCY CARE APPLICATIONS
TABLE 66 ULTRASOUND MARKET FOR PAIN MANAGEMENT APPLICATIONS, BY REGION, 2018-2025 (USD MILLION)
9.9 OTHER APPLICATIONS
TABLE 67 ULTRASOUND MARKET FOR OTHER APPLICATIONS, BY REGION, 2018-2025 (USD MILLION)
10 ULTRASOUND MARKET, BY END USER (Page No. - 118)
10.1 INTRODUCTION
TABLE 68 ULTRASOUND MARKET, BY END USER, 2018-2025 (USD MILLION)
10.2 HOSPITALS, SURGICAL CENTERS, AND DIAGNOSTIC CENTERS
10.2.1 SIGNIFICANT NUMBER OF ULTRASOUND-BASED MEDICAL PROCEDURES ARE PERFORMED IN THESE FACILITIES
TABLE 69 ULTRASOUND MARKET FOR HOSPITALS, SURGICAL CENTERS, AND DIAGNOSTIC CENTERS, BY REGION, 2018-2025 (USD MILLION)
10.3 MATERNITY CENTERS
10.3.1 INCREASED ADOPTION OF ADVANCED 3D, 4D, AND DOPPLER ULTRASOUND FOR OB/GYN APPLICATIONS WILL DRIVE MARKET GROWTH
TABLE 70 ULTRASOUND MARKET FOR MATERNITY CENTERS, BY REGION, 2018-2025 (USD MILLION) 121
10.4 AMBULATORY CARE CENTERS
10.4.1 INCREASING NUMBER OF MINIMALLY INVASIVE AND EMERGENCY PROCEDURES PERFORMED AT AMBULATORY CARE CENTERS TO SUPPORT MARKET GROWTH
TABLE 71 ULTRASOUND MARKET FOR AMBULATORY CARE CENTERS, BY REGION, 2018-2025 (USD MILLION)
10.5 RESEARCH AND ACADEMIA
10.5.1 GROWING RESEARCH GRANTS AND FUNDING TO DRIVE THE GROWTH OF THIS END-USER SEGMENT
TABLE 72 ULTRASOUND MARKET FOR RESEARCH AND ACADEMIA, BY REGION, 2018-2025 (USD MILLION)
10.6 OTHER END USERS
TABLE 73 ULTRASOUND MARKET FOR OTHER END USERS, BY REGION, 2018-2025 (USD MILLION)
11 ULTRASOUND MARKET, BY REGION (Page No. - 125)
11.1 INTRODUCTION
TABLE 74 ULTRASOUND MARKET, BY REGION, 2018-2025 (USD MILLION)
11.2 EUROPE
FIGURE 23 EUROPE: ULTRASOUND MARKET SNAPSHOT
TABLE 75 EUROPE: ULTRASOUND MARKET, BY COUNTRY, 2018-2025 (USD MILLION)
TABLE 76 EUROPE: ULTRASOUND MARKET, BY TECHNOLOGY, 2018-2025 (USD MILLION)
TABLE 77 EUROPE: DIAGNOSTIC ULTRASOUND MARKET, BY TYPE, 2018-2025 (USD MILLION)
TABLE 78 EUROPE: THERAPEUTIC ULTRASOUND MARKET, BY TYPE, 2018-2025 (USD MILLION)
TABLE 79 EUROPE: ULTRASOUND MARKET, BY DEVICE DISPLAY, 2018-2025 (USD MILLION)
TABLE 80 EUROPE: ULTRASOUND MARKET, BY SYSTEM PORTABILITY, 2018-2025 (USD MILLION)
TABLE 81 EUROPE: ULTRASOUND MARKET, BY APPLICATION, 2018-2025 (USD MILLION)
TABLE 82 EUROPE: ULTRASOUND MARKET, BY END USER, 2018-2025 (USD MILLION)
11.2.1 GERMANY
11.2.1.1 Wide acceptance of advanced technologies and favorable reimbursement scenario to drive market growth
TABLE 83 GERMANY: ULTRASOUND MARKET, BY TECHNOLOGY, 2018-2025 (USD MILLION)
TABLE 84 GERMANY: DIAGNOSTIC ULTRASOUND MARKET, BY TYPE, 2018-2025 (USD MILLION)
TABLE 85 GERMANY: THERAPEUTIC ULTRASOUND MARKET, BY TYPE, 2018-2025 (USD MILLION)
11.2.2 UK
11.2.2.1 Rising geriatric population to support market growth in the UK
TABLE 86 UK: ULTRASOUND MARKET, BY TECHNOLOGY, 2018-2025 (USD MILLION)
TABLE 87 UK: DIAGNOSTIC ULTRASOUND MARKET, BY TYPE, 2018-2025 (USD MILLION)
TABLE 88 UK: THERAPEUTIC ULTRASOUND MARKET, BY TYPE, 2018-2025 (USD MILLION)
11.2.3 FRANCE
11.2.3.1 Modernization of healthcare infrastructure fueling the demand for ultrasound systems
TABLE 89 FRANCE: ULTRASOUND MARKET, BY TECHNOLOGY, 2018-2025 (USD MILLION)
TABLE 90 FRANCE: DIAGNOSTIC ULTRASOUND MARKET, BY TYPE, 2018-2025 (USD MILLION)
TABLE 91 FRANCE: THERAPEUTIC ULTRASOUND MARKET, BY TYPE, 2018-2025 (USD MILLION)
11.2.4 ITALY
11.2.4.1 Improved reimbursement scenario and increasing R&D to support overall market growth
TABLE 92 ITALY: ULTRASOUND MARKET, BY TECHNOLOGY, 2018-2025 (USD MILLION)
TABLE 93 ITALY: DIAGNOSTIC ULTRASOUND MARKET, BY TYPE, 2018-2025 (USD MILLION)
TABLE 94 ITALY: THERAPEUTIC ULTRASOUND MARKET, BY TYPE, 2018-2025 (USD MILLION)
11.2.5 SPAIN
11.2.5.1 Low entry barriers to create opportunities for global players to expand their presence in the country
TABLE 95 SPAIN: ULTRASOUND MARKET, BY TECHNOLOGY, 2018-2025 (USD MILLION)
TABLE 96 SPAIN: DIAGNOSTIC ULTRASOUND MARKET, BY TYPE, 2018-2025 (USD MILLION)
TABLE 97 SPAIN: THERAPEUTIC ULTRASOUND MARKET, BY TYPE, 2018-2025 (USD MILLION)
11.2.6 REST OF EUROPE
TABLE 98 REST OF EUROPE: ULTRASOUND MARKET, BY TECHNOLOGY, 2018-2025 (USD MILLION)
TABLE 99 REST OF EUROPE: DIAGNOSTIC ULTRASOUND MARKET, BY TYPE, 2018-2025 (USD MILLION)
TABLE 100 REST OF EUROPE: THERAPEUTIC ULTRASOUND MARKET, BY TYPE, 2018-2025 (USD MILLION)
11.3 NORTH AMERICA
TABLE 101 NORTH AMERICA: ULTRASOUND MARKET, BY COUNTRY, 2018-2025 (USD MILLION)
TABLE 102 NORTH AMERICA: ULTRASOUND MARKET, BY TECHNOLOGY, 2018-2025 (USD MILLION)
TABLE 103 NORTH AMERICA: DIAGNOSTIC ULTRASOUND MARKET, BY TYPE, 2018-2025 (USD MILLION)
TABLE 104 NORTH AMERICA: THERAPEUTIC ULTRASOUND MARKET, BY TYPE, 2018-2025 (USD MILLION)
TABLE 105 NORTH AMERICA: ULTRASOUND MARKET, BY DEVICE DISPLAY, 2018-2025 (USD MILLION)
TABLE 106 NORTH AMERICA: ULTRASOUND MARKET, BY SYSTEM PORTABILITY, 2018-2025 (USD MILLION)
TABLE 107 NORTH AMERICA: ULTRASOUND MARKET, BY APPLICATION, 2018-2025 (USD MILLION)
TABLE 108 NORTH AMERICA: ULTRASOUND MARKET, BY END USER, 2018-2025 (USD MILLION)
11.3.1 US
11.3.1.1 US dominated the North American ultrasound market
TABLE 109 ULTRASOUND CPT CODES (2019)
TABLE 110 US: ULTRASOUND MARKET, BY TECHNOLOGY, 2018-2025 (USD MILLION)
TABLE 111 US: DIAGNOSTIC ULTRASOUND MARKET, BY TYPE, 2018-2025 (USD MILLION)
TABLE 112 US: THERAPEUTIC ULTRASOUND MARKET, BY TYPE, 2018-2025 (USD MILLION)
11.3.2 CANADA
11.3.2.1 Growing awareness about early disease diagnosis to drive market growth in Canada
TABLE 113 CANADA: ULTRASOUND MARKET, BY TECHNOLOGY, 2018-2025 (USD MILLION)
TABLE 114 CANADA: DIAGNOSTIC ULTRASOUND MARKET, BY TYPE, 2018-2025 (USD MILLION)
TABLE 115 CANADA: THERAPEUTIC ULTRASOUND MARKET, BY TYPE, 2018-2025 (USD MILLION)
11.4 ASIA PACIFIC
FIGURE 24 ASIA PACIFIC: ULTRASOUND MARKET SNAPSHOT
TABLE 116 ASIA PACIFIC: ULTRASOUND MARKET, BY COUNTRY, 2018-2025 (USD MILLION)
TABLE 117 ASIA PACIFIC: ULTRASOUND MARKET, BY TECHNOLOGY, 2018-2025 (USD MILLION)
TABLE 118 ASIA PACIFIC: DIAGNOSTIC ULTRASOUND MARKET, BY TYPE, 2018-2025 (USD MILLION)
TABLE 119 ASIA PACIFIC: THERAPEUTIC ULTRASOUND MARKET, BY TYPE, 2018-2025 (USD MILLION)
TABLE 120 ASIA PACIFIC: ULTRASOUND MARKET, BY DEVICE DISPLAY, 2018-2025 (USD MILLION)
TABLE 121 ASIA PACIFIC: ULTRASOUND MARKET, BY SYSTEM PORTABILITY, 2018-2025 (USD MILLION)
TABLE 122 ASIA PACIFIC: ULTRASOUND MARKET, BY APPLICATION, 2018-2025 (USD MILLION)
TABLE 123 ASIA PACIFIC: ULTRASOUND MARKET, BY END USER, 2018-2025 (USD MILLION)
11.4.1 CHINA
11.4.1.1 Increasing patient pool coupled with localized manufacturing to drive the market growth
TABLE 124 CHINA: ULTRASOUND MARKET, BY TECHNOLOGY, 2018-2025 (USD MILLION)
TABLE 125 CHINA: DIAGNOSTIC ULTRASOUND MARKET, BY TYPE, 2018-2025 (USD MILLION)
TABLE 126 CHINA: THERAPEUTIC ULTRASOUND MARKET, BY TYPE, 2018-2025 (USD MILLION)
11.4.2 JAPAN
11.4.2.1 Rising geriatric population to boost market growth in Japan
TABLE 127 JAPAN: ULTRASOUND MARKET, BY TECHNOLOGY, 2018-2025 (USD MILLION)
TABLE 128 JAPAN: DIAGNOSTIC ULTRASOUND MARKET, BY TYPE, 2018-2025 (USD MILLION)
TABLE 129 JAPAN: THERAPEUTIC ULTRASOUND MARKET, BY TYPE, 2018-2025 (USD MILLION)
11.4.3 INDIA
11.4.3.1 Significant burden of target diseases and availability of affordable devices to drive market growth
TABLE 130 INDIA: ULTRASOUND MARKET, BY TECHNOLOGY, 2018-2025 (USD MILLION)
TABLE 131 INDIA: DIAGNOSTIC ULTRASOUND MARKET, BY TYPE, 2018-2025 (USD MILLION)
TABLE 132 INDIA: THERAPEUTIC ULTRASOUND MARKET, BY TYPE, 2018-2025 (USD MILLION)
11.4.4 SOUTH KOREA
11.4.4.1 Supportive government initiatives in the country to positively impact market growth
TABLE 133 SOUTH KOREA: ULTRASOUND MARKET, BY TECHNOLOGY, 2018-2025 (USD MILLION)
TABLE 134 SOUTH KOREA: DIAGNOSTIC ULTRASOUND MARKET, BY TYPE, 2018-2025 (USD MILLION)
TABLE 135 SOUTH KOREA: THERAPEUTIC ULTRASOUND MARKET, BY TYPE, 2018-2025 (USD MILLION)
11.4.5 AUSTRALIA
11.4.5.1 Rising research investments and awareness campaigns are the key factors supporting market growth
TABLE 136 AUSTRALIA: ULTRASOUND MARKET, BY TECHNOLOGY, 2018-2025 (USD MILLION)
TABLE 137 AUSTRALIA: DIAGNOSTIC ULTRASOUND MARKET, BY TYPE, 2018-2025 (USD MILLION)
TABLE 138 AUSTRALIA: THERAPEUTIC ULTRASOUND MARKET, BY TYPE, 2018-2025 (USD MILLION)
11.4.6 REST OF ASIA PACIFIC
TABLE 139 ROAPAC: ULTRASOUND MARKET, BY TECHNOLOGY, 2018-2025 (USD MILLION)
TABLE 140 ROAPAC: DIAGNOSTIC ULTRASOUND MARKET, BY TYPE, 2018-2025 (USD MILLION)
TABLE 141 ROAPAC: THERAPEUTIC ULTRASOUND MARKET, BY TYPE, 2018-2025 (USD MILLION)
11.5 LATIN AMERICA
TABLE 142 LATIN AMERICA: ULTRASOUND MARKET, BY COUNTRY, 2018-2025 (USD MILLION)
TABLE 143 LATIN AMERICA: ULTRASOUND MARKET, BY TECHNOLOGY, 2018-2025 (USD MILLION)
TABLE 144 LATIN AMERICA: DIAGNOSTIC ULTRASOUND MARKET, BY TYPE, 2018-2025 (USD MILLION)
TABLE 145 LATIN AMERICA: THERAPEUTIC ULTRASOUND MARKET, BY TYPE, 2018-2025 (USD MILLION)
TABLE 146 LATIN AMERICA: ULTRASOUND MARKET, BY DEVICE DISPLAY, 2018-2025 (USD MILLION)
TABLE 147 LATIN AMERICA: ULTRASOUND MARKET, BY SYSTEM PORTABILITY, 2018-2025 (USD MILLION)
TABLE 148 LATIN AMERICA: ULTRASOUND MARKET, BY APPLICATION, 2018-2025 (USD MILLION)
TABLE 149 LATIN AMERICA: ULTRASOUND MARKET, BY END USER, 2018-2025 (USD MILLION)
11.5.1 BRAZIL
11.5.1.1 Universal healthcare system to play a pivotal role in driving the use of ultrasound for disease diagnosis
TABLE 150 BRAZIL: ULTRASOUND MARKET, BY TECHNOLOGY, 2018-2025 (USD MILLION)
TABLE 151 BRAZIL: DIAGNOSTIC ULTRASOUND MARKET, BY TYPE, 2018-2025 (USD MILLION)
TABLE 152 BRAZIL: THERAPEUTIC ULTRASOUND MARKET, BY TYPE, 2018-2025 (USD MILLION)
11.5.2 MEXICO
11.5.2.1 Modernization of healthcare infrastructure to support market growth
TABLE 153 MEXICO: ULTRASOUND MARKET, BY TECHNOLOGY, 2018-2025 (USD MILLION)
TABLE 154 MEXICO: DIAGNOSTIC ULTRASOUND MARKET, BY TYPE, 2018-2025 (USD MILLION)
TABLE 155 MEXICO: THERAPEUTIC ULTRASOUND MARKET, BY TYPE, 2018-2025 (USD MILLION)
11.5.3 REST OF LATIN AMERICA
TABLE 156 ROLA: ULTRASOUND MARKET, BY TECHNOLOGY, 2018-2025 (USD MILLION)
TABLE 157 ROLA: DIAGNOSTIC ULTRASOUND MARKET, BY TYPE, 2018-2025 (USD MILLION)
TABLE 158 ROLA: THERAPEUTIC ULTRASOUND MARKET, BY TYPE, 2018-2025 (USD MILLION)
11.6 MIDDLE EAST & AFRICA
11.6.1 IMPROVING HEALTHCARE INFRASTRUCTURE AND INCREASING PUBLIC-PRIVATE INVESTMENTS TO DRIVE MARKET GROWTH IN THE MEA REGION
TABLE 159 MEA: ULTRASOUND MARKET, BY TECHNOLOGY, 2018-2025 (USD MILLION)
TABLE 160 MEA: DIAGNOSTIC ULTRASOUND MARKET, BY TYPE, 2018-2025 (USD MILLION)
TABLE 161 MEA: THERAPEUTIC ULTRASOUND MARKET, BY TYPE, 2018-2025 (USD MILLION)
TABLE 162 MEA: ULTRASOUND MARKET, BY DEVICE DISPLAY, 2018-2025 (USD MILLION)
TABLE 163 MEA: ULTRASOUND MARKET, BY SYSTEM PORTABILITY, 2018-2025 (USD MILLION)
TABLE 164 MEA: ULTRASOUND MARKET, BY APPLICATION, 2018-2025 (USD MILLION)
TABLE 165 MEA: ULTRASOUND MARKET, BY END USER, 2018-2025 (USD MILLION)
12 COMPETITIVE LANDSCAPE (Page No. - 173)
12.1 INTRODUCTION
12.2 MARKET SHARE ANALYSIS
FIGURE 25 GLOBAL ULTRASOUND MARKET SHARE, BY KEY PLAYER, 2019
12.3 COMPETITIVE SCENARIO
12.3.1 PRODUCT LAUNCHES AND APPROVALS
12.3.2 ACQUISITIONS
12.3.3 PARTNERSHIPS AND AGREEMENTS
12.3.4 EXPANSIONS
13 COMPANY EVOLUTION MATRIX AND COMPANY PROFILES (Page No. - 178)
13.1 COMPETITIVE EVOLUTION MATRIX AND METHODOLOGY
13.1.1 COMPETITIVE LEADERSHIP MAPPING: MAJOR MARKET PLAYERS (2019)
13.1.1.1 Visionary leaders
13.1.1.2 Innovators
13.1.1.3 Dynamic differentiators
13.1.1.4 Emerging companies
FIGURE 26 ULTRASOUND MARKET: GLOBAL COMPETITIVE LEADERSHIP MAPPING, 2019 (OVERALL MARKET)
13.1.2 COMPETITIVE LEADERSHIP MAPPING: EMERGING COMPANIES/SMES/START-UPS (2019)
13.1.2.1 Progressive companies
13.1.2.2 Starting blocks
13.1.2.3 Responsive companies
13.1.2.4 Dynamic companies
FIGURE 27 ULTRASOUND MARKET: GLOBAL COMPETITIVE LEADERSHIP MAPPING, 2019 (SME/START-UPS)
13.2 COMPANY PROFILES
(Business overview, Products offered, Recent developments, MNM view)*
13.2.1 GE HEALTHCARE
FIGURE 28 GE HEALTHCARE: COMPANY SNAPSHOT
13.2.2 KONINKLIJKE PHILIPS N.V.
FIGURE 29 KONINKLIJKE PHILIPS N.V.: COMPANY SNAPSHOT
13.2.3 CANON MEDICAL SYSTEMS CORPORATION
FIGURE 30 CANON MEDICAL SYSTEMS CORPORATION: COMPANY SNAPSHOT
13.2.4 HITACHI, LTD.
FIGURE 31 HITACHI, LTD.: COMPANY SNAPSHOT
13.2.5 SIEMENS HEALTHINEERS AG
FIGURE 32 SIEMENS HEALTHINEERS AG: COMPANY SNAPSHOT
13.2.6 HOLOGIC, INC.
FIGURE 33 HOLOGIC, INC.: COMPANY SNAPSHOT
13.2.7 FUJIFILM HOLDINGS CORPORATION
FIGURE 34 FUJIFILM HOLDINGS CORPORATION: COMPANY SNAPSHOT
13.2.8 SAMSUNG ELECTRONICS CO., LTD.
FIGURE 35 SAMSUNG ELECTRONICS CO., LTD.: COMPANY SNAPSHOT
13.2.9 MINDRAY MEDICAL INTERNATIONAL LIMITED
13.2.10 ANALOGIC CORPORATION
13.2.11 ESAOTE SPA
13.2.12 SHIMADZU CORPORATION
FIGURE 36 SHIMADZU CORPORATION: COMPANY SNAPSHOT
13.2.13 CARESTREAM HEALTH
FIGURE 37 ONEX CORPORATION: COMPANY SNAPSHOT
13.2.14 CURA HEALTHCARE
13.2.15 CHISON MEDICAL TECHNOLOGIES CO., LTD.
*Business overview, Products offered, Recent developments, MNM view might not be captured in case of unlisted companies.
13.2.16 OTHER COMPANIES
13.2.16.1 Mobisante, Inc.
13.2.16.2 Neusoft Corporation
13.2.16.3 Clarius Mobile Health
13.2.16.4 Medgyn Products, Inc.
13.2.16.5 United Imaging Healthcare Co., Ltd.
14 APPENDIX (Page No. - 224)
14.1 DISCUSSION GUIDE
14.2 KNOWLEDGE STORE: MARKETSANDMARKETS' SUBSCRIPTION PORTAL
14.3 AVAILABLE CUSTOMIZATIONS
14.4 RELATED REPORTS
14.5 AUTHOR DETAILS
This study involved the extensive use of both primary and secondary sources. The research process involved the study of various factors affecting the industry to identify the segmentation types, industry trends, key players, competitive landscape, fundamental market dynamics, and key player strategies.
The secondary research process involves the widespread use of secondary sources, directories, databases (such as Bloomberg Businessweek, Factiva, and D&B), white papers, annual reports, companies house documents, investor presentations, and SEC filings of companies. Secondary research was used to identify and collect information useful for the extensive, technical, market-oriented, and commercial study of the ultrasound market. A database of the key industry leaders was also prepared using secondary research.
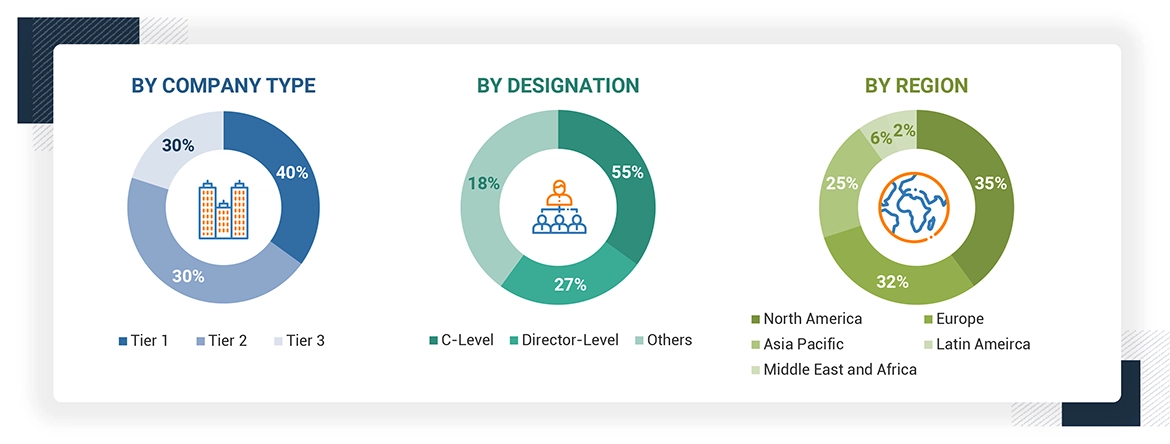
Primary research was conducted after acquiring extensive knowledge about the global ultrasound market scenario through secondary research. Primary interviews were conducted with market experts from both the demand-side (such as diagnostic centers, doctors, professors, and hospitals) and supply-side respondents (such as ultrasound device manufacturers and distributors) across five major geographies, namely, North America, Europe, the Asia Pacific, Latin America, and Middle East, and Africa. Approximately 60% of the primary interviews were conducted with stakeholders from the demand side while those from the supply side accounted for the remaining 40%. Primary data for this report was collected through questionnaires, emails, and telephonic interviews.
A breakdown of the primary respondents is provided below:
To know about the assumptions considered for the study, download the pdf brochure
A detailed market estimation approach was followed to estimate and validate the size of the global ultrasound market and other dependent submarkets.
The above-mentioned data was consolidated and added with detailed inputs and analysis from MarketsandMarkets and presented in this report.
To know about the assumptions considered for the study, Request for Free Sample Report
After deriving the overall ultrasound market value data from the market size estimation process, the total market value data was split into several segments and subsegments. To complete the overall market engineering process and arrive at the exact statistics for all the segments, data triangulation and market breakdown procedures were employed wherever applicable. The data was triangulated by studying various qualitative and quantitative variables as well as by analyzing regional trends for both the demand- and supply-side macroindicators.
With the given market data, MarketsandMarkets offers customizations as per the company’s specific needs. The following customization options are available for the present global ultrasound market report:
Benchmarking the rapid strategy shifts of the Top 100 companies in the Ultrasound Market
Request For Special Pricing
Growth opportunities and latent adjacency in Ultrasound Market
Ultrasound is used in many ways according to technology