Accountable Care Solutions Market by Product & Service (EHR, Healthcare Analytics, HIE, RCM, CDSS, Population Health, Claims Management, Care Management), Delivery mode (On-Premise, Web & Cloud), End User (Provider & Payer)- Global Forecast to 2022


The global accountable care solutions market size is projected to grow at a CAGR of 16.6%. The healthcare industry is undergoing a major transformation as a result of the growing pressure to provide more cost-effective personalized care. The push towards predictable outcomes and higher quality of care is resulting in the convergence of information technologies. In this regard, accountable care solutions facilitate innovation and coordination, and help improve the cost-efficacy, quality, and safety of medical care delivery systems. Furthermore, these solutions help in maintaining patient-provider communications, clinical data repositories, HIE interoperability, terminology mapping and EHR integration, and patient engagement.
Market Dynamics
Drivers
- Implementation of government regulations and initiatives to promote patient-centric care
- Implementation of incentives to shift the burden of risk from healthcare payers to providers
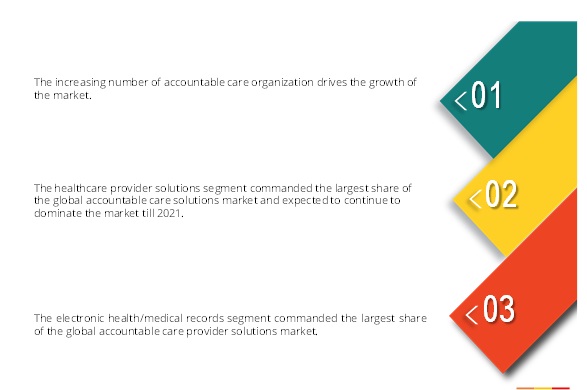
- Increasing number of accountable care organizations
- Rising need to curtail healthcare costs
- Advancing It and Big Data Capabilities
- Rising Geriatric Population and Subsequent Growth in the Burden of Chronic Diseases
Restraints
- Lack of interoperability
- High investments required for supporting infrastructure
- Data security concerns
Opportunities
- Increasing focus on value-based medicine
- Emerging markets
- Growing adoption of cloud-based models
Challenges
- Reluctance of providers to adopt accountable care solutions
- Lower reimbursement rates within the value-based care model
Increasing number of accountable care organizations drives the global accountable care solutions market
There has been a steady rise in the number of ACOs in the US since 2010. In 2015, the total number of private and Medicare ACOs exceeded 700, covering ~20 million Americans (Source: Department of Healthcare Policy and Research). In addition, according to the CMS, the number of ACOs has been growing by about 100 organizations each year. According to the Centers for Medicare & Medicaid Services (CMS), the number of ACOs participating in Medicare programs is now 477. This includes 21 NGACOs, 434 MSSP ACOs, 9 Pioneer ACOs, and 13 Comprehensive ESRD Care Model (CEC) ACOs. Medicare ACOs are now responsible for 8.9 million beneficiaries, up from 7.3 million in April 2015. Approximately 180,000 physicians and practitioners are now involved in Medicare ACOs. To achieve their specific standards, ACOs are increasingly adopting accountable care solutions.
The following are the major objectives of the study.
- To define, describe, and forecast the global accountable care solutions market on the basis of product & service, delivery mode, and end user
- To provide detailed information regarding the major factors influencing the growth market (drivers, restraints, opportunities, and industry-specific challenges)
- To strategically analyze micromarkets1 with respect to the individual growth trends, future prospects, and contributions to the overall market
- To analyze the opportunities in the market for stakeholders and provide details of the competitive landscape for market leaders
- To forecast the size of the market segments with respect to four main regions, namely, North America, Europe, Asia-Pacific, and the Rest of the World, along with major countries in these regions
- To strategically profile the key players and comprehensively analyze their market shares and core competencies in the accountable care solutions market
- To track and analyze competitive developments such as partnerships, agreements, collaborations, alliances, mergers and acquisitions, new product developments, geographical expansions, and research and development activities in the global accountable care solutions market
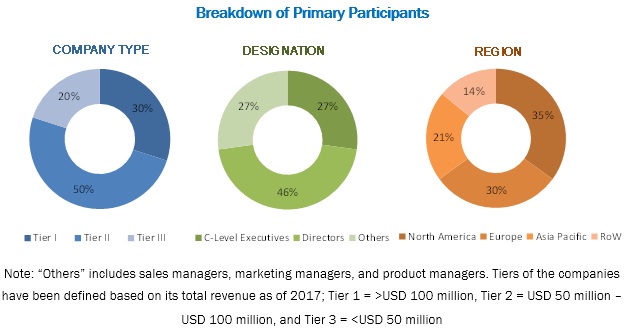
During this research study, major players operating in the accountable care solutions markets in various regions have been identified, and their offerings, regional presence, and distribution channels have been analyzed through in-depth discussions. Top-down and bottom-up approaches have been used to determine the overall market size. Sizes of the other individual markets have been estimated using the percentage splits obtained through secondary sources such as Hoovers, Bloomberg BusinessWeek, and Factiva, along with primary respondents. The entire procedure includes the study of the annual and financial reports of the top market players and extensive interviews with industry experts such as CEOs, VPs, directors, and marketing executives for key insights (both qualitative and quantitative) pertaining to the market. The figure below shows the breakdown of the primaries on the basis of the company type, designation, and region considered during the research study.
To know about the assumptions considered for the study, download the pdf brochure
The accountable care solutions markets comprises a network of market players involved in product launches; agreements, partnerships, collaborations, and alliances; product upgrades; acquisitions; and expansions. Some of the prominent companies in the accountable care solutions market are Cerner Corporation (US), IBM Corporation (US), UnitedHealth Group (US), Aetna, Inc. (US), Allscripts Healthcare Solutions, Inc. (US), Epic Systems Corporation (US), McKesson Corporation (US), Verisk Health (US), ZeOmega, Inc. (US), eClinicalWorks, Inc. (US), and NextGen Healthcare (US).
Major Market Developments
- In September 2016, McKesson launched McKesson Intelligence Hub, a new technology platform for enabling interoperability and sharing business intelligence among healthcare applications. This will help the company to provide automated reimbursement solutions and help streamline payment by making interoperability easy for customers, partners, and vendors across the healthcare ecosystem.
- In August 2016, Aetna expanded its accountable care collaboration with Duke Health (U.S.) and WakeMed Health & Hospitals (U.S.). This collaboration would help the company to deliver better value through quality, cost-effective care, and improved population health management.
- In July 2016, McKesson acquired HealthQX (U.S.). This acquisition helped the company to expand its value-based care portfolio with HealthQX’s value-based payment technology solution, ClarityQx.
Target Audience
- Healthcare Institutions/Providers (Hospitals, Medical Groups, Physician Practices, Diagnostic Centers, Pharmacies, Ambulatory Centers, and Outpatient Clinics)
- Healthcare Insurance Companies/Payers
- Accountable Care Organizations
- Healthcare IT Service Providers
- Government Bodies
- Insurers
- Corporate Entities
Accountable Care Solutions Report Scope
By Product and Service
-
Healthcare Provider Solutions
- Electronic Health/Medical Records
- Healthcare Analytics
- Revenue Cycle Management Solutions (RCM)
- Patient Engagement Solutions
- Population Health Management (PHM) Solutions
- Care Management Solutions
- HCIT Integration Systems
- Healthcare Information Exchange (HIE)
- Clinical Decision Support Systems (CDSS)
-
Healthcare Payer Solutions
- Claims Management Solutions
- Payment Management Solutions
- Provider Network Management Solutions
- Other Payer Solutions
-
Services
- Support and Maintenance Services
- Implementation Services
- Consulting Services
- Training & Education Services
By Delivery Mode
- Web & Cloud-Based Delivery Mode
- On-Premise Delivery Mode
By End User
- Healthcare Providers
- Healthcare Payers
By Geography
-
North America
- U.S.
- Canada
-
Europe
- Germany
- U.K.
- France
- Italy
- Spain
- Rest of Europe
-
Asia-Pacific
- Japan
- China
- Australia
- Rest of Asia-Pacific (RoAPAC)
- Rest of the World
Critical questions which the report answers
- What are new trends which the accountable care solution providers are exploring?
- Which are the key players in the market and how intense is the competition?
Available Customizations
Based on the given market data, MarketsandMarkets offers customizations in the reports as per the client’s specific requirements. The available customization options are as follows:
Geographic Analysis
- Further breakdown of the Rest of Asia-Pacific accountable care solutions market into South Korea, Australia, New Zealand, and others
- Further breakdown of the Rest of Europe accountable care solutions market into Belgium, Russia, Netherlands, Switzerland, and others
- Further breakdown of the Rest of Latin America accountable care solutions market into Argentina, Colombia, Chile, and others
Company Information
- Detailed analysis and profiling of additional market players (Up to 5)
The healthcare industry is undergoing a major transformation as a result of the growing pressure to provide more cost-effective personalized care. The push towards predictable outcomes and higher quality of care is resulting in the convergence of information technologies. In this regard, accountable care solutions facilitate innovation and coordination, and help improve the cost-efficacy, quality, and safety of medical care delivery systems. Furthermore, these solutions help in maintaining patient-provider communications, clinical data repositories, HIE interoperability, terminology mapping and EHR integration, and patient engagement.
Accountable care solutions combine software, portals, comprehensive analytical platforms, and services to offer an integrated system that aids the effective management of accountable care organizations (ACOs). These organizations also referred to as integrated, coordinated, or managed care organizations across different countries. Accountable care solutions are designed to streamline workflows in healthcare systems, enhance quality, improve patient safety, reduce expenses, and facilitate compliance with regulatory guidelines. A functional accountable/managed/integrated care organization should have the capacity to deliver and manage care for a defined population, accept payment, distribute savings to participants, and perform disease management and predictive modeling in order to improve outcomes. Accountable care solutions provide innovation, coordination, and efficiency; they also help improve the cost-efficacy, quality, and safety of the medical care delivery systems for these organizations.
The accountable care solutions market has been segmented, on the basis of product & service, delivery mode, end user and region. The product & service segment was further sub-segmented into healthcare provider solutions, healthcare payer solutions, and services. The market for healthcare provider solutions is expected to grow at the highest CAGR between 2016 and 2021. These solutions are mainly adopted to enhance care quality and patient satisfaction, improve the efficiency of clinical workflows and administrative tasks, stimulate operational savings, and deepen the involvement of patients in medical decisions. The healthcare sector is currently facing a major challenge in terms of continuously escalating costs. The growing need to improve the profitability of healthcare operations and government initiatives for eHealth implementation to improve the quality of care delivered to patients & curtail healthcare costs are the major drivers of market growth. However, high installation costs and shortage of skilled medical professionals are some restraints for the growth of this market. The healthcare provider solutions is further segmented into electronic health records (EHRs)/electronic medical records (EMRs), healthcare IT (HCIT) integration systems, population health management (PHM) solutions, patient engagement solutions, care management solutions, healthcare information exchanges (HIE), healthcare analytics, revenue cycle management solutions, and clinical decision support systems (CDSS). The EHRs segment accounted for the largest share of the healthcare provider solutions market in 2015; however, the healthcare analytics is expected to grow at the highest CAGR between 2016 and 2021.
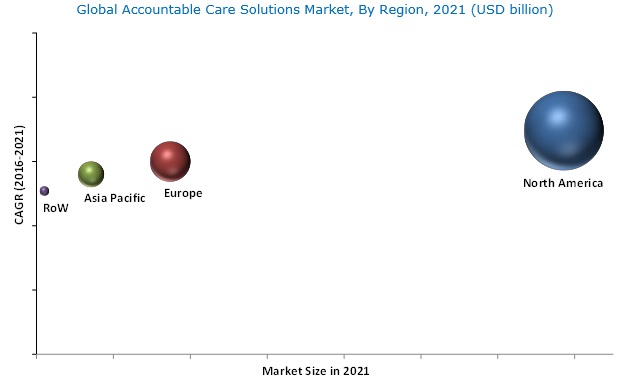
The accountable care solutions market in North America accounted for the largest share of the global accountable care solutions market and is also expected to register the highest CAGR during the forecast period. Stringent legislative and accreditation requirements in healthcare, high adoption rate of HCIT, regulatory requirements regarding patient safety, and the presence of a large number of IT companies are the key market drivers in North America.
The increasing adoption of accountable care solutions among healthcare providers and healthcare payers drive the growth of accountable care solutions market
Healthcare Providers
Healthcare providers comprise large as well as small hospitals, clinics, and other healthcare centers. A number of provisions of the Affordable Care Act (ACA) have resulted in an increase in the number of population health management programs being implemented in the U.S. The ACA stresses on value-based reimbursement and quality of treatment rather than the traditional fee-for-reimbursement systems based on volume. At the same time, the ACA aims to lower the number of uninsured people to reduce the cost of healthcare for the government as well as individuals.
Accountable care solutions for providers help in the exchange of patient information and intelligent clinical decision support among providers, and the management and assessment of health outcomes for a broad patient population. The focus of providers has shifted to a value-based system of care and quality treatment rather than the traditional fee-for-reimbursement system, globally. Most providers focus on reducing unnecessary readmissions and enhancing patient satisfaction with quality care. To gain a competitive edge and cope with the emerging demands, healthcare systems as well as physician groups are rapidly adopting accountable care solutions. This approach aims to not only help improve the quality of care and reduce the readmission rate but also save costs for all the stakeholders involved.
Healthcare Payers
Healthcare payers are entities other than patients that finance or reimburse the cost of health services. They are among the key end users of accountable care solutions. Deployment of accountable care solutions is vital for healthcare insurance providers as it increases patients’ involvement with their care, which in turn results in improved health outcomes, reduced costs, and better management of patient health records and reimbursements. Accountable care solutions are playing a significant role in simplifying the existing payment structures with a focus on a shift in reimbursement from procedure-based, fee-for-service to fee-for-quality, disease or condition-based reimbursement with capitated payment to healthcare delivery organizations on a per-case and per-capita basis.
Critical questions the report answers:
- Where will all these developments take the industry in the mid to long term?
- What are the upcoming industry trends for accountable care organization solutions?
The reluctance of providers in terms of adopting accountable care solutions, coupled with the limited infrastructure & capabilities to support these solutions, is restraining the growth of the accountable care solutions market. Cooperation of providers is very important for the implementation of accountable care software and services; providers may be reluctant due to lack of infrastructure to support these solutions or lack of skills or training to implement these solutions. To ensure the use of accountable care solutions to their full potential, healthcare providers should be engaged in collecting and integrating data, involving their staff in accountable care efforts, counselling and engaging patients in the care process, and streamlining workflows. However, due to financial or time-related constraints, providers display reluctance to employ accountable care solutions.
Some of the prominent companies in the accountable care solutions market are Cerner Corporation (US), IBM Corporation (US), UnitedHealth Group (US), Aetna, Inc. (US), Allscripts Healthcare Solutions, Inc. (US), Epic Systems Corporation (US), McKesson Corporation (US), Verisk Health (US), ZeOmega, Inc. (US), eClinicalWorks, Inc. (US), and NextGen Healthcare (US). These players are increasingly undertaking mergers and acquisitions, product launches, and expansions to develop and introduce new technologies in the market.
Frequently Asked Questions (FAQ):
What is the size of Accountable Care Solutions Market ?
The global Accountable Care Solutions Market size is growing at a CAGR of 16.6%
What are the major growth factors of Accountable Care Solutions Market ?
The healthcare industry is undergoing a major transformation as a result of the growing pressure to provide more cost-effective personalized care. The push towards predictable outcomes and higher quality of care is resulting in the convergence of information technologies. In this regard, accountable care solutions facilitate innovation and coordination, and help improve the cost-efficacy, quality, and safety of medical care delivery systems.
Who all are the prominent players of Accountable Care Solutions Market ?
Some of the prominent companies in the accountable care solutions market are Cerner Corporation (US), IBM Corporation (US), UnitedHealth Group (US), Aetna, Inc. (US), Allscripts Healthcare Solutions, Inc. (US), Epic Systems Corporation (US), McKesson Corporation (US), Verisk Health (US), ZeOmega, Inc. (US), eClinicalWorks, Inc. (US), and NextGen Healthcare (US). .
To speak to our analyst for a discussion on the above findings, click Speak to Analyst
 Exclusive indicates content/data unique to MarketsandMarkets and not available with any competitors.
Table of Contents
1 Introduction (Page No. - 18)
1.1 Objectives of the Study
1.2 Market Definition
1.3 Market Scope
1.3.1 Markets Covered
1.3.2 Years Considered for the Study
1.4 Currency
1.5 Limitations
1.6 Stakeholders
2 Research Methodology (Page No. - 21)
2.1 Research Approach
2.2 Market Size Estimation
2.3 Market Breakdown and Data Triangulation
2.4 Market Share Estimation
2.4.1 Key Data From Secondary Sources
2.4.2 Key Data From Primary Sources
2.4.3 Key Industry Insights
2.5 Assumptions for the Study
3 Executive Summary (Page No. - 29)
4 Premium Insights (Page No. - 33)
4.1 Accountable Care Solutions: Market Overview
4.2 Asia-Pacific: Accountable Care Solutions Services Market, By Type
4.3 Market: Geographic Snapshot
4.4 Market Size, By Payer Solution
4.5 Market: Geographic Mix
5 Market Overview (Page No. - 37)
5.1 Introduction
5.2 Market Dynamics
5.2.1 Drivers
5.2.1.1 Implementation of Government Regulations and Initiatives to Promote Patient-Centric Care
5.2.1.2 Implementation of Incentives to Shift the Burden of Risk From Healthcare Payers to Providers
5.2.1.3 Increasing Number of Accountable Care Organizations
5.2.1.4 Rising Need to Curtail Escalating Healthcare Costs
5.2.1.5 Advancing It and Big Data Capabilities
5.2.1.6 Rising Geriatric Population and Subsequent Growth in the Burden of Chronic Diseases
5.2.2 Restraints
5.2.2.1 Lack of Interoperability
5.2.2.2 High Investments Required for Supporting Infrastructure
5.2.2.3 Data Security Concerns
5.2.3 Opportunities
5.2.3.1 Increasing Focus on Value-Based Medicine
5.2.3.2 Emerging Markets
5.2.3.3 Growing Adoption of Cloud-Based Models
5.2.4 Challenges
5.2.4.1 Reluctance of Providers to Adopt Accountable Care Solutions
5.2.4.2 Lower Reimbursement Rates Within the Value-Based Care Model
6 Industry Insights (Page No. - 48)
6.1 Evolution of Accountable Care Organizations (ACOs): A Promising Payment Reform
6.1.1 Introduction
6.1.2 Evolution of ACOs in the U.S.
6.1.3 Role of Information Technology in Accountable Care
6.2 Hcit Adoption Trend in the U.S.
6.3 Regulatory Analysis
6.3.1 North America
6.3.2 Europe
6.3.3 Asia-Pacific
6.4 Industry Trends
6.4.1 Need for Interoperability & Integration Driving Innovation in the Accountable Care Solutions Market
6.4.2 Shift of Risk Burden From Payers to Providers
6.4.3 Consolidation of Healthcare Providers
7 Accountable Care Solutions Market, By Product & Service (Page No. - 56)
7.1 Introduction
7.2 Healthcare Provider Solutions
7.2.1 Electronic Health/Medical Records
7.2.2 Healthcare Analytics
7.2.3 Revenue Cycle Management Solutions (RCM)
7.2.4 Patient Engagement Solutions
7.2.5 Population Health Management (PHM) Solutions
7.2.6 Care Management Solutions
7.2.7 Hcit Integration Systems
7.2.8 Healthcare Information Exchange (HIE)
7.2.9 Clinical Decision Support Systems (CDSS)
7.3 Healthcare Payer Solutions
7.3.1 Claims Management Solutions
7.3.2 Payment Management Solutions
7.3.3 Provider Network Management Solutions
7.3.4 Other Payer Solutions
7.4 Services
7.4.1 Support and Maintenance Services
7.4.2 Implementation Services
7.4.3 Consulting Services
7.4.4 Training & Education Services
8 Accountable Care Solutions Market, By Delivery Mode (Page No. - 82)
8.1 Introduction
8.2 Web & Cloud-Based Delivery Mode
8.3 On-Premise Delivery Mode
9 Accountable Care Solutions Market, By End User (Page No. - 87)
9.1 Introduction
9.2 Healthcare Providers
9.3 Healthcare Payers
10 Accountable Care Solutions Market, By Geography (Page No. - 92)
10.1 Introduction
10.2 North America
10.2.1 U.S.
10.2.1.1 Shift to Value-Based Care
10.2.1.2 Cms Initiatives
10.2.1.3 Patient-Centered Mandates
10.2.1.4 Growing Aging Population
10.2.1.5 Accountable Care Solutions as A Measure to Curb Healthcare Costs
10.2.1.6 Strategies and Initiatives to Improve the Quality of Healthcare Service Delivery
10.2.2 Canada
10.3 Europe
10.3.1 Germany
10.3.2 U.K.
10.3.3 France
10.3.4 Italy
10.3.5 Spain
10.3.6 Rest of Europe
10.4 Asia-Pacific
10.4.1 Japan
10.4.2 China
10.4.3 Australia
10.4.4 Rest of Asia-Pacific (RoAPAC)
10.5 Rest of the World
11 Competitive Landscape (Page No. - 155)
11.1 Overview
11.2 Market Share Analysis
11.2.1 Electronic Health/Medical Records (EHRS/EMRS)
11.3 Competitive Situation and Trends
11.3.1 Agreements, Partnerships, Collaborations, and Alliances
11.3.2 Product Launches
11.3.3 Acquisitions
11.3.4 Expansions
11.3.5 Product Upgrades
12 Company Profiles (Page No. - 164)
(Introduction, Products & Services, Strategy, & Analyst Insights, Developments, MnM View)*
12.1 Introduction
12.2 Cerner Corporation
12.3 IBM Corporation
12.4 Aetna, Inc.
12.5 Mckesson Corporation
12.6 Allscripts Healthcare Solutions, Inc.
12.7 Unitedhealth Group (Optum Health)
12.8 EPIC Systems Corporation
12.9 Verisk Health, Inc.
12.10 Zeomega Inc.
12.11 Eclinicalworks, LLC
*Details on Marketsandmarkets View, Introduction, Product & Services, Strategy, & Analyst Insights, New Developments Might Not Be Captured in Case of Unlisted Companies.
13 Appendix (Page No. - 190)
13.1 Discussion Guide
13.2 Other Developments
13.3 Knowledge Store: Marketsandmarkets’ Subscription Portal
13.4 Introducing RT: Real-Time Market Intelligence
13.5 Available Customizations
13.6 Related Reports
13.7 Author Details
List of Tables (149 Tables)
Table 1 Impact Analysis: Market Drivers
Table 2 Impact Analysis: Market Restraints
Table 3 Impact Analysis: Market Opportunities
Table 4 Impact Analysis: Market Challenges
Table 5 Global Accountable Care Solutions Market Size, By Product and Service, 2014–2021 (USD Million)
Table 6 Global Healthcare Provider Solutions Market Size, By Type, 2014–2021 (USD Million)
Table 7 Global Healthcare Provider Solutions Market Size, By Country, 2014–2021 (USD Million)
Table 8 Global Electronic Health Records/Electronic Medical Records Market Size, By Country, 2014–2021 (USD Million)
Table 9 Global Healthcare Analytics Market Size, By Country, 2014–2021 (USD Million)
Table 10 Global Revenue Cycle Management Solutions Market Size, By Country, 2014–2021 (USD Million)
Table 11 Global Patient Engagement Solutions Market Size, By Country, 2014–2021 (USD Million)
Table 12 Global Population Health Management Solutions Market Size, By Country, 2014–2021 (USD Million)
Table 13 Global Care Management Solutions Market Size, By Country, 2014–2021 (USD Million)
Table 14 Global Healthcare It Integration Systems Market Size, By Country, 2014–2021 (USD Million)
Table 15 Global Health Information Exchange Market Size, By Country, 2014–2021 (USD Million)
Table 16 Global CDSS Market Size, By Country, 2014–2021 (USD Million)
Table 17 Global Healthcare Payer Solutions Market Size, By Type, 2014–2021 (USD Million)
Table 18 Global Healthcare Payer Solutions Market Size, By Country, 2014–2021 (USD Million)
Table 19 Global Claims Management Solutions Market Size, By Country, 2014–2021 (USD Million)
Table 20 Global Payment Management Solutions Market Size, By Country, 2014–2021 (USD Million)
Table 21 Global Provider Network Management Solutions Market Size, By Country, 2014–2021 (USD Million)
Table 22 Other Payer Solutions Market Size, By Country, 2014–2021 (USD Million)
Table 23 Global Market Size for Services, By Type, 2014–2021 (USD Million)
Table 24 Global Market Size for Services, By Country, 2014–2021 (USD Million)
Table 25 Global Support and Maintenance Services Market Size, By Country, 2014–2021 (USD Million)
Table 26 Global Implementation Services Market Size, By Country, 2014–2021 (USD Million)
Table 27 Global Consulting Services Market Size, By Country, 2014–2021 (USD Million)
Table 28 Global Training & Education Services Market Size, By Country, 2014–2021 (USD Million)
Table 29 Global Market Size, By Delivery Mode, 2014-2021 (USD Million)
Table 30 Web & Cloud-Based Accountable Care Solutions Market Size, By Country, 2014–2021 (USD Million)
Table 31 On-Premise Accountable Care Solutions Market Size, By Country, 2014–2021 (USD Million)
Table 32 Global Market Size, By End User, 2014-2021 (USD Million)
Table 33 Market Size for Providers, By Country, 2014–2021 (USD Million)
Table 34 Market Size for Payers, By Country, 2014–2021 (USD Million)
Table 35 Market Size, By Region, 2014-2021 (USD Million)
Table 36 North America: Market Size, By Country, 2014–2021 (USD Million)
Table 37 North America: Market Size, By Product & Service, 2014–2021 (USD Million)
Table 38 North America: Healthcare Provider Solutions Market Size, By Type, 2014–2021 (USD Million)
Table 39 North America: Healthcare Payer Solutions Market Size, By Type, 2014–2021 (USD Million)
Table 40 North America: Services Market Size, By Type, 2014-2021 (USD Million)
Table 41 North America: Market, By Delivery Mode, 2014-2021 (USD Million)
Table 42 North America: Market, By End User, 2014-2021 (USD Million)
Table 43 U.S.: Macroeconomic Indicators for Healthcare Delivery
Table 44 U.S.: Market Size, By Product & Service, 2014–2021 (USD Million)
Table 45 U.S.: Healthcare Provider Solutions Market Size, By Type, 2014–2021 (USD Million)
Table 46 U.S.: Healthcare Payer Solutions Market Size, By Type, 2014–2021 (USD Million)
Table 47 U.S.: Services Market Size, By Type, 2014-2021 (USD Million)
Table 48 U.S.: Market, By Delivery Mode, 2014-2021 (USD Million)
Table 49 U.S.: Market, By End User, 2014-2021 (USD Million)
Table 50 Canada: Macroeconomic Indicators for Healthcare Delivery
Table 51 Canada: Market Size, By Product & Service, 2014–2021 (USD Million)
Table 52 Canada: Healthcare Provider Solutions Market Size, By Type, 2014–2021 (USD Million)
Table 53 Canada: Healthcare Payer Solutions Market Size, By Type, 2014–2021 (USD Million)
Table 54 Canada: Services Market Size, By Type, 2014-2021 (USD Million)
Table 55 Canada: Market, By Delivery Mode, 2014-2021 (USD Million)
Table 56 Canada: Market, By End User, 2014-2021 (USD Million)
Table 57 Europe: Market Size, By Country, 2014–2021 (USD Million)
Table 58 Europe: Market Size, By Product & Service, 2014–2021 (USD Million)
Table 59 Europe: Healthcare Provider Solutions Market Size, By Type, 2014–2021 (USD Million)
Table 60 Europe: Healthcare Payer Solutions Market Size, By Type, 2014–2021 (USD Million)
Table 61 Europe: Services Market Size, By Type, 2014-2021 (USD Million)
Table 62 Europe: Market, By Delivery Mode, 2014-2021 (USD Million)
Table 63 Europe: Market, By End User, 2014-2021 (USD Million)
Table 64 Germany: Macroeconomic Indicators for Healthcare Delivery
Table 65 Germany: Market Size, By Product & Service, 2014–2021 (USD Million)
Table 66 Germany: Healthcare Provider Solutions Market Size, By Type, 2014–2021 (USD Million)
Table 67 Germany: Healthcare Payer Solutions Market Size, By Type, 2014–2021 (USD Million)
Table 68 Germany: Services Market Size, By Type, 2014-2021 (USD Million)
Table 69 Germany: Market, By Delivery Mode, 2014-2021 (USD Million)
Table 70 Germany: Market, By End User, 2014-2021 (USD Million)
Table 71 U.K.: Macroeconomic Indicators for Healthcare Delivery
Table 72 U.K.: Market Size, By Product & Service, 2014–2021 (USD Million)
Table 73 U.K.: Healthcare Provider Solutions Market Size, By Type, 2014–2021 (USD Million)
Table 74 U.K.: Healthcare Payer Solutions Market Size, By Type, 2014–2021 (USD Million)
Table 75 U.K.: Services Market Size, By Type, 2014-2021 (USD Million)
Table 76 U.K.: Market, By Delivery Mode, 2014-2021 (USD Million)
Table 77 U.K.: Market, By End User, 2014-2021 (USD Million)
Table 78 France: Macroeconomic Indicators for Healthcare Delivery
Table 79 France: Market Size, By Product & Service, 2014–2021 (USD Million)
Table 80 France: Healthcare Provider Solutions Market Size, By Type, 2014–2021 (USD Million)
Table 81 France: Healthcare Payer Solutions Market Size, By Type, 2014–2021 (USD Million)
Table 82 France: Services Market Size, By Type, 2014-2021 (USD Million)
Table 83 France: Market, By Delivery Mode, 2014-2021 (USD Million)
Table 84 France: Market, By End User, 2014-2021 (USD Million)
Table 85 Italy: Macroeconomic Indicators for Healthcare Delivery
Table 86 Italy: Market Size, By Product & Service, 2014–2021 (USD Million)
Table 87 Italy: Healthcare Provider Solutions Market Size, By Type, 2014–2021 (USD Million)
Table 88 Italy: Healthcare Payer Solutions Market Size, By Type, 2014–2021 (USD Million)
Table 89 Italy: Services Market Size, By Type, 2014-2021 (USD Million)
Table 90 Italy: Market, By Delivery Mode, 2014-2021 (USD Million)
Table 91 Italy: Market, By End User, 2014-2021 (USD Million)
Table 92 Spain: Macroeconomic Indicators for Healthcare Delivery
Table 93 Spain: Market Size, By Product & Service, 2014–2021 (USD Million)
Table 94 Spain: Healthcare Provider Solutions Market Size, By Type, 2014–2021 (USD Million)
Table 95 Spain: Healthcare Payer Solutions Market Size, By Type, 2014–2021 (USD Million)
Table 96 Spain: Services Market Size, By Type, 2014-2021 (USD Million)
Table 97 Spain: Market, By Delivery Mode, 2014-2021 (USD Million)
Table 98 Spain: Market, By End User, 2014-2021 (USD Million)
Table 99 RoE: Market Size, By Product & Service, 2014–2021 (USD Million)
Table 100 RoE: Healthcare Provider Solutions Market Size, By Type, 2014–2021 (USD Million)
Table 101 RoE: Healthcare Payer Solutions Market Size, By Type, 2014–2021 (USD Million)
Table 102 RoE: Services Market Size, By Type, 2014-2021 (USD Million)
Table 103 RoE: Accountable Care Solutions Market, By Delivery Mode, 2014-2021 (USD Million)
Table 104 RoE: Accountable Care Solutions Market, By End User, 2014-2021 (USD Million)
Table 105 APAC: Accountable Care Solutions Market Size, By Country, 2014–2021 (USD Million)
Table 106 APAC: Accountable Care Solutions Market Size, By Product & Service, 2014–2021 (USD Million)
Table 107 APAC: Healthcare Provider Solutions Market Size, By Type, 2014–2021 (USD Million)
Table 108 APAC: Healthcare Payer Solutions Market Size, By Type, 2014–2021 (USD Million)
Table 109 APAC: Services Market Size, By Type, 2014-2021 (USD Million)
Table 110 APAC: Accountable Care Solutions Market, By Delivery Mode, 2014-2021 (USD Million)
Table 111 APAC: Accountable Care Solutions Market, By End User, 2014-2021 (USD Million)
Table 112 Japan: Macroeconomic Indicators for Healthcare Delivery
Table 113 Japan: Accountable Care Solutions Market Size, By Product & Service, 2014–2021 (USD Million)
Table 114 Japan: Healthcare Provider Solutions Market Size, By Type, 2014–2021 (USD Million)
Table 115 Japan: Healthcare Payer Solutions Market Size, By Type, 2014–2021 (USD Million)
Table 116 Japan: Services Market Size, By Type, 2014-2021 (USD Million)
Table 117 Japan: Accountable Care Solutions Market, By Delivery Mode, 2014-2021 (USD Million)
Table 118 Japan: Accountable Care Solutions Market, By End User, 2014-2021 (USD Million)
Table 119 China: Macroeconomic Indicators for Healthcare Delivery
Table 120 China: Accountable Care Solutions Market Size, By Product & Service, 2014–2021 (USD Million)
Table 121 China: Healthcare Provider Solutions Market Size, By Type, 2014–2021 (USD Million)
Table 122 China: Healthcare Payer Solutions Market Size, By Type, 2014–2021 (USD Million)
Table 123 China: Services Market Size, By Type, 2014-2021 (USD Million)
Table 124 China: Accountable Care Solutions Market, By Delivery Mode, 2014-2021 (USD Million)
Table 125 China: Accountable Care Solutions Market, By End User, 2014-2021 (USD Million)
Table 126 Australia: Accountable Care Solutions Market Size, By Product & Service, 2014–2021 (USD Million)
Table 127 Australia: Healthcare Provider Solutions Market Size, By Type, 2014–2021 (USD Million)
Table 128 Australia: Healthcare Payer Solutions Market Size, By Type, 2014–2021 (USD Million)
Table 129 Australia: Services Market Size, By Type, 2014-2021 (USD Million)
Table 130 Australia: Accountable Care Solutions Market, By Delivery Mode, 2014-2021 (USD Million)
Table 131 Australia: Accountable Care Solutions Market, By End User, 2014-2021 (USD Million)
Table 132 RoAPAC: Accountable Care Solutions Market Size, By Product & Service, 2014–2021 (USD Million)
Table 133 RoAPAC: Healthcare Provider Solutions Market Size, By Type, 2014–2021 (USD Million)
Table 134 RoAPAC: Healthcare Payer Solutions Market Size, By Type, 2014–2021 (USD Million)
Table 135 RoAPAC: Services Market Size, By Type, 2014-2021 (USD Million)
Table 136 RoAPAC: Accountable Care Solutions Market, By Delivery Mode, 2014-2021 (USD Million)
Table 137 RoAPAC: Accountable Care Solutions Market, By End User, 2014-2021 (USD Million)
Table 138 RoW: Accountable Care Solutions Market Size, By Product & Service, 2014–2021 (USD Million)
Table 139 RoW: Healthcare Provider Solutions Market Size, By Type, 2014–2021 (USD Million)
Table 140 RoW: Healthcare Payer Solutions Market Size, By Type, 2014–2021 (USD Million)
Table 141 RoW: Services Market Size, By Type, 2014-2021 (USD Million)
Table 142 RoW: Accountable Care Solutions Market, By Delivery Mode, 2014-2021 (USD Million)
Table 143 RoW: Accountable Care Solutions Market, By End User, 2014-2021 (USD Million)
Table 144 Growth Strategy Matrix, 2013–2016
Table 145 Recent Developments, 2016
Table 146 Recent Developments, 2015-2016
Table 147 Recent Developments, 2015–2016
Table 148 Recent Developments, 2013–2014
Table 149 Recent Developments, 2015
List of Figures (42 Figures)
Figure 1 Global Accountable Care Solutions Market Segmentation
Figure 2 Research Design
Figure 3 Breakdown of Primary Interviews: By Company Type, Designation, and Region
Figure 4 Bottom-Up Approach
Figure 5 Top-Down Approach
Figure 6 Data Triangulation Methodology
Figure 7 Global Accountable Care Solutions Market, By Product and Service, 2016 vs 2021 (USD Billion)
Figure 8 Global Accountable Care Provider Solutions Market Size, By Type, 2016 vs 2021 (USD Billion)
Figure 9 Accountable Care Solutions Market Size, By Delivery Mode, 2016 vs 2021 (USD Billion)
Figure 10 Global Accountable Care Solutions Market Size, By End User, 2016 vs 2021 (USD Billion)
Figure 11 Geographic Snapshot: Accountable Care Solutions Market
Figure 12 Government Regulations and Initiatives to Promote Patient-Centric Care is Propelling Growth in the Accountable Care Solutions Market
Figure 13 Support and Maintenance Services Segment Commanded the Largest Share of the Asia-Pacific Accountable Care Solutions Market in 2015
Figure 14 The U.S. Accounted for the Largest Share of the Accountable Care Solutions Market in 2015
Figure 15 Claims Management Solutions Segment Will Continue to Dominate the Accountable Care Solutions Market in 2021
Figure 16 North America to Witness the Highest Growth Rate in the Accountable Care Solutions Market During the Forecast Period
Figure 17 Accountable Care Solutions Market: Drivers, Restraints, Opportunities, & Challenges
Figure 18 Healthcare Spending, By Country, 2014 (% of Gdp)
Figure 19 ACO Model of Reimbursement
Figure 20 Evolution of ACO Models
Figure 21 U.S.: Total No. of Public & Private ACOs (2011–2015)
Figure 22 Accountable Care Solutions and Their Use
Figure 23 Healthcare Provider Solutions Will Continue to Dominate the Global Accountable Care Solutions Market in 2021
Figure 24 Healthcare Analytics to Register the Highest Growth During the Forecast Period
Figure 25 Support and Maintenance Services Segment to Command the Largest Share of the Services Market in 2016
Figure 26 Web & Cloud-Based Solutions to Dominate the Accountable Care Solutions Market in 2016
Figure 27 Healthcare Providers to Dominate the Accountable Care Solutions End-User Market in 2016
Figure 28 Geographic Snapshot
Figure 29 North America: Accountable Care Solutions Market Snapshot
Figure 30 Europe: Accountable Care Solutions Market Snapshot
Figure 31 Asia-Pacific: Accountable Care Solutions Market Snapshot
Figure 32 Agreements, Partnerships, Collaborations, & Alliances—Most-Widely Adopted Growth Strategy By Leading Players Between 2013 and 2016
Figure 33 Electronic Health Records Market Share Analysis for ACOs, By Key Player, 2015
Figure 34 Battle for Market Share: Agreements, Partnerships, Collaborations, and Alliances Was the Key Growth Strategy Pursued By Market Players
Figure 35 Geographic Mix of the Top 5 Market Players
Figure 36 Company Snapshot: Cerner Corporation
Figure 37 Company Snapshot: IBM Corporation
Figure 38 Company Snapshot: Aetna, Inc.
Figure 39 Company Snapshot: Mckesson Corporation
Figure 40 Company Snapshot: Allscripts Healthcare Solutions, Inc.
Figure 41 Company Snapshot: Unitedhealth Group
Figure 42 Company Snapshot: Verisk Analytics, Inc.

 Generating Response ...


Growth opportunities and latent adjacency in Accountable Care Solutions Market