Accounts Payable Automation Market by Component (Solution and Services), Organization Size, Deployment Type, Vertical (Consumer Goods and Retail, BFSI, IT and Telecom, and Manufacturing), and Region - Global Forecast to 2024


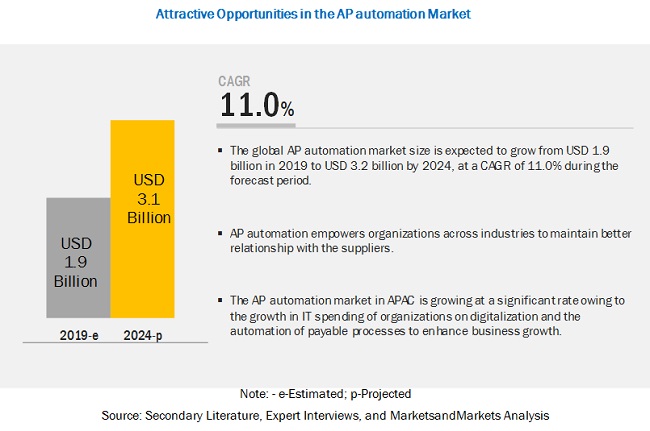
[121 Pages Report] The global Accounts Payable Automation Market size is expected to grow from USD 1.9 billion in 2019 to USD 3.1 billion by 2024, at a Compound Annual Growth Rate (CAGR) of 11.0% during the forecast period. The increasing demand for controlled user access to reduce frauds related to payment is one of the major factors driving the growth of the market. Lack of digital literacy and awareness of AP automation benefits in the emerging economies are some of the challenges.
By vertical, Banking, Financial Services, and Insurance to contribute to the growth of the Accounts Payable Automation Market during the forecast period
The global banking sector is becoming more strategically focused and technologically advanced for responding to consumer expectations while trying to defend the market share against an increasing array of competitors. AP automation in the BFSI vertical focuses on the increasing efficiency of documents by replacing paper invoices with digital invoices. The streamlined and automated payable process helps to serve clients exceptionally, increases profit, prevents fraud, and helps to meet regulatory compliances effectively.
On-premises to hold the highest market share during the forecast period
The on-premises AP automation solution is deployed on the server of the client organization; however, the user or buyer needs to acquire a license to use the AP automated solution, which is customizable. Vendors offer implementation and integration services to get the solution adequately deployed at the client's location for optimum use. The on-premises AP automation solution enables enterprises to automate payable workflow and define rules for the automated approvals of invoices. The percentage share of on-premises AP automation solution is decreasing, as these applications demand high-initial investments and long-term developer commitment.

Asia Pacific to grow at the highest CAGR during the forecast period
Asia Pacific (APAC) is emerging as the fastest-growing market for AP automation solution. Organizations in the APAC region are trying to automate the business processes to reduce the rate of errors owing to manual work. Various organizations prefer automated payable processes to improve visibility and control, eliminating paper processes, reducing cost, and protecting organizations from payment frauds. Several AP automation solution vendors are expanding their reach and exploring opportunities in APAC by offering business specific automated payable solutions.
Key Market Players
The major vendors in the Accounts Payable Automation Market are SAP Ariba (US), Sage Software(US), Tipalti (US), FreshBooks (Canada), Zycus (US), FIS (US), Bottomline Technologies (US), Coupa Software (US), Comarch (Poland), FinancialForce (US), AvidXchange (US), Vanguard Systems (US), Bill.com (US), Procurify (Canada), and Nvoicepay (US).
Zycus (US) is one of the leading players in the market owing to its innovative and industry-specific solution. Its comprehensive product portfolio includes applications for both strategic and operational aspects of procurement. It broadly segments its solutions into eProcurement, eInvoicing, supplier management, and financial savings management. The company offers an AP automation suite to its global customers. With this suite, customers can automate payment processes for better efficiency. The software provides various benefits to its commercial clientele. The benefits include a reduction in operational costs for payment processing, faster invoice processing, and better visibility of invoice cycle in a single click. The company mostly adopts inorganic strategies, such as partnerships and agreements, to expand its business.
Scope of the Report
|
Report Metric |
Details |
|
Market size available for years |
2017�2024 |
|
Base year considered |
2018 |
|
Forecast period |
2019�2024 |
|
Forecast units |
Value (USD) |
|
Segments covered |
Components (Solution, and Services), Organization Sizes, Deployment Types, Industries, and Regions |
|
Geographies covered |
North America, Europe, APAC, Latin America, and MEA |
|
Companies covered |
SAP Ariba (US), Sage Software(UK), Tipalti (US), FreshBooks (Canada), Zycus (US), FIS (US), Bottomline Technologies (US), Coupa Software (US), Comarch (Poland), FinancialForce (US), AvidXchange (US), Vanguard Systems (US), Bill.Com (US), Procurify (Canada), and Nvoicepay (US). |
This research report categorizes the market to forecast revenues and analyze trends in each of the following submarkets:
By component, the Accounts Payable Automation Market has been segmented as follows:
- Solution
- Services
- Professional Services
- Implementation and Integration
- Advisory
- Support and Maintenance
- Managed Services
By organization type, the Market has been segmented as follows:
- Large Enterprises
- Small and Medium-sized Enterprises (SMEs)
By deployment type, the Accounts Payable Automation Market has been segmented as follows:
- On-premises
- Cloud
By industry, the Market has been segmented as follows:
- Consumer Goods and Retail
- Banking, Financial Services, and Insurance (BFSI)
- Information Technology (IT) and Telecom
- Manufacturing
- Healthcare
- Energy and Utilities
- Others (Government, Transportation and Logistics, and Education)
By Region, the Accounts Payable Automation Market has been segmented as follows:
- North America
- US
- Canada
- Europe
- UK
- Germany
- France
- Rest of Europe
- APAC
- India
- China
- ANZ
- Rest of APAC
- MEA
- United Arab Emirates (UAE)
- South Africa
- Rest of MEA
- Latin America
- Brazil
- Mexico
- Rest of Latin America
Recent Developments:
- In May 2019, Tipalti partnered with Everflow to provide customers with a single dashboard powered with various features, including complete performance tracking, global payouts, and analytics.
- In March 2019, FIS signed a definite merger agreement with Worldpay, a global leader in eCommerce and payments. Post the merger, FIS enhanced its product portfolio for payment-related offerings and significantly increased Worldpay�s global distribution footprint.
- In February 2019, FreshBooks to offer more robust accounting to its customers through its newly added double-entry accounting and bank reconciliation functionalities to the FreshBooks accounting software.
Frequently Asked Questions (FAQ):
What is Accounts Payable Automation?
What are the top trends in the Accounts Payable Automation market?
Following are the current market trends impacting the Accounts Payable Automation market:
Driving factors for the Accounts Payable Automation market:
- Growing need to accelerate payment process and reduce invoice processing time
- Increasing demand to reduce the number of delayed payments and improve the compliance rate
- To control user access and credentials leading to reduced fraudulent transactions
Opportunities for the Accounts Payable Automation market:
- Emergence of Ml and RPA technology to handle repetitive and labor-intensive task
What are the top companies providing Accounts Payable Automation solution and services?
What are the major industries adopting Accounts Payable Automation solution and services?
To speak to our analyst for a discussion on the above findings, click Speak to Analyst
 Exclusive indicates content/data unique to MarketsandMarkets and not available with any competitors.
Table of Contents
1 Introduction (Page No. - 15)
1.1 Objectives of the Study
1.2 Market Definition
1.3 Market Scope
1.3.1 Market Segmentation
1.3.2 Regions Covered
1.4 Years Considered for the Study
1.5 Currency Considered
1.6 Stakeholders
2 Research Methodology (Page No. - 19)
2.1 Research Data
2.1.1 Secondary Data
2.1.2 Primary Data
2.1.2.1 Breakup of Primaries
2.2 Market Breakup and Data Triangulation
2.3 Market Size Estimation
2.3.1 Top-Down Approach
2.3.2 Bottom-Up Approach
2.4 Market Forecast
2.5 Assumptions for the Study
2.6 Limitations of the Study
3 Executive Summary (Page No. - 25)
4 Premium Insights (Page No. - 28)
4.1 Attractive Opportunities in the Accounts Payable Automation Market
4.2 Market in North America, By Vertical and Country
4.3 Market: Major Countries
5 Market Overview and Industry Trends (Page No. - 30)
5.1 Introduction
5.2 Market Dynamics
5.2.1 Drivers
5.2.1.1 Growing Need to Accelerate Payment Process and Reduce Invoice Processing Time
5.2.1.2 Increasing Demand to Reduce the Number of Delayed Payments and Improve the Compliance Rate
5.2.1.3 To Control User Access and Credentials Leading to Reduced Fraudulent Transactions
5.2.2 Restraints
5.2.2.1 Insufficient Data Encryption and Security
5.2.3 Opportunities
5.2.3.1 Emergence of Ml and Rpa Technology to Handle Repetitive and Labor-Intensive Task
5.2.4 Challenges
5.2.4.1 Lack of Technical Skills and Digital Literacy in Emerging Countries
5.2.4.2 Complicated Billing Approval Process
5.3 Use Cases
5.3.1 Use Case: Scenario 1
5.3.2 Use Case: Scenario 2
5.3.3 Use Case: Scenario 3
5.3.4 Use Case: Scenario 4
6 Accounts Payable Automation Market, By Component (Page No. - 36)
6.1 Introduction
6.2 Solution
6.2.1 Growing Focus of Organizations to Improve and Automate Payable Processes to Drive the Demand for Accounts Payable Automation Solution
6.3 Services
6.3.1 Professional Services
6.3.1.1 Technicalities Involved in Implementing the Accounts Payable Automation Solution to Boost Professional Services
6.3.2 Implementation and Integration
6.3.2.1 Growing Demand for Integrating the Accounts Payable Automation Solution With Other Software to Drive the Growth of Implementation and Integration Services
6.3.3 Advisory
6.3.3.1 Increasing Shift Toward the Digital Payment System to Drive the Demand for Advisory Services in the Market
6.3.4 Support and Maintenance
6.3.4.1 Growing Demand for On-Time Assistance for Payment Issues to Spur the Demand for Support and Maintenance Services
6.3.5 Managed Services
6.3.5.1 Increasing Deployment of the Accounts Payable Management Solution to Create the Need for Managed Services to Handle Complex Payable Processes
7 Accounts Payable Automation Market, By Organization Size (Page No. - 44)
7.1 Introduction
7.2 Large Enterprises
7.2.1 Customization of the Payable Workflow as Per Business Requirements Increases the Demand for Automated Solutions Driving the Adoption of the Accounts Payable Automation Solution Among Large Enterprises
7.3 Small and Medium-Sized Enterprises
7.3.1 Need for Cost-Effective Solutions to Drive the Growth of the Accounts Payable Automation Solution Across Small and Medium-Sized Enterprises
8 Market, By Deployment Type (Page No. - 48)
8.1 Introduction
8.2 On-Premises
8.2.1 Data Sensitive Organizations Opt for the On-Premises Accounts Payable Automation Solution
8.3 Cloud
8.3.1 Scalability and Ease of Deployment to Boost the Adoption of the Cloud Accounts Payable Automation Solution
9 Accounts Payable Automation Market, By Vertical (Page No. - 52)
9.1 Introduction
9.2 Consumer Goods and Retail
9.2.1 Growing Adoption of Accounts Payable Automation to Help Reduce Costs and Optimize Efficiency and Streamline Back-Office Functions in Consumer Goods and Retail Vertical
9.3 Banking, Financial Services, and Insurance
9.3.1 Focus on Automated Accounts Payable Software to Maximize Staff Productivity and Save the Time of Personnel in the BFSI Vertical
9.4 IT and Telecom
9.4.1 Streamlining of Business Processes By Automated Accounts Payable Platforms to be Crucial for IT and Telecom Companies
9.5 Manufacturing
9.5.1 Automating the Accounts Payable Process to Help in Saving Time and Maintaining Data Accuracy While Digitalizing the Invoice Workflow
9.6 Healthcare
9.6.1 Need to Maintain Consistency in Bill Generation and Payment Process to Boost the Growth of the Market in the
Healthcare Vertical
9.7 Energy and Utilities
9.7.1 Growing Demand for Accounts Payable Automation Solution to Track Work Order and Manage Payroll in the Energy and Utilities Vertical
9.8 Others
10 Accounts Payable Automation Market, By Region (Page No. - 61)
10.1 Introduction
10.2 North America
10.2.1 Increasing Ecommerce Trend and Automated Invoicing Systems to Fuel the Growth of Ap Automation in North America
10.3 Europe
10.3.1 Transformation of Traditional Paper Based Invoicing to Electronic Invoicing to Drive the Growth of Ap Automation Market in Europe
10.4 Asia Pacific
10.4.1 Enterprises Operating in APAC Region are Deploying Ap Automation Solution to Speed Up Payable Process
10.5 Middle East and Africa
10.5.1 Government Regulation to Support Innovation in the Finance Space is Contributing to the Adoption of Ap Automation Solution in the Region
10.6 Latin America
10.6.1 Tremendous Increase in Number of Fintech Startups is Expected to Boost the Growth of Ap Automation Market in the Region
11 Competitive Landscape (Page No. - 80)
11.1 Introduction
11.2 Competitive Leadership Mapping
11.2.1 Visionary Leaders
11.2.2 Innovators
11.2.3 Dynamic Differentiators
11.2.4 Emerging Companies
11.3 Competitive Scenario
11.3.1 Product/Solution Launches and Enhancements
11.3.2 Business Expansions
11.3.3 Partnerships, Agreements, and Collaborations
12 Company Profiles (Page No. - 86)
12.1 Introduction
(Business Overview, Solutions, Products & Services, Key Insights, Recent Developments, SWOT Analysis, MnM View)*
12.2 SAP Ariba
12.3 Sage
12.4 Tipalti
12.5 FreshBooks
12.6 FIS
12.7 Zycus
12.8 Bottomline Technologies
12.9 Coupa Software
12.10 Comarch
12.11 Financialforce
12.12 AvidXchange
12.13 Vanguard Systems
12.14 Bill.Com
12.15 Procurify
12.16 Nvoicepay
*Details on Business Overview, Solutions, Products & Services, Key Insights, Recent Developments, SWOT Analysis, MnM View Might Not be Captured in Case of Unlisted Companies.
13 Appendix (Page No. - 114)
13.1 Discussion Guide
13.2 Knowledge Store: Marketsandmarkets� Subscription Portal
13.3 Available Customizations
13.4 Related Reports
13.5 Author Details
List of Tables (63 Tables)
Table 1 United States Dollar Exchange Rate, 2016�2018
Table 2 Factor Analysis
Table 3 Accounts Payable Automation Market Size, By Component, 2017�2024 (USD Million)
Table 4 Solution: Market Size By Region, 2017�2024 (USD Million)
Table 5 Services: Market Size By Type, 2017�2024 (USD Million)
Table 6 Professional Services: Market Size, By Type, 2017�2024 (USD Million)
Table 7 Integration and Implementation Services Market Size, By Region, 2017�2024 (USD Million)
Table 8 Advisory Services Market Size, By Region, 2017�2024 (USD Million)
Table 9 Support and Maintenance Services Market Size, By Region, 2017�2024 (USD Million)
Table 10 Managed Services Market Size, By Region, 2017�2024 (USD Million)
Table 11 Market Size, By Organization Size, 2017�2024 (USD Million)
Table 12 Large Enterprises: Market Size By Region, 2017�2024 (USD Million)
Table 13 Small and Medium-Sized Enterprises: Market Size By Region, 2017�2024 (USD Million)
Table 14 Accounts Payable Automation Market Size, By Deployment Type, 2017�2024 (USD Million)
Table 15 On-Premises: Market Size By Region, 2017�2024 (USD Million)
Table 16 Cloud: Market Size By Region, 2017�2024 (USD Million)
Table 17 Market, By Vertical, 2017�2024 (USD Million)
Table 18 Consumer Goods and Retail: Market Size By Region, 2017�2024 (USD Million)
Table 19 Banking, Financial Services, and Insurance: Market Size By Region, 2017�2024 (USD Million)
Table 20 IT and Telecom: Market Size By Region, 2017�2024 (USD Million)
Table 21 Manufacturing: Market Size By Region, 2017�2024 (USD Million)
Table 22 Healthcare: Market Size By Region, 2017�2024 (USD Million)
Table 23 Energy and Utilities: Market Size By Region, 2017�2024 (USD Million)
Table 24 Others: Market Size By Region, 2017�2024 (USD Million)
Table 25 Accounts Payable Automation Market Size, By Region, 2017�2024 (USD Million)
Table 26 North America: Market Size By Component, 2017�2024 (USD Million)
Table 27 North America: Market Size By Service Type, 2017�2024 (USD Million)
Table 28 North America: Market Size By Professional Service, 2017�2024 (USD Million)
Table 29 North America: Market Size By Organization Size, 2017�2024 (USD Million)
Table 30 North America: Market Size By Deployment Type, 2017�2024 (USD Million)
Table 31 North America: Market Size By Vertical, 2017�2024 (USD Million)
Table 32 North America: Market Size By Country, 2017�2024 (USD Million)
Table 33 Europe: Market Size, By Component, 2017�2024 (USD Million)
Table 34 Europe: Market Size By Service Type, 2017�2024 (USD Million)
Table 35 Europe: Market Size By Professional Service, 2017�2024 (USD Million)
Table 36 Europe: Market Size By Organization Size, 2017�2024 (USD Million)
Table 37 Europe: Market Size By Deployment Type, 2017�2024 (USD Million)
Table 38 Europe: Market Size By Vertical, 2017�2024 (USD Million)
Table 39 Europe: Market Size By Country, 2017�2024 (USD Million)
Table 40 Asia Pacific: Accounts Payable Automation Market Size, By Component, 2017�2024 (USD Million)
Table 41 Asia Pacific: Market Size By Service Type, 2017�2024 (USD Million)
Table 42 Asia Pacific: Market Size By Professional Service, 2017�2024 (USD Million)
Table 43 Asia Pacific: Market Size By Organization Size, 2017�2024 (USD Million)
Table 44 Asia Pacific: Market Size By Deployment Type, 2017�2024 (USD Million)
Table 45 Asia Pacific: Market Size By Vertical, 2017�2024 (USD Million)
Table 46 Asia Pacific: Market Size By Country, 2017�2024 (USD Million)
Table 47 Middle East and Africa: Market Size, By Component, 2017�2024 (USD Million)
Table 48 Middle East and Africa: Market Size By Service Type, 2017�2024 (USD Million)
Table 49 Middle East and Africa: Market Size By Professional Service, 2017�2024 (USD Million)
Table 50 Middle East and Africa: Market Size By Organization Size, 2017�2024 (USD Million)
Table 51 Middle East and Africa: Market Size By Deployment Type, 2017�2024 (USD Million)
Table 52 Middle East and Africa: Market Size By Vertical, 2017�2024 (USD Million)
Table 53 Middle East and Africa: Market Size By Country, 2017�2024 (USD Million)
Table 54 Latin America: Accounts Payable Automation Market Size, By Component, 2017�2024 (USD Million)
Table 55 Latin America: Market Size By Service Type, 2017�2024 (USD Million)
Table 56 Latin America: Market Size By Professional Service, 2017�2024 (USD Million)
Table 57 Latin America: Market Size By Organization Size, 2017�2024 (USD Million)
Table 58 Latin America: Market Size By Deployment Type, 2017�2024 (USD Million)
Table 59 Latin America: Market Size By Vertical, 2017�2024 (USD Million)
Table 60 Latin America: Market Size By Country, 2017�2024 (USD Million)
Table 61 Product/Solution Launches and Enhancements, 2017�2019
Table 62 Business Expansions, 2017�2018
Table 63 Partnerships, Agreements, and Collaborations, 2018�2019
List of Figures (31 Figures)
Figure 1 Accounts Payable Automation Market: Research Design
Figure 2 Market Top-Down and Bottom-Up Approaches
Figure 3 Asia Pacific to Grow at the Highest CAGR During the Forecast Period
Figure 4 Segments With the Highest Market Shares in 2019
Figure 5 Banking, Financial Services, and Insurance Vertical to Account for the Highest Market Share in 2019
Figure 6 Growing Need to Optimize Operational Efficiency and Gain Better Control on Payment Processes to Drive the Market During the Forecast Period
Figure 7 IT and Telecom Vertical and United States to Dominate the North American Market in 2019
Figure 8 India to Grow at the Highest CAGR in the Market During the Forecast Period
Figure 9 Market: Drivers, Restraints, Opportunities, and Challenges
Figure 10 Services Segment to Grow at a Higher CAGR During the Forecast Period
Figure 11 Managed Services Segment to Grow at a Higher CAGR During the Forecast Period
Figure 12 Implementation and Integration Segment to Grow at the Highest CAGR During the Forecast Period
Figure 13 Small and Medium-Sized Enterprises Segment to Grow at a Higher CAGR During the Forecast Period
Figure 14 Cloud Segment to Grow at a Higher CAGR During the Forecast Period
Figure 15 Consumer Goods and Retail Vertical to Grow at the Highest CAGR During the Forecast Period
Figure 16 Asia Pacific to Witness the Highest Growth During the Forecast Period
Figure 17 North America: Market Snapshot
Figure 18 Asia Pacific: Market Snapshot
Figure 19 Key Developments in the Accounts Payable Automation Market, 2017�2019
Figure 20 Market (Global) Competitive Leadership Mapping, 2019
Figure 21 Geographic Revenue Mix of the Top Market Players
Figure 22 SAP Ariba: SWOT Analysis
Figure 23 Sage: Company Snapshot
Figure 24 FIS: Company Snapshot
Figure 25 FIS: SWOT Analysis
Figure 26 Bottomline Technologies: Company Snapshot
Figure 27 Bottomline Technologies: SWOT Analysis
Figure 28 Coupa Software: Company Snapshot
Figure 29 Coupa Software: SWOT Analysis
Figure 30 Comarch: Company Snapshot
Figure 31 Comarch: SWOT Analysis
The study involved 4 major activities in estimating the current market size for the Accounts Payable Automation Market. An exhaustive secondary research was done to collect information on the market. The next step was to validate these findings, assumptions, and sizing with industry experts across the value chain using primary research. Both top-down and bottom-up approaches were employed to estimate the complete market size. Thereafter, the market breakup and data triangulation procedures were used to estimate the market size of the segments and subsegments of the market.
Secondary research
The market size for companies offering AP automation solution and services was arrived at based on the secondary data available through paid and unpaid sources, and by analyzing the product portfolios of the major companies in the ecosystem and rating the companies according to their performance and quality. In the secondary research process, various sources were referred, such as Payment Journal, Accounting Today, and others for identifying and collecting information for this study. The secondary sources included annual reports; press releases and investor presentations of companies; white papers, journals like Payments Journal, and certified publications such as Accounting Today and Digitalist Magazine ; articles from recognized authors; directories; and databases.
Primary research
In the primary research process, various sources from both supply and demand sides were interviewed to obtain qualitative and quantitative information for making this report. The primary sources from the supply side included industry experts, such as Chief Executive Officers (CEOs), Vice Presidents (VPs), marketing directors, technology and innovation directors, and related key executives from various key organizations operating in the Accounts Payable Automation Market.
After the complete market engineering process (including calculations for market statistics, market breakups, market size estimations, market forecasting, and data triangulation), extensive primary research was conducted to gather information, and verify and validate the critical numbers arrived at. Primary research was also conducted to identify the segmentation types; the competitive landscape of the AP automation market players; and key market dynamics, such as drivers, restraints, opportunities, challenges, industry trends, and key players� strategies.
To know about the assumptions considered for the study, download the pdf brochure
Accounts Payable Automation Market size estimation
Both top-down and bottom-up approaches were used to estimate and validate the total size of the market. These methods were also used extensively to estimate the size of various subsegments in the market. The research methodology used to estimate the market size includes the following:
- The key players in the industry and markets have been identified through extensive secondary research.
- The industry�s supply chain and market size, in terms of value, have been determined through primary and secondary research processes.
- All percentage shares, splits, and breakups have been determined using secondary sources and verified through primary sources.
Data triangulation
After arriving at the overall market size using the market size estimation processes as explained above, the market was split into several segments and subsegments. To complete the overall market engineering process and arrive at the exact statistics of each market segment and subsegment, the data triangulation, and market breakup procedures were employed, wherever applicable. The data was triangulated by studying various factors and trends from both the demand and supply sides. Various factors impacting the AP automation market, such as recent developments, regulations, technology maturity, research and development, Information Technology (IT) spending, startup ecosystem, organization size, cloud technology, and mobile technology, have been considered in the study.
Report objectives
- To define, describe, and forecast the Accounts Payable Automation Market by component (solution and services), deployment type, organization size, industry, and region
- To provide detailed information about the major factors (drivers, restraints, opportunities, and industry-specific challenges) influencing the growth of the market
- To analyze the market with respect to individual growth trends, prospects, and contributions to the market
- To forecast the market size of 5 main regions, namely, North America, Europe, Asia Pacific (APAC), Middle East and Africa (MEA), and Latin America
- To analyze opportunities in the market for stakeholders, by identifying the high-growth segments of the market
- To profile the key players in the market and comprehensively analyze their core competencies in each subsegments
- To analyze the competitive developments, such as product/service launches and product enhancements, partnerships, collaborations, agreements, and mergers and acquisitions, and, in the market
Key questions addressed by the report:
- Where would all these developments drive the industry in the mid to long term?
- What are the upcoming industry solutions for the Accounts Payable Automation Market?
- Which are the major factors expected to drive the market?
- Which region is projected to offer high growth for vendors in the market?
With the given market data, MarketsandMarkets offers customizations as per the company�s specific needs. The following customization options are available for the report:
Available customizations
Product analysis
- Product matrix gives a detailed comparison of the product portfolio of each company
Company information
- Detailed analysis and profiling of additional market players


Growth opportunities and latent adjacency in Accounts Payable Automation Market