Acoustic Camera Market by Array Type (2D and 3D), Measurement Type (Far Field and Near Field), Application (Noise Source Identification, Leakage Detection), Industry (Automotive, Infrastructure), and Geography - Global Forecast to 2036


The global acoustic cameras market was valued at USD 195 million in 2024 and is estimated to reach USD 470 million by 2036, at a CAGR of 6.5% between 2025 and 2036.

The global acoustic cameras market is positioned for significant expansion between 2025 and 2035, driven by the rising need for advanced noise source identification and sound visualization across industries such as automotive, aerospace, manufacturing, and infrastructure.
Increasing regulatory emphasis on noise control and workplace safety, coupled with growing demand for precision-based acoustic analysis in product design and quality testing, is propelling market growth. Additionally, the integration of AI, beamforming, and 3D sound mapping technologies enhances diagnostic accuracy and real-time analysis, further expanding adoption. The rising use of acoustic cameras in environmental monitoring, smart city projects, and defense applications also contributes to the market’s steady expansion worldwide.
An acoustic camera is an advanced device used to detect, visualize, and analyze sound sources by combining data from an array of microphones with optical imaging. It creates visual “sound maps” that show the intensity and location of noise, helping users identify specific sources of unwanted or problematic sounds. Acoustic cameras are widely used in industries such as automotive, aerospace, manufacturing, and environmental monitoring to diagnose equipment faults, improve product design, and ensure compliance with noise regulations.
Market by Application
Noise Source Identification
The noise source identification segment remain the dominant application for acoustic cameras, accounting for the largest share of the global market due to its critical role in detecting, localizing, and analyzing unwanted sound emissions across various industries. Manufacturers in automotive, aerospace, and industrial sectors increasingly rely on acoustic cameras to pinpoint noise sources in engines, machinery, and structural components, enabling efficient noise reduction and product optimization. Additionally, the growing emphasis on meeting environmental noise regulations and improving workplace comfort has accelerated the adoption of these systems. The ability of acoustic cameras to provide precise, real-time sound visualization makes them indispensable for quality control, predictive maintenance, and compliance applications, driving their dominance in the market.
Leakage Detection
The leakage detection application in the acoustic camera market is driven by the growing need for efficient and non-intrusive methods to identify gas, air, and vacuum leaks in industrial systems. Industries such as oil & gas, power generation, and manufacturing are increasingly adopting acoustic cameras for their ability to detect high-frequency sound patterns from leaks that are otherwise invisible or difficult to locate with traditional methods. These systems enable faster maintenance, minimize energy loss, prevent safety hazards, and reduce operational downtime.
Market by Measurement Type
Far Field
Far Field is a larger segment in terms of measurement type, due to its extensive use in large-scale applications such as automotive testing, aerospace engineering, and environmental noise monitoring. Far-field acoustic cameras allow sound source localization from a distance without interfering with the object under test, making them ideal for detecting and analyzing noise emissions from vehicles, aircraft, machinery, and industrial equipment in open or semi-open environments. Their ability to cover wider areas, combined with advanced beamforming algorithms and high-resolution imaging, enables accurate identification of complex noise patterns. This capability supports regulatory compliance, product quality improvement, and environmental noise reduction—key factors driving widespread adoption of far-field acoustic measurement systems.
Near Field
Near Field is experiencing a higher growth, due to its increasing adoption in precision-based applications such as electronics testing, component-level noise analysis, and industrial machinery diagnostics. Near-field acoustic cameras enable highly detailed sound mapping at close range, allowing engineers to pinpoint minute noise sources and vibrations in compact devices like electric motors, circuit boards, and HVAC components. This technology is crucial for enhancing product design, reducing unwanted noise, and improving overall acoustic performance.
Market by Industry
Automotive
The automotive segment remain the dominant industry for acoustic cameras, accounting for the largest share of the global market to its extensive use of sound imaging technology for vehicle noise, vibration, and harshness (NVH) testing. Acoustic cameras enable automakers to precisely locate and analyze unwanted noise sources in engines, exhaust systems, electric drivetrains, and vehicle interiors, supporting the development of quieter, more comfortable, and high-performance vehicles. With the transition toward electric and hybrid vehicles, manufacturers are increasingly relying on acoustic cameras to identify subtle mechanical and aerodynamic noises that were previously masked by engine sounds.
Energy & Power
The energy & power industry is increasingly adopting acoustic cameras to enhance equipment reliability, operational efficiency, and safety across facilities. These cameras enable precise detection and localization of partial discharges, gas leaks, and mechanical faults in high-voltage equipment, turbines, and pipelines without physical contact. With the growing focus on predictive maintenance, asset optimization, and minimizing downtime, acoustic imaging solutions help operators identify issues early, reducing costly breakdowns and improving energy output.
Industrial
The industrial sector is driving significant demand for acoustic cameras due to their ability to identify and analyze noise sources, air or gas leaks, and mechanical faults in complex manufacturing environments. As industries focus on improving operational efficiency, reducing maintenance costs, and ensuring workplace safety, acoustic cameras provide a non-contact and real-time solution for diagnosing issues in machinery, compressors, pipelines, and production lines. The growing implementation of predictive maintenance strategies and Industry 4.0 initiatives, coupled with advancements in AI-based sound analysis, has enhanced the ability to monitor equipment health and prevent unplanned downtime.
Market by Geography
Geographically, the acoustic camera market is experiencing widespread adoption across North America, Europe, Asia Pacific, and the Middle East & Africa. Asia Pacific to be the fastest growing market, driven by rapid industrialization, expanding automotive and electronics manufacturing sectors, and rising emphasis on noise control and quality assurance. Countries like China, Japan, and South Korea are investing heavily in advanced acoustic testing and sound visualization technologies to enhance product performance, comply with stringent noise regulations, and support R&D in electric vehicles and smart consumer electronics. Additionally, the growing adoption of acoustic cameras in infrastructure maintenance, leakage detection, and environmental monitoring coupled with government initiatives promoting industrial automation and workplace safety further accelerates market growth across the region.
Market Dynamics
Driver: Increasing integration of AI and ML technologies
The acoustic camera market is experiencing strong growth driven by the integration of artificial intelligence and machine learning technologies, which enhance real-time data analysis, automate decision-making, and improve situational awareness across various applications. AI-powered acoustic systems are increasingly used in autonomous vehicles, predictive maintenance, and industrial safety, providing advanced noise source localization and fault detection capabilities. As industries adopt modern, cost-efficient, and quality-focused production techniques, the need for accurate sound mapping and diagnostic tools continues to rise, further propelling market growth.
Restraint: High cost and complexity of acoustic camera systems
Acoustic camera require sophisticated hardware, such as dense microphone arrays, high-resolution optical sensors, and advanced signal processing units, all of which significantly increase manufacturing and maintenance costs. Additionally, the software integration needed for precise acoustic imaging and noise localization demands specialized expertise and continuous calibration. As a result, adoption is largely limited to high-end industrial applications, research institutions, and large enterprises with dedicated budgets. For small and medium-sized companies, the steep initial investment and need for skilled operators make it difficult to justify deployment, slowing the widespread commercialization of acoustic camera technology.
Opportunity: Growing use of acoustic systems for predictive maintenance and smart manufacturing
With industries increasingly shifting toward automation and Industry 4.0 ecosystems, the demand for tools that can detect anomalies and prevent equipment failures in real time is accelerating. Acoustic cameras are emerging as vital diagnostic instruments, capable of identifying leaks, mechanical faults, and vibration-related issues before they escalate into costly downtime. Moreover, their integration with AI, IoT, and cloud platforms enables advanced analytics and remote monitoring, enhancing overall operational efficiency. The adoption of such intelligent noise detection systems in automotive, aerospace, and energy sectors is expected to expand rapidly, providing substantial market opportunities.
Challenge: Complexity of data processing and the impact of environmental noise interference
Accurately identifying sound sources in industrial or outdoor environments can be difficult due to overlapping noises, reflections, and unpredictable acoustic patterns. Factors such as wind, vibration, and fluctuating ambient noise can distort readings, affecting the precision of sound localization and imaging. To overcome this, manufacturers must develop highly advanced signal processing algorithms, adaptive filtering techniques, and calibration models that can function effectively under diverse conditions. However, achieving this balance between accuracy, cost, and real-time performance remains a technical challenge, hindering the seamless deployment of acoustic camera solutions in all environments.
Future Outlook
Between 2025 and 2035, the acoustic camera market is expected to expand significantly as industries increasingly adopt sound-based diagnostic and monitoring technologies for precision analysis and maintenance. Advances in AI-driven signal processing, machine learning algorithms, and edge computing are transforming acoustic cameras from basic noise detection tools into intelligent systems capable of real-time sound source localization, predictive maintenance, and automated fault detection. The growing emphasis on industrial safety, environmental noise control, and product quality testing across sectors such as automotive, manufacturing, and energy is further driving adoption. Additionally, government regulations on noise emission and workplace safety, combined with the rising integration of IoT-enabled smart factories, will accelerate market growth. As the market evolves, acoustic cameras will play a key role in enhancing operational efficiency, improving environmental compliance, and supporting data-driven decision-making for sustainable industrial and urban ecosystems.
Key Market Players
Top acoustic cameras companies gfai tech GmbH (Germany), Brüel & Kjær (Denmark), CAE Software and Systems GmbH (Germany), Siemens PLM Software (US), and Norsonic (Norway).
Key Questions addressed in this report:
- What are the global trends in demand for the market?
- What are the upcoming technologies/product areas that will have a significant impact on the market in the future?
- What will be the revenue pockets for the market players in the next 6 years?
- What are the prime strategies followed by key players in the market?
 Exclusive indicates content/data unique to MarketsandMarkets and not available with any competitors.
TABLE OF CONTENTS
1 INTRODUCTION (Page No. - 16)
1.1 STUDY OBJECTIVES
1.2 DEFINITION
1.3 STUDY SCOPE
1.3.1 MARKETS COVERED
1.3.2 GEOGRAPHIC SCOPE
1.4 YEARS CONSIDERED
1.5 CURRENCY
1.6 MARKET STAKEHOLDERS
2 RESEARCH METHODOLOGY (Page No. - 19)
2.1 RESEARCH DATA
2.1.1 SECONDARY AND PRIMARY RESEARCH
2.1.1.1 Key industry insights
2.1.2 SECONDARY DATA
2.1.2.1 Key data from secondary sources
2.1.3 PRIMARY DATA
2.1.3.1 Breakdown of primaries
2.1.3.2 Key data from primary sources
2.2 MARKET SIZE ESTIMATION
2.2.1 BOTTOM-UP APPROACH
2.2.2 TOP-DOWN APPROACH
2.3 MARKET BREAKDOWN AND DATA TRIANGULATION
2.4 RESEARCH ASSUMPTIONS
2.4.1 SPECIFIC CONSIDERATIONS FOR ESTIMATION OF MARKET REVENUE
3 EXECUTIVE SUMMARY (Page No. - 28)
4 PREMIUM INSIGHTS (Page No. - 32)
4.1 ATTRACTIVE GROWTH OPPORTUNITIES IN ACOUSTIC CAMERA MARKET
4.2 MARKET, BY MEASUREMENT TYPE
4.3 MARKET IN EUROPE, BY COUNTRY AND INDUSTRY
4.4 MARKET, BY APPLICATION
4.5 MARKET, BY COUNTRY (2018)
5 MARKET OVERVIEW (Page No. - 35)
5.1 INTRODUCTION
5.2 MARKET DYNAMICS
5.2.1 DRIVERS
5.2.1.1 Emerging new technologies in automotive
5.2.1.2 Increasing automated production process
5.2.1.3 Increasing awareness about noise pollution
5.2.2 RESTRAINTS
5.2.2.1 High manufacturing cost of acoustic camera system
5.2.3 OPPORTUNITIES
5.2.3.1 Growing adoption of acoustics in entertainment venues
5.2.3.2 Emerging audio and video combined microphone and camera array technology
5.2.4 CHALLENGES
5.2.4.1 Need for high computational power
5.3 VALUE CHAIN ANALYSIS
6 ACOUSTIC CAMERA MARKET, BY ARRAY TYPE (Page No. - 39)
6.1 INTRODUCTION
6.2 2D ARRAY
6.2.1 HEXAGON ARRAY
6.2.1.1 Hexagon array gained traction as it is widely used in sound source identification application
6.2.2 RING ARRAY
6.2.2.1 Ring array to dominate the acoustic camera market during the forecast period
6.2.3 SQUARE AND RECTANGLE ARRAY
6.2.3.1 Square & rectangle array plays one of the most significant role in the market
6.2.4 STAR ARRAY
6.2.4.1 Star array to witness significant growth in the market
6.2.5 WHEEL ARRAY
6.2.5.1 Wheel array to drive the market for automotive and transportation industry
6.2.6 OTHER 2D ARRAYS
6.3 3D ARRAY
6.3.1 SPHERE ARRAY
6.3.1.1 Sphere array is expected to be fastest growing owing to its higher adoption rate for vehicle and aircraft cabin application
6.3.2 OTHER 3D ARRAYS
7 ACOUSTIC CAMERA MARKET, BY MEASUREMENT TYPE (Page No. - 47)
7.1 INTRODUCTION
7.2 FAR FIELD
7.2.1 BEAMFORMING
7.2.1.1 Beamforming measurement type to dominate market during the forecast period
7.3 NEAR FIELD
7.3.1 INTENSITY
7.3.1.1 Intensity measurement type to witness significant growth in the market
7.3.2 HOLOGRAPHY
7.3.2.1 Holography measurement type to drive the market for holography industry
8 ACOUSTIC CAMERA MARKET, BY APPLICATION (Page No. - 55)
8.1 INTRODUCTION
8.2 NOISE SOURCE IDENTIFICATION
8.2.1 NOISE SOURCE IDENTIFICATION APPLICATION TO WITNESS SIGNIFICANT GROWTH IN THE MARKET
8.3 LEAKAGE DETECTION
8.3.1 LEAKAGE DETECTION APPLICATION TO DRIVE THE MARKET FOR FLUID OR GAS APPLICATIONS
8.4 OTHERS
9 ACOUSTIC CAMERA MARKET, BY INDUSTRY (Page No. - 61)
9.1 INTRODUCTION
9.2 AEROSPACE
9.2.1 AEROSPACE INDUSTRY TO WITNESS SIGNIFICANT GROWTH IN MARKET
9.3 AUTOMOTIVE
9.3.1 AUTOMOTIVE INDUSTRY TO DOMINATE THE ACOUSTIC CAMERA MARKET DURING THE FORECAST PERIOD
9.4 INDUSTRIAL
9.4.1 INDUSTRIAL INDUSTRY IS EXPECTED TO BE FASTEST GROWING INDUSTRY FOR MARKET
9.5 INFRASTRUCTURE
9.5.1 BUILDING ACOUSTIC
9.5.1.1 Europe to dominate the market for building acoustic industry during the forecast period
9.5.2 ENVIRONMENTAL MONITORING
9.5.2.1 Environmental monitoring industry to witness significant growth in acoustic camera market
9.6 ENERGY & POWER
9.6.1 ENERGY & POWER INDUSTRY IS EXPECTED TO WITNESS SIGNIFICANT GROWTH FOR FORECAST PERIOD
9.7 ELECTRONICS & APPLIANCES
9.7.1 EUROPE TO DRIVE ACOUSTIC CAMERA MARKET FOR ELECTRONICS & APPLIANCES
9.8 EDUCATION AND RESEARCH
9.8.1 NOISE SOURCE IDENTIFICATION AND LEAKAGE DETECTION ARE KEY APPLICATION AREAS OF ACOUSTIC CAMERA FOR EDUCATION & RESEARCH INDUSTRY
10 GEOGRAPHIC ANALYSIS (Page No. - 76)
10.1 INTRODUCTION
10.2 NORTH AMERICA
10.2.1 US
10.2.1.1 US holds the largest share of acoustic camera market in North America
10.2.2 CANADA
10.2.2.1 Growth in automotive drives market in Canada
10.2.3 MEXICO
10.2.3.1 Increasing spending on energy & power drives market in Mexico
10.3 EUROPE
10.3.1 GERMANY
10.3.1.1 Water and wastewater industry projects drive market in Germany
10.3.2 UK
10.3.2.1 UK to hold largest share of market in Europe
10.3.3 FRANCE
10.3.3.1 Investment in power generation technologies in France to boost market growth
10.3.4 REST OF EUROPE
10.4 APAC
10.4.1 CHINA
10.4.1.1 China to hold largest share of market in APAC during forecast period
10.4.2 JAPAN
10.4.2.1 Investment in renewable energy sources and power generation in Japan will increase demand for acoustic camera applications.
10.4.3 INDIA
10.4.3.1 India is the fastest-growing country in APAC in market
10.4.4 REST OF APAC
10.5 ROW
10.5.1 SOUTH AMERICA
10.5.1.1 Growth in mining industry will drive acoustic camera market in South America
10.5.2 MIDDLE EAST
10.5.2.1 Middle East is one of the fastest-growing countries of market in RoW
10.5.3 AFRICA
10.5.3.1 Investment in power industry drives market in Africa
11 COMPETITIVE LANDSCAPE (Page No. - 93)
11.1 OVERVIEW
11.2 MARKET RANK ANALYSIS
11.3 COMPETITIVE SCENARIO
11.3.1 PARTNERSHIPS, MERGERS, AND ACQUISITIONS
11.4 COMPETITIVE LEADERSHIP MAPPING
11.4.1 VISIONARY LEADERS
11.4.2 INNOVATORS
11.4.3 DYNAMIC DIFFERENTIATORS
11.4.4 EMERGING COMPANIES
11.5 BUSINESS STRATEGY EXCELLENCE (FOR ALL 25 PLAYERS)
11.6 PRODUCT OFFERING (FOR ALL 25 PLAYERS)
12 COMPANY PROFILES (Page No. - 99)
12.1 KEY COMPANIES
(Business Overview, Products Offered, Recent Developments, SWOT Analysis, and MnM View)*
12.1.1 BRÜEL & KJÆR.
12.1.2 CAE SOFTWARE AND SYSTEMS GMBH
12.1.3 GFAI TECH GMBH
12.1.4 MICROFLOWN TECHNOLOGIES
12.1.5 NORSONIC AS
12.1.6 SINUS MESSTECHNIK GMBH
12.1.7 SIGNAL INTERFACE GROUP (SIG)
12.1.8 SM INSTRUMENTS
12.1.9 SORAMA
12.1.10 SIEMENS PRODUCT LIFECYCLE MANAGEMENT SOFTWARE INC
12.1.11 ZIEGLER-INSTRUMENTS GMBH
* Business Overview, Products Offered, Recent Developments, SWOT Analysis, and MnM View might not be captured in case of unlisted companies.
12.2 OTHER KEY PLAYERS
12.2.1 01DB
12.2.2 POLYTEC GMBH
12.2.3 VISISONICS CORPORATION
12.2.4 NATIONAL INSTRUMENTS.
12.3 KEY DISTRIBUTORS
12.3.1 ANV LTD
12.3.2 CAMPBELL ASSOCIATES LTD
12.3.3 SCANTEK INC
12.3.4 THP SYSTEMS
12.3.5 TOTALSIM LTD.
13 APPENDIX (Page No. - 120)
13.1 INSIGHTS OF INDUSTRY EXPERTS
13.2 DISCUSSION GUIDE
13.3 KNOWLEDGE STORE: MARKETSANDMARKETS’ SUBSCRIPTION PORTAL
13.4 AVAILABLE CUSTOMIZATIONS
13.5 RELATED REPORTS
13.6 AUTHOR DETAILS
LIST OF TABLES (59 TABLES)
TABLE 1 ACOUSTIC CAMERA MARKET, BY ARRAY TYPE, 2015–2024 (USD MILLION)
TABLE 2 MARKET, BY ARRAY TYPE, 2015–2024 (THOUSAND UNITS)
TABLE 3 MARKET, BY 2D ARRAY TYPE, 2015–2024 (USD MILLION)
TABLE 4 MARKET, BY 2D ARRAY TYPE, 2015–2024 (THOUSAND UNITS)
TABLE 5 MARKET FOR 2D ARRAY TYPE, BY MEASUREMENT TYPE, 2015–2024 (USD MILLION)
TABLE 6 MARKET, BY 3D ARRAY TYPE, 2015–2024 (USD MILLION)
TABLE 7 MARKET, BY 3D ARRAY TYPE, 2015–2024 (THOUSAND UNITS)
TABLE 8 MARKET FOR 3D ARRAY, BY MEASUREMENT TYPE, 2015–2024 (USD MILLION)
TABLE 9 ACOUSTIC CAMERA MARKET, BY MEASUREMENT TYPE, 2015–2024 (USD MILLION)
TABLE 10 MARKET, BY MEASUREMENT TYPE, 2015–2024 (THOUSAND UNITS)
TABLE 11 MARKET FOR FAR-FIELD MEASUREMENT TYPE, BY SUBSEGMENT, 2015–2024 (USD MILLION)
TABLE 12 MARKET FOR FAR-FIELD MEASUREMENT TYPE, BY SUBSEGMENT, 2015–2024 (THOUSAND UNITS)
TABLE 13 MARKET FOR FAR-FIELD MEASUREMENT TYPE, BY ARRAY TYPE, 2015–2024 (USD MILLION)
TABLE 14 MARKET FOR FAR-FIELD MEASUREMENT TYPE, BY ARRAY TYPE, 2015–2024 (THOUSAND UNITS)
TABLE 15 MARKET FOR FAR-FIELD MEASUREMENT TYPE, BY APPLICATION, 2015–2024 (USD MILLION)
TABLE 16 MARKET FOR NEAR-FIELD MEASUREMENT TYPE, BY SUBSEGMENT, 2015–2024 (USD MILLION)
TABLE 17 MARKET FOR NEAR-FIELD MEASUREMENT TYPE, BY SUBSEGMENT, 2015–2024 (THOUSAND UNITS)
TABLE 18 MARKET FOR NEAR-FIELD MEASUREMENT TYPE, BY ARRAY TYPE, 2015–2024 (USD MILLION)
TABLE 19 MARKET FOR NEAR-FIELD MEASUREMENT TYPE, BY ARRAY TYPE, 2015–2024 (THOUSAND UNITS)
TABLE 20 MARKET FOR NEAR-FIELD MEASUREMENT TYPE, BY APPLICATION, 2015–2024 (USD MILLION)
TABLE 21 ACOUSTIC CAMERA MARKET, BY APPLICATION, 2015–2024 (USD MILLION)
TABLE 22 MARKET, BY APPLICATION, 2015–2024 (THOUSAND UNITS)
TABLE 23 MARKET FOR NOISE SOURCE IDENTIFICATION APPLICATION, BY MEASUREMENT TYPE, 2015–2024 (USD MILLION)
TABLE 24 MARKET FOR NOISE SOURCE IDENTIFICATION APPLICATION, BY INDUSTRY, 2015–2024 (USD MILLION)
TABLE 25 MARKET FOR LEAKAGE DETECTION APPLICATION, BY MEASUREMENT TYPE, 2015–2024 (USD MILLION)
TABLE 26 MARKET FOR LEAKAGE DETECTION APPLICATION, BY INDUSTRY, 2015–2024 (USD MILLION)
TABLE 27 ACOUSTIC CAMERA MARKET FOR OTHER APPLICATIONS, BY MEASUREMENT TYPE, 2015–2024 (USD MILLION)
TABLE 28 MARKET FOR OTHER APPLICATIONS, BY INDUSTRY, 2015–2024 (USD MILLION)
TABLE 29 MARKET, BY INDUSTRY, 2015–2024 (USD MILLION)
TABLE 30 ACOUSTIC CAMERA MARKET, BY INDUSTRY, 2015–2024 (THOUSAND UNITS)
TABLE 31 MARKET FOR AEROSPACE, BY REGION, 2015–2024 (USD MILLION)
TABLE 32 MARKET FOR AEROSPACE, BY APPLICATION, 2015–2024 (USD MILLION)
TABLE 33 MARKET IN AUTOMOTIVE, BY REGION, 2015–2024 (USD MILLION)
TABLE 34 MARKET IN AUTOMOTIVE, BY APPLICATION, 2015–2024 (USD MILLION)
TABLE 35 MARKET FOR INDUSTRIAL, BY REGION, 2015–2024 (USD MILLION)
TABLE 36 MARKET FOR INDUSTRIAL, BY APPLICATION, 2015–2024 (USD MILLION)
TABLE 37 MARKET FOR INFRASTRUCTURE, BY REGION, 2015–2024 (USD MILLION)
TABLE 38 MARKET FOR INFRASTRUCTURE, BY TYPE, 2015–2024 (USD MILLION)
TABLE 39 MARKET FOR INFRASTRUCTURE, BY APPLICATION, 2015–2024 (USD MILLION)
TABLE 40 MARKET FOR BUILDING ACOUSTIC, BY REGION, 2015–2024 (USD MILLION)
TABLE 41 MARKET IN BUILDING ACOUSTIC, BY APPLICATION, 2015–2024 (USD MILLION)
TABLE 42 MARKET FOR ENVIRONMENTAL MONITORING, BY REGION, 2015–2024 (USD MILLION)
TABLE 43 MARKET FOR ENVIRONMENTAL MONITORING, BY APPLICATION, 2015–2024 (USD MILLION)
TABLE 44 MARKET FOR ENERGY & POWER, BY REGION, 2015–2024 (USD MILLION)
TABLE 45 MARKET IN ENERGY & POWER, BY APPLICATION, 2015–2024 (USD MILLION)
TABLE 46 MARKET FOR ELECTRONICS AND APPLIANCE, BY REGION, 2015–2024 (USD MILLION)
TABLE 47 MARKET FOR ELECTRONICS AND APPLIANCE, BY APPLICATION, 2015–2024 (USD MILLION)
TABLE 48 MARKET FOR EDUCATION AND RESEARCH, BY REGION, 2015–2024 (USD MILLION)
TABLE 49 MARKET FOR EDUCATION AND RESEARCH, BY APPLICATION, 2015–2024 (USD MILLION)
TABLE 50 ACOUSTIC CAMERA MARKET, BY REGION, 2015–2024 (USD MILLION)
TABLE 51 MARKET IN NORTH AMERICA, BY INDUSTRY, 2015–2024 (USD MILLION)
TABLE 52 ACOUSTC CAMERA MARKET IN NORTH AMERICA, BY COUNTRY, 2015–2024 (USD MILLION)
TABLE 53 MARKET IN EUROPE, BY INDUSTRY, 2015–2024 (USD MILLION)
TABLE 54 MARKET IN EUROPE, BY COUNTRY, 2015–2024 (USD MILLION)
TABLE 55 MARKET IN APAC, BY INDUSTRY, 2015–2024 (USD MILLION)
TABLE 56 MARKET IN APAC, BY COUNTRY, 2015–2024 (USD MILLION)
TABLE 57 MARKET IN ROW, BY INDUSTRY, 2015–2024 (USD MILLION)
TABLE 58 MARKET IN ROW, BY REGION, 2015–2024 (USD MILLION)
TABLE 59 KEY MERGERS AND ACQUISITIONS
LIST OF FIGURES (39 FIGURES)
FIGURE 1 ACOUSTIC CAMERA MARKET SEGMENTATION
FIGURE 2 MARKET: RESEARCH DESIGN
FIGURE 3 MARKET SIZE ESTIMATION METHODOLOGY: BOTTOM-UP APPROACH
FIGURE 4 MARKET SIZE ESTIMATION METHODOLOGY: TOP-DOWN APPROACH
FIGURE 5 DATA TRIANGULATION
FIGURE 6 ASSUMPTIONS FOR THE RESEARCH STUDY
FIGURE 7 ACOUSTIC CAMERA MARKET SIZE (2015–2024)
FIGURE 8 AUTOMOTIVE INDUSTRY TO HOLD LARGEST SIZE OF MARKET BY 2024
FIGURE 9 MARKET, BY MEASUREMENT TYPE (2019 VS. 2024): BEAMFORMING MEASUREMENT TYPE TO HOLD LARGEST MARKET SIZE FROM 2019 TO 2024
FIGURE 10 2D ARRAY TYPE ACOUSTIC CAMERA HELD LARGER SHARE IN MARKET IN 2018
FIGURE 11 NOISE SOURCE IDENTIFICATION APPLICATION TO DOMINATE MARKET DURING FORECAST PERIOD
FIGURE 12 EUROPE ACCOUNTED FOR LARGEST SHARE OF MARKET IN 2018
FIGURE 13 INCREASING DEMAND FOR ACOUSTIC CAMERA IN APAC DRIVING MARKET GROWTH
FIGURE 14 ACOUSTIC CAMERA MARKET FOR INTENSITY MEASUREMENT TYPE TO GROW AT HIGHEST CAGR DURING FORECAST PERIOD
FIGURE 15 INFRASTRUCTURE INDUSTRY TO HOLD LARGEST SHARE OF MARKET IN EUROPE IN 2024
FIGURE 16 NOISE SOURCE IDENTIFICATION APPLICATION TO HOLD LARGEST SHARE OF MARKET DURING FORECAST PERIOD
FIGURE 17 US HELD LARGEST SHARE OF MARKET IN 2018
FIGURE 18 MARKET DYNAMICS OF MARKET
FIGURE 19 VALUE CHAIN ANALYSIS: MAJOR VALUE ADDED DURING ORIGINAL EQUIPMENT MANUFACTURING PHASE
FIGURE 20 MARKET, BY ARRAY TYPE
FIGURE 21 2D ARRAY TYPE TO HOLD LARGER SIZE OF MARKET BY 2024
FIGURE 22 RING ARRAY TYPE TO HOLD LARGEST SIZE OF 2D ARRAY TYPE MARKET BY 2024
FIGURE 23 MARKET, BY MEASUREMENT TYPE
FIGURE 24 FAR-FIELD MEASUREMENT TYPE TO HOLD LARGER SIZE OF MARKET BY 2024
FIGURE 25 MARKET, BY APPLICATION
FIGURE 26 NOISE SOURCE IDENTIFICATION APPLICATION TO HOLD LARGEST SIZE OF MARKET BY 2024
FIGURE 27 MARKET, BY INDUSTRY
FIGURE 28 AUTOMOTIVE TO HOLD LARGEST SIZE OF MARKET BY 2024
FIGURE 29 ACOUSTIC CAMERA APPLICATIONS FOR AEROSPACE
FIGURE 30 ACOUSTIC CAMERA APPLICATIONS FOR INDUSTRIAL
FIGURE 31 GEOGRAPHIC SNAPSHOT (2019–2024): ACOUSTIC CAMERA MARKET TO WITNESS SIGNIFICANT GROWTH IN EUROPEAN COUNTRIES DURING FORECAST PERIOD
FIGURE 32 NORTH AMERICA: MARKET SNAPSHOT
FIGURE 33 EUROPE: MARKET SNAPSHOT
FIGURE 34 APAC: MARKET SNAPSHOT
FIGURE 35 COMPANIES IN MARKET ADOPTED MERGER, ACQUISITION, AND PARTNERSHIP AS KEY GROWTH STRATEGIES FROM 2016 TO 2018
FIGURE 36 LIST OF MAJOR ACOUSTIC CAMERA MANUFACTURERS
FIGURE 37 MARKET EVALUATION FRAMEWORK
FIGURE 38 ACOUSTIC CAMERA MARKET (GLOBAL) COMPETITIVE LEADERSHIP MAPPING, 2018
FIGURE 39 BRUEL & KJAER: COMPANY SNAPSHOT
The study involved 4 major activities in estimating the current market size for acoustic camera. Exhaustive secondary search has been done to collect information on the market, peer market, and parent market. To validate these findings, assumptions, and sizing with industry experts across the value chain through primary research have been the next steps. The top-down and bottom-up approaches have been employed to estimate the complete market size. After that the market breakdown and triangulation procedures have been used to estimate the market size of subsegments.
Secondary Research
In the secondary research process, to identify and collect information for this study, various secondary sources such as Hoovers, Bloomberg BusinessWeek, and Dun & Bradstreet have been referred to. These secondary sources included annual reports, press releases and investor presentations of companies, white papers, certified publications, articles by recognized authors, gold standard and silver standard websites, regulatory bodies, trade directories, and databases.
Primary Research
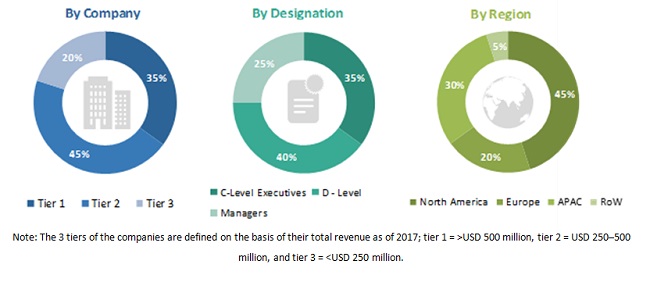
The acoustic camera market comprises several stakeholders, such as microphone manufacturers, acoustic camera manufacturers, system integrators, end-user industries, industrial associations, and regulatory bodies. The demand side of this market is characterized by the adoption of automation in industries such as automotive, aerospace, industrial, infrastructure, education & research, and others. Various primary sources from both the supply and demand sides of the market have been interviewed to obtain qualitative and quantitative information. The breakdown of primary respondents has been provided below.
To know about the assumptions considered for the study, download the pdf brochure
Market Size Estimation
Both top-down and bottom-up approaches have been used to estimate and validate the total size of the acoustic camera market. These methods have also been used extensively to estimate the size of various subsegments in the market. The research methodology used to estimate the market size is as follows:
- Key industry players have been identified through extensive secondary research.
- The market size of industries, in terms of value, has been determined through primary and secondary research processes.
- All percentage shares, splits, and breakdowns have been determined using secondary sources and verified through primary sources.
Data Triangulation
After arriving at the overall market size—using the market size estimation processes as explained above—the market has been split into several segments and subsegments. To complete the overall market engineering process and arrive at the exact statistics of each market segment and subsegment, the data triangulation and market breakdown procedures have been employed, wherever applicable. The data has been triangulated by studying various factors and trends from both the demand and supply sides in the automotive, aerospace, industrial, infrastructure, and other related industries.
Report Objectives
- To describe and forecast the acoustic camera market, in terms of value and volume, by array type, measurement type, application, and industry
- To describe and forecast the acoustic camera market, in terms of value, by region—North America, Asia Pacific (APAC), Europe, Rest of the World (RoW)
- To provide detailed information regarding major factors influencing growth (drivers, restraints, opportunities, and challenges)
- To study the complete value chain of acoustic camera and analyze current and future market trends
- To strategically analyze the micromarkets with respect to individual growth trends, prospects, and contributions to the overall market
- To analyze opportunities in the market for stakeholders by identifying high-growth segments of the acoustic camera ecosystem
- To strategically profile key players and comprehensively analyze their market position in terms of ranking and core competencies, along with detailing competitive landscape for market leaders
- To benchmark players in the market using the proprietary competitive leadership mapping, which analyzes market players on various parameters within broad categories of business and product strategies
- To analyze strategic approaches such as product launches, acquisitions, collaborations, contracts, agreements, expansions and partnerships in the acoustic camera market
Available Customizations:
With the given market data, MarketsandMarkets offers customizations according to the companies’ specific needs. The following customization options are available for the report:
Geographic Analysis
- Further breakdown of geography segment, by country
Company Information
- Detailed analysis and profiling of additional market players based on various blocks of the value chain


Growth opportunities and latent adjacency in Acoustic Camera Market