All-Flash Array Market by Flash Media (Custom Flash Module (CFM) and Solid-State Drive (SSD)), Storage Architecture/Access Pattern (File, Object, and Block), Industry (Enterprise, Government, cloud, and Telecomm), and Geography - Global Forecast to 2024-2033


The global all-flash array market was valued at USD 19.23 billion in 2024 and is estimated to reach USD 73.10 billion by 2033, at a CAGR of 16.0% between 2025 and 2033.
The growth of the all-flash array (AFA) market is being driven by the rising demand for high-performance, low-latency storage solutions across enterprises and data centers. Increasing adoption of cloud computing, big data analytics, and AI workloads is pushing organizations to upgrade from traditional HDD-based storage to faster, more reliable flash-based systems. Additionally, the need for efficient data management, reduced power consumption, and enhanced scalability is fueling AFA deployment. Growing investments by hyperscale cloud providers and the shift toward digital transformation initiatives are further accelerating market expansion.

An all-flash array (AFA) is a storage system that uses only flash memory drives, such as solid-state drives (SSDs), to store and manage data, replacing traditional hard disk drives (HDDs). AFAs deliver significantly higher performance, lower latency, and greater reliability, making them ideal for data-intensive applications, real-time analytics, and enterprise workloads. With features like deduplication, compression, and automated tiering, all-flash arrays optimize storage efficiency while supporting scalability, energy efficiency, and simplified data management in modern IT environments.
Market by Storage Architecture / Access Pattern
Block
Block storage dominates the all-flash array market due to its high performance, low latency, and efficient handling of structured data for enterprise applications. It is widely used in databases, virtualization, and transaction-intensive workloads where fast, reliable access to fixed-size data blocks is critical. The architecture’s ability to deliver predictable performance, ease of integration with existing IT environments, and support for mission-critical applications has helped it maintain a significant market share across data centers, enterprises, and cloud deployments globally.
Object
Object storage is expected to grow rapidly in the all-flash array market due to its scalability, cost-efficiency, and suitability for unstructured data such as multimedia, backups, and big data analytics. Its architecture enables efficient management of massive datasets, simplified replication, and easy integration with cloud-native applications. As organizations increasingly focus on data-intensive workloads, AI-driven analytics, and long-term storage solutions, object-based all-flash arrays are gaining traction for their flexibility, durability, and ability to support modern enterprise and cloud storage needs.
Market by Flash Media
SSD
Solid-state drives (SSDs) hold the largest market share in the all-flash array segment, driven by their high-speed performance, reliability, and energy efficiency. SSDs enable rapid data access, reduced latency, and consistent throughput for enterprise applications, virtualization, and AI workloads. Their ability to handle heavy I/O operations while maintaining durability and lower power consumption makes them the preferred choice for data centers and cloud providers. The widespread availability of cost-effective SSDs has further reinforced their dominance in the market.
CFMs
Computational flash memory (CFM) is expected to grow at a high rate in the all-flash array market due to its ability to perform processing directly within the storage device, reducing data movement and enhancing performance for data-intensive workloads. CFMs are particularly suitable for AI, analytics, and real-time processing applications, offering improved efficiency and lower latency. As organizations seek faster insights and scalable, high-performance storage solutions, the adoption of CFM-based all-flash arrays is gaining momentum across enterprises and hyperscale data centers globally.
Market by Geography
Geographically, the all-flash array market is witnessing dynamic growth across North America, Europe, Asia Pacific, and the Rest of the World (RoW). North America leads the market, driven by widespread deployment of hyperscale data centers, strong investments in cloud computing, AI workloads, and the need for high-performance, low-latency storage solutions across enterprises. Europe’s growth is fueled by digital transformation initiatives, adoption of AI and big data analytics, and stringent data protection regulations. Asia Pacific is expanding rapidly due to growing IT infrastructure, cloud adoption, and enterprise modernization efforts, while RoW is expected to register the highest growth rate as emerging markets increasingly invest in scalable, energy-efficient, and high-speed storage solutions to support business continuity and real-time data processing.
Market Dynamics
Driver: Increasing adoption of cloud computing and AI workloads
The growing adoption of cloud computing and AI workloads is a major driver for the all-flash array market. Organizations are increasingly relying on cloud platforms for scalable, on-demand computing, while AI and machine learning applications require high-speed, low-latency storage to process large volumes of data in real time. All-flash arrays offer the performance and reliability needed to support these advanced workloads, enabling faster data access, reduced response times, and enhanced operational efficiency. This trend is accelerating investments in AFA solutions across enterprises and hyperscale data centers globally.
Restraint: Concerns over data security and compliance
Data security and regulatory compliance pose significant restraints on the adoption of all-flash arrays. Enterprises handling sensitive information must ensure that storage solutions meet strict security standards, including encryption, access control, and compliance with regional data protection regulations. Concerns over potential data breaches, unauthorized access, and data loss make organizations cautious about migrating critical workloads to AFAs. Additionally, navigating complex compliance frameworks across different countries can increase operational overhead, slowing down deployment decisions and impacting the overall adoption rate of all-flash storage solutions.
Opportunity: Growing adoption in enterprise applications and big data analytics
The increasing use of enterprise applications and big data analytics presents substantial growth opportunities for the all-flash array market. Modern applications, such as ERP, CRM, and AI-driven analytics platforms, generate massive amounts of data requiring rapid processing and storage. All-flash arrays offer high throughput, low latency, and efficient data management, making them ideal for such environments. As organizations seek to leverage insights from real-time analytics for competitive advantage, the demand for AFAs in data-intensive applications is set to grow, providing vendors with opportunities to expand their offerings and penetrate new enterprise segments.
Challenge: Rapid technological changes and product obsolescence
Rapid technological advancements and frequent product obsolescence are key challenges for the all-flash array market. Storage vendors continually innovate to offer higher capacity, improved performance, and new features, which can render existing systems outdated quickly. Enterprises face pressure to continuously upgrade their infrastructure to remain competitive, leading to high replacement costs and potential underutilization of existing investments. Keeping pace with evolving storage technologies, such as NVMe, software-defined storage, and next-generation flash media, requires strategic planning and ongoing investments, posing challenges for both vendors and end-users.
Future Outlook
Between 2025 and 2033, the all-flash array market is expected to witness substantial growth as enterprises increasingly demand high-performance, low-latency storage to support digital transformation, AI, and cloud-native applications. Advances in NVMe technology, software-defined storage, and integrated data management solutions will drive broader adoption, while hybrid and scalable AFA architectures will enable cost-efficient expansion. Growing investments by hyperscale cloud providers, coupled with the rising need for real-time analytics and big data processing, will further accelerate market penetration. As organizations prioritize speed, reliability, and energy efficiency, AFAs will become central to modern IT infrastructure.
Key Market Players
Top all-flash array companies Dell Inc. (US), HP Development Company, L.P. (US), NetApp (US), Pure Storage, Inc. (US), IBM (US).
Key Questions addressed in this report:
- What are the global trends in demand for the market?
- What are the upcoming technologies/product areas that will have a significant impact on the market in the future?
- What will be the revenue pockets for the market players in the next 6 years?
- What are the prime strategies followed by key players in the market?
 Exclusive indicates content/data unique to MarketsandMarkets and not available with any competitors.
Table of Contents
1 Introduction (Page No. - 15)
1.1 Study Objective
1.2 Market Definition
1.3 Study Scope
1.3.1 Markets Covered
1.3.2 Years Considered
1.4 Currency
1.5 Limitations
1.6 Stakeholders
2 Research Methodology (Page No. - 18)
2.1 Research Data
2.1.1 Secondary Data
2.1.1.1 List of Major Secondary Sources
2.1.1.2 Secondary Sources
2.1.2 Primary Data
2.1.2.1 Primary Interviews With Experts
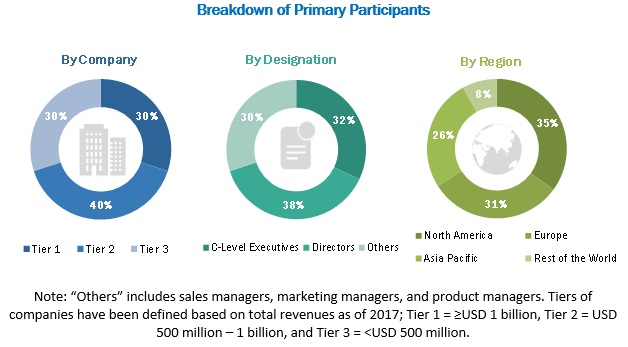
2.1.2.2 Breakdown of Primaries
2.1.2.3 Key Data From Primary Sources
2.2 Secondary and Primary Research
2.2.1 Key Industry Insights
2.3 Market Size Estimation
2.3.1 Bottom-Up Approach
2.3.1.1 Approach for Capturing the Market Size By Bottom-Up Analysis (Demand Side)
2.3.1.2 Approach for Capturing Market Size Considering Various Players in Value Chain of All-Flash Array Market
2.3.2 Top-Down Approach
2.3.2.1 Approach for Capturing the Market Size By Top-Down Analysis (Supply Side)
2.4 Market Breakdown and Data Triangulation
2.5 Research Assumptions
3 Executive Summary (Page No. - 28)
4 Premium Insights (Page No. - 33)
4.1 Attractive Opportunities in All-Flash Array Market (2018–2023)
4.2 Custom Flash Modules (CFM) All-Flash Array Market, By Industry Vertical
4.3 All-Flash Array Market, By Storage Architecture/Access Pattern
4.4 Market for Government Industry, By Region
4.5 APAC All-Flash Array Market for BFSI, By Country
5 Market Overview (Page No. - 36)
5.1 Introduction
5.2 Market Dynamics
5.2.1 Drivers
5.2.1.1 Increasing Use in Data Centers
5.2.1.2 Easy to Manage, Install, and Maintain
5.2.2 Restraints
5.2.2.1 Limited Write Cycles
5.2.3 Opportunities
5.2.3.1 Increasing Need for Real-Time Data Processing
5.2.3.2 Increasing Deployment of AFA Storage in Artificial Intelligence (Ai) and Machine Learning (Ml) Applications
5.2.4 Challenges
5.2.4.1 Issues Related to Performance and Drive Failure
5.3 Value Chain Analysis
6 All-Flash Array Market, By Storage Architecture/ Access Pattern (Page No. - 44)
6.1 Introduction
6.2 File
6.2.1 Exponential Growth of Volume of Data is Driving the Adoption of File-Based Storage Systems
6.3 Object
6.3.1 Object-Based Storage is Expected to Grow at Highest Rate
6.4 Block
6.4.1 Block Based Storage Hold A Larger Share in the AFA Storage Market
7 All-Flash Array Market By Flash Media (Page No. - 47)
7.1 Introduction
7.2 Custom Flash Modules (CFM)
7.2.1 Improved Performance and High Density are Expected to Drive the Growth of the CFM-Based AFA Market
7.3 Solid-State Drives (SSD)
7.3.1 SSD-Based AFA Market to Dominate the Flash Media Type Market
8 All-Flash Array Market, By Industry Vertical (Page No. - 53)
8.1 Introduction
8.2 Enterprise
8.2.1 The Deployment of AFA in Enterprises Aids in Smoother Data Operations
8.3 Banking, Financial Services, and Insurance (BFSI)
8.3.1 BFSI Industry Accounted for the Largest Size of the AFA Market
8.4 Healthcare
8.4.1 High-Powered Analytics and Telemedicine Capabilities are Driving the Healthcare Industry for the AFA Market
8.5 Media & Entertainment
8.5.1 Media & Entertainment Ot Grow at A Faster Rate in the AFA Market
8.6 Retail
8.6.1 Advent of Online Retailers is Boosting the All-Flash Array Market in Retail Industry
8.7 Others
8.7.1 AFA Storage Products are Designed to Handle Vital Security Challenges in Industries Such as Energy and Aerospace and Defense
8.8 Government
8.8.1 Governments Worldwide Have Adopted Digitization and Data Analytics Technologies to Improve Their Strategic Planning
8.9 Cloud
8.1 Telecom
8.10.1 Big Data Analytics is the Major Emerging Opportunity for the Growth of All-Flash Array Market in Telecom Industry
9 Geographic Analysis (Page No. - 66)
9.1 Introduction
9.2 North America
9.2.1 US
9.2.1.1 US Accounted for the Largest Market Size in the AFA Market in North America
9.2.2 Canada
9.2.2.1 AFA are Adopted in Canada to Address Effective Data Management
9.2.3 Mexico
9.2.3.1 Mexico is Expected to Witness the Highest Growth Rate in the AFA Market in North America
9.3 Europe
9.3.1 UK
9.3.1.1 UK Accounted for the Major Share in the AFA Market in Europe
9.3.2 France
9.3.2.1 Increasing Number of Data Centers is Expected to Boost the AFA Market in France
9.3.3 Germany
9.3.3.1 Increasing Use of Storage Devices is Driving the German Market
9.3.4 Rest of Europe
9.3.4.1 Rest of Europe an Countries are Expected to Witness Highest Growth of AFA Market in Europe
9.4 Asia Pacific
9.4.1 China
9.4.1.1 China Accounted for the Largest Share of the Asia Pacific AFA Market
9.4.2 Australia
9.4.2.1 Increasing Demand of Next Generation Storage System in BFSI Sector is Driving the AFA Market in Australia
9.4.3 Japan
9.4.3.1 Growing Sme Market is Primarily Driving the Growth of the AFA Storage Market in Japan.
9.4.4 South Korea
9.4.4.1 The Growing IoT and Big Data Analytics is Driving the Growth of the AFA Market in South Korea
9.4.5 India
9.4.5.1 Cloud Storage has A High Potential in the Indian All-Flash Array Market
9.4.6 Rest of APAC
9.4.6.1 Rest of APAC Countries to Have the Highest Growth in AFA Market in APAC
9.5 RoW
9.5.1 Middle East and Africa
9.5.1.1 The UAE is an Established Market for Next Generation Storage Technologies in Middle East and Africa
9.5.2 South America
9.5.2.1 Healthcare, Banking, Financial Services, and Retail Have A Huge Potential in the AFA Market in South America
10 Competitive Landscape (Page No. - 96)
10.1 Introduction
10.2 Ranking Analysis
10.3 Competitive Leadership Mapping
10.3.1 Visionary Leaders
10.3.2 Innovators
10.3.3 Dynamic Differentiators
10.3.4 Emerging Companies
10.4 Competitive Scenario
10.4.1 Product Launch, Development, and Deployment
10.4.2 Exhibition and Recognition
10.4.3 Partnership, Agreement, and Collaboration
10.4.4 Merger and Acquisition
11 Company Profiles (Page No. - 104)
11.1 Key Players
(Business Overview, Products, Solutions, and Services Offered, Recent Developments, Key Relationships, SWOT Analysis, and MnM View)*
11.1.1 Dell Technologies
11.1.2 NetApp
11.1.3 Hewlett Packard Enterprise (HPE)
11.1.4 Pure Storage
11.1.5 IBM
11.1.6 Huawei
11.1.7 Western Digital Corporation
11.1.8 Hitachi
11.1.9 Kaminario
11.1.10 Micron
* Business Overview, Products, Solutions, and Services Offered, Recent Developments, Key Relationships, SWOT Analysis, and MnM View Might Not Be Captured in Case of Unlisted Companies.
11.2 Other Key Companies
11.2.1 Oracle
11.2.2 Cisco
11.2.3 Fujitsu
11.2.4 Tintri
11.2.5 Violin Systems
11.2.6 Nutanix
11.2.7 E8 Storage
11.2.8 X-IO Technologies
11.2.9 Vexata
11.2.10 Echostreams
12 Appendix (Page No. - 136)
12.1 Insights From Industry Experts
12.2 Discussion Guide
12.3 Knowledge Store: Marketsandmarkets’ Subscription Portal
12.4 Available Customizations
12.5 Related Reports
12.6 Author Details
List of Tables (67 Tables)
Table 1 All-Flash Array Market, By Storage Architecture/Access Pattern, 2016–2023 (USD Million)
Table 2 Market, By Flash Media Type, 2016–2023 (USD Billion)
Table 3 CFM Market, By Industry Vertical, 2016–2023 (USD Million)
Table 4 CFM Market, By Enterprise, 2016–2023 (USD Million)
Table 5 CFM Market, By Enterprise, 2016–2023 (USD Million)
Table 6 SSD Based AFA Market, By Industry Vertical, 2016–2023 (USD Million)
Table 7 SSD Based AFA Market, By Industry Vertical, 2016–2023 (USD Million)
Table 8 SSD Based AFA Market, By Industry Vertical, 2016–2023 (USD Million)
Table 9 Market, By Industry Vertical, 2016–2023 (USD Million)
Table 10 Market, By Enterprise, 2016–2023 (USD Million)
Table 11 Enterprise Market, By Region, 2016–2023 (USD Million)
Table 12 BFSI Market, By Region, 2016–2023 (USD Million)
Table 13 Healthcare Market, By Region, 2016–2023 (USD Million)
Table 14 Media & Entertainment Market, By Region, 2016–2023 (USD Million)
Table 15 Retail All-Flash Array Market, By Region, 2016–2023 (USD Million)
Table 16 Others Market, By Region, 2016–2023 (USD Million)
Table 17 Government Market, By Region, 2016–2023 (USD Million)
Table 18 Market, By Cloud, 2016–2023 (USD Million)
Table 19 Market, By Cloud, 2016–2023 (USD Million)
Table 20 Telecom Market, By Region, 2016–2023 (USD Million)
Table 21 Market, By Region, 2016–2023 (USD Billion)
Table 22 North America Market, By Country, 2016–2023 (USD Million)
Table 23 North America Market for Enterprise, By Country, 2016–2023 (USD Million)
Table 24 North America Market for BFSI, By Country, 2016–2023 (USD Million)
Table 25 North America Market for Healthcare, By Country, 2016–2023 (USD Million)
Table 26 North America Market for Media & Entertainment, By Country, 2016–2023 (USD Million)
Table 27 North America Market for Retail, By Country, 2016–2023 (USD Million)
Table 28 North America Market for Others, By Country, 2016–2023 (USD Million)
Table 29 North America Market for Government, By Country, 2016–2023 (USD Million)
Table 30 North America Market for Cloud Service Providers, By Country, 2016–2023 (USD Million)
Table 31 North America Market for Telecom, By Country, 2016–2023 (USD Million)
Table 32 Europe Market, By Country, 2016–2023 (USD Million)
Table 33 Europe Market for Enterprise, By Country, 2016–2023 (USD Million)
Table 34 Europe Market for BFSI, By Country, 2016–2023 (USD Million)
Table 35 Europe Market for Healthcare, By Country, 2016–2023 (USD Million)
Table 36 Europe Market for Media & Entertainment, By Country, 2016–2023 (USD Million)
Table 37 Europe Market for Retail, By Country, 2016–2023 (USD Million)
Table 38 Europe Market for Others, By Country, 2016–2023 (USD Million)
Table 39 Europe Market for Government, By Country, 2016–2023 (USD Million)
Table 40 Europe Market for Cloud Service Providers, By Country, 2016–2023 (USD Million)
Table 41 Europe Market for Telecom, By Country, 2016–2023 (USD Million)
Table 42 APAC Market, By Country, 2016–2023 (USD Million)
Table 43 APAC Market for Enterprise, By Country, 2016–2023 (USD Million)
Table 44 APAC Market for BFSI, By Country, 2016–2023 (USD Million)
Table 45 APAC Market for Healthcare, By Country, 2016–2023 (USD Million)
Table 46 APAC Market for Media & Entertainment, By Country, 2016–2023 (USD Million)
Table 47 APAC Market for Retail, By Country, 2016–2023 (USD Million)
Table 48 APAC Market for Others, By Country, 2016–2023 (USD Million)
Table 49 APAC Market for Government, By Country, 2016–2023 (USD Million)
Table 50 APAC Market for Cloud Service Providers, By Country, 2016–2023 (USD Million)
Table 51 APAC Market for Telecom, By Country, 2016–2023 (USD Million)
Table 52 RoW Market, By Geography, 2016–2023 (USD Million)
Table 53 RoW Market for Enterprise, By Geography, 2016–2023 (USD Million)
Table 54 RoW Market for BFSI, By Geography, 2016–2023 (USD Million)
Table 55 RoW Market for Healthcare, By Geography, 2016–2023 (USD Million)
Table 56 RoW Market for Media & Entertainment, By Geography, 2016–2023 (USD Million)
Table 57 RoW Market for Retail, By Geography, 2016–2023 (USD Million)
Table 58 RoW Market for Others, By Geography, 2016–2023 (USD Million)
Table 59 RoW Market for Government, By Geography, 2016–2023 (USD Million)
Table 60 RoW All-Flash Array Market for Cloud Service Providers, By Geography, 2016–2023 (USD Million)
Table 61 RoW Market for Telecomm, By Geography, 2016–2023 (USD Million)
Table 62 Ranking of Top 5 Players in Market (2017)
Table 63 AlMarket Share Analysis of Top 5 Players in Market (2017)
Table 64 Product Launch, Development, and Deployment (2015–2018)
Table 65 Expansion and Recognition (2016–2018)
Table 66 Partnership, Agreement, and Collaboration (2015–2018)
Table 67 Merger and Acquisition (2016–2019)
List of Figures (38 Figures)
Figure 1 All-Flash Array Market: Research Design
Figure 2 Market Size Estimation Methodology: Bottom-Up Approach
Figure 3 Market Size Estimation Methodology: Top-Down Approach
Figure 4 Data Triangulation
Figure 5 SSD-Based AFA Market to Hold Larger Size By 2023
Figure 6 File Based Storage to Hold Larger Size of Market Based on Storage Architecture/Access Pattern By 2023
Figure 7 Enterprise to Hold Largest Size of AFA Market Based on End-User Industry By 2023 (USD Million)
Figure 8 North America Held Largest Share of Market in 2017
Figure 9 Increasing Need for Real-Time Data Processing Drives Market Growth
Figure 10 Enterprise to Hold Largest Market for CFM-Based AFA By 2023
Figure 11 Block Based Storage to Hold Largest Market Size By 2023
Figure 12 North America to Account for Largest Size of Market for Government Industry By 2023
Figure 13 China to Hold Largest Share of Market for BFSI Industry in APAC By 2023
Figure 14 Increasing Use of AFA in Data Centers is Driving the Growth of Market
Figure 15 Growth in Data Centre
Figure 16 Global Data Centre Traffic Growth
Figure 17 Value Chain: All-Flash Array Market, 2017
Figure 18 Object Storage to Grow at Highest CAGR in AFA Market for Storage Architecture/Access Pattern During Forecast Period
Figure 19 SSD to Hold A Larger Share of Market, for Flash Media in Terms of Value, By 2023
Figure 20 Cloud Service Providers to Witness Highest CAGR in AFA Market During Forecast Period
Figure 21 RoW to Witness Highest CAGR in Retail Market During Forecast Period
Figure 22 North America Holds Highest Share in Telecom Market
Figure 23 Geographic Snapshot of Market, 2018–2023
Figure 24 Market Snapshot in North America
Figure 25 Market Snapshot in Europe
Figure 26 Market Snapshot in APAC
Figure 27 Market in RoW
Figure 28 Product Launch and Development as Key Strategy Adopted By Players in Market (2015–2018)
Figure 29 Market (Global) Competitive Leadership Mapping, 2017
Figure 30 Dell Technologies: Company Snapshot
Figure 31 NetApp: Company Snapshot
Figure 32 Hewlett Packard Enterprise: Company Snapshot
Figure 33 Pure Storage: Company Snapshot
Figure 34 IBM: Company Snapshot
Figure 35 Huawei: Company Snapshot
Figure 36 Western Digital: Company Snapshot
Figure 37 Hitachi: Company Snapshot
Figure 38 Micron: Company Snapshot
The study involved 4 major activities for estimating the current size of the AFA market. An exhaustive secondary research was done to collect information on the market, as well as its peer and parent markets. The next step was validating these findings, assumptions, and sizing with industry experts across the value chain through primary research. Both top-down and bottom-up approaches were employed to estimate the overall market size. Thereafter, market breakdown and data triangulation procedures were used to estimate the market size of segments and subsegments.
Secondary Research
In the secondary research process, various secondary sources have been referred to for identifying and collecting information important for this study. These secondary sources include The Storage Networking Industry Association (SINA), Universal Flash Storage Association, SD Association Journals, press releases, and financials of companies; white papers; and certified publications and articles from recognized authors, directories, and databases.
Primary Research
In the primary research process, various primary sources from both supply and demand sides have been interviewed to obtain qualitative and quantitative information important for this report. Primary sources from the supply side include industry experts such as CEOs, VPs, marketing directors, technology and innovation directors, and related executives from key companies and organizations operating in the AFA market. After complete market engineering (including calculations regarding market statistics, market breakdown, market size estimations, market forecasting, and data triangulation), extensive primary research has been conducted to gather information, as well as verify and validate the critical numbers arrived at.
To know about the assumptions considered for the study, download the pdf brochure
Market Size Estimation
In the complete market engineering process, both top-down and bottom-up approaches have been implemented, along with several data triangulation methods, to estimate and validate the size of the AFA market and other dependent submarkets listed in this report.
- Key players in the industry and markets have been identified through extensive secondary research.
- The industry’s supply chain and market size, in terms of value, have been determined through primary and secondary research processes.
- All percentage shares, splits, and breakdowns have been determined using secondary sources and verified through primary sources.
Data Triangulation
After arriving at the overall market size from the estimation process explained above, the overall market has been split into several segments and subsegments. To complete the overall market engineering process and arrive at exact statistics for all segments and subsegments, market breakdown and data triangulation procedures have been employed, wherever applicable. The data have been triangulated by studying various factors and trends identified from both demand and supply sides, in consumer electronics, enterprise & industrial, and healthcare. Along with this, the market size has been validated using both top-down and bottom-up approaches.
The following are the major objectives of the study.
- To describe and forecast the overall all-flash array market, in terms of value, segmented on the basis of architecture, type, flash media, and industry.
- To forecast the market size for various segments, by region—North America, Europe, Asia Pacific (APAC), and Rest of the World (RoW)
- To provide detailed information regarding the major factors (drivers, restraints, opportunities, and challenges) influencing the growth of the all-flash array market
- To provide all-flash array value chain analysis
- To strategically analyze the micromarkets1 with respect to individual growth trends, prospects, and contributions to the overall market
- To analyze opportunities in the overall all-flash array market for stakeholders by identifying high-growth segments
- To profile key players and comprehensively analyze their market ranking in terms of revenues and core competencies2 and provide details of the competitive landscape for all-flash array market leaders
- To analyze growth strategies such as contracts, mergers and acquisitions, product launches and developments, and research and development (R&D) in the overall all-flash array market
Available Customizations:
Based on the given market data, MarketsandMarkets offers customizations in the reports as per a client’s specific requirements. The available customization options are as follows:
- Detailed analysis and profiling of additional market players (up to 5)
- Geographic Analysis


Growth opportunities and latent adjacency in All-Flash Array Market