Non-volatile Memory Express (NVMe) Market by Product (SSDs, Servers, All-flash Arrays, Adapters), Deployment Location (On-premise, Remote, Hybrid), Communication Standard (Ethernet, Fibre Channel, InfiniBand), Vertical, and Region - Global Forecast to 2036


Non-volatile Memory Express (NVMe) Market Summary
The Non-volatile Memory Express (NVMe) Market was valued at approximately USD 68.5 billion in 2025 and is projected to reach USD 235.4 billion by 2036, expanding at a robust CAGR of 12.1% during the forecast period (2025–2036). The market is witnessing exponential growth as the demand for high-speed data processing and low-latency storage solutions accelerates across industries. This rapid expansion is fueled by the proliferation of artificial intelligence (AI), Internet of Things (IoT), cloud computing, and automation-driven workloads that require ultra-fast data access and processing capabilities. NVMe technology, designed to leverage the high-speed capabilities of PCIe interfaces, is becoming the backbone of modern data centers, enterprise storage systems, and high-performance computing environments. The shift toward digital transformation, combined with the growing adoption of edge computing and real-time analytics, is further propelling the demand for NVMe-based storage solutions globally.
Key Market Trends & Insights
The NVMe market is shaped by strong technological advancements and evolving enterprise storage requirements. North America currently dominates the market due to the presence of hyperscale data centers and early adoption of advanced storage technologies. Asia Pacific is the fastest-growing region, driven by rapid digitalization, expanding cloud infrastructure, and increasing investments in data centers. The enterprise SSD segment remains dominant, as organizations prioritize high-performance storage for AI and analytics workloads. Emerging trends include the adoption of NVMe over Fabrics (NVMe-oF), which enhances networked storage performance, and the integration of AI-driven storage management systems. Automation is playing a critical role in optimizing storage operations, reducing latency, and improving efficiency in data-intensive environments.
Market Size & Forecast
-
Base Year Market Size (2025): USD 68.5 Billion
-
Forecast Value (2036): USD 235.4 Billion
-
CAGR (2025–2036): 12.1%
-
Growth is driven by increasing demand for high-speed storage, rising adoption of AI and big data analytics, and expansion of cloud and hyperscale data centers.
Non-volatile Memory Express (NVMe) Market Top 10 key takeaway
-
The NVMe market is projected to grow at a strong CAGR of 12.1% through 2036.
-
North America leads due to advanced IT infrastructure and early adoption.
-
Asia Pacific is the fastest-growing region with expanding data center investments.
-
Enterprise SSDs dominate the product segment.
-
NVMe over Fabrics (NVMe-oF) is gaining significant traction.
-
AI-driven storage optimization is transforming data management.
-
Cloud computing and hyperscale data centers are major growth drivers.
-
Automation is improving storage efficiency and reducing latency.
-
Increasing demand for real-time analytics is boosting NVMe adoption.
-
Edge computing is creating new growth opportunities for NVMe solutions.
Product Insights
The enterprise NVMe SSD segment dominates the Non-volatile Memory Express market, primarily due to its ability to deliver ultra-low latency, high throughput, and scalability required for modern enterprise workloads. Organizations across sectors such as finance, healthcare, and e-commerce are increasingly adopting NVMe SSDs to support data-intensive applications, including AI, machine learning, and big data analytics. The superior performance of NVMe SSDs compared to traditional SATA and SAS-based storage solutions makes them the preferred choice for high-performance computing environments.
Consumer NVMe SSDs are also witnessing significant growth, driven by increasing demand for high-speed storage in personal computing, gaming, and content creation. Emerging product categories include NVMe-based storage arrays and composable infrastructure solutions, which allow organizations to dynamically allocate storage resources based on workload requirements. The integration of AI into storage devices is enabling predictive maintenance, performance optimization, and automated workload management, further enhancing the value proposition of NVMe products.
Technology / Component Insights
The NVMe market is driven by advancements in PCIe (Peripheral Component Interconnect Express) technology, which enables high-speed data transfer between storage devices and processors. The transition from PCIe 3.0 to PCIe 4.0 and PCIe 5.0 is significantly improving data transfer speeds and bandwidth, supporting the growing demands of AI and high-performance computing applications.
AI and machine learning are playing a crucial role in optimizing storage performance by enabling intelligent data placement, workload prioritization, and predictive analytics. IoT devices generate massive volumes of data that require real-time processing, making NVMe an ideal solution for edge computing environments. Cloud computing is further accelerating NVMe adoption, as hyperscale data centers require high-speed storage solutions to handle large-scale workloads.
Automation technologies are streamlining storage management processes, reducing operational complexity, and improving efficiency. Future innovation trends include the adoption of computational storage, where processing capabilities are integrated directly into storage devices, and the development of NVMe-based storage-class memory solutions that bridge the gap between memory and storage.
Application Insights
The data center segment represents the largest application area for NVMe technology, driven by the increasing demand for high-performance storage in cloud computing and enterprise IT environments. Hyperscale data centers, in particular, are adopting NVMe solutions to support AI workloads, real-time analytics, and large-scale data processing.
Other key application areas include enterprise storage, edge computing, and high-performance computing (HPC). In edge computing, NVMe enables low-latency data processing, which is critical for applications such as autonomous vehicles, smart cities, and industrial automation. The growing adoption of AI and IoT technologies is further expanding the scope of NVMe applications.
Future opportunities lie in the integration of NVMe with emerging technologies such as 5G, which will enable faster data transmission and real-time processing. The increasing demand for high-speed storage in sectors such as healthcare, finance, and media is expected to drive further growth in the NVMe market.
Regional Insights
North America dominates the NVMe market, supported by the presence of leading technology companies, advanced IT infrastructure, and significant investments in data center development. The region’s early adoption of AI, cloud computing, and big data analytics has created a strong demand for high-performance storage solutions.
Europe is witnessing steady growth, driven by increasing digitalization, regulatory compliance requirements, and investments in data infrastructure. Asia Pacific is the fastest-growing region, fueled by rapid urbanization, expanding internet penetration, and growing demand for cloud services. Countries such as China and India are investing heavily in data center infrastructure, further boosting NVMe adoption.
-
North America leads due to hyperscale data centers and advanced infrastructure
-
Europe shows steady growth driven by digital transformation
-
Asia Pacific is the fastest-growing region
-
Government initiatives are supporting data infrastructure development
-
Increasing demand for cloud services is driving regional growth
Country-Specific Market Trends
In Asia Pacific, China is leading the NVMe market with a projected CAGR of 13.5%, driven by large-scale data center investments and government support for digital infrastructure. Japan is also witnessing strong growth at a CAGR of 11.8%, focusing on advanced computing and automation technologies.
In North America, the United States dominates the market, supported by major cloud service providers and technology companies, while Canada and Mexico are experiencing steady growth with CAGRs ranging from 10.2% to 11.0%. These countries are increasingly adopting NVMe solutions for enterprise and cloud applications.
In Europe, Germany and France are key contributors to market growth, with CAGRs of approximately 10.5% and 10.1%, respectively. These countries are investing in digital infrastructure and adopting advanced storage technologies to support industrial automation and data analytics.
-
China leads APAC with strong infrastructure investments
-
Japan focuses on advanced computing and automation
-
United States dominates North America market
-
Canada and Mexico show steady growth trends
-
Germany and France lead Europe in NVMe adoption
Key Non-volatile Memory Express (NVMe) Company Insights
The NVMe market is highly competitive, with leading companies focusing on innovation, AI integration, and strategic partnerships to strengthen their market position. Key players are investing in the development of high-performance NVMe SSDs, storage arrays, and software-defined storage solutions.
Major companies include Samsung Electronics, Intel Corporation, Western Digital Corporation, Micron Technology, SK hynix, Kioxia Holdings Corporation, Seagate Technology, Dell Technologies, Hewlett Packard Enterprise (HPE), and NetApp Inc. These companies are leveraging AI and automation to enhance storage performance, improve reliability, and deliver advanced data management capabilities.
-
Companies are investing in next-generation NVMe technologies
-
AI-driven storage solutions are a key focus area
-
Strategic partnerships are driving innovation
-
Cloud integration is enhancing product offerings
-
Expansion into emerging markets is a major growth strategy
Recent Developments
Recent developments in the NVMe market highlight the increasing focus on performance and innovation. In 2025, a leading semiconductor company launched a PCIe 5.0 NVMe SSD designed for AI and data center applications, offering significantly higher speeds and efficiency. Another major player introduced an AI-powered storage management platform that optimizes NVMe performance in real-time. Additionally, a strategic partnership between a cloud service provider and a storage solutions company aims to deploy NVMe-based infrastructure for next-generation data centers.
Market Segmentation
The Non-volatile Memory Express market is segmented based on product, technology/component, application, and region. By product, the market includes enterprise NVMe SSDs, consumer NVMe SSDs, and NVMe storage arrays, with enterprise SSDs holding the largest share. By technology, the market is segmented into PCIe 3.0, PCIe 4.0, PCIe 5.0, and NVMe over Fabrics (NVMe-oF). Application-wise, the market covers data centers, enterprise storage, edge computing, and high-performance computing. Regionally, the market is divided into North America, Europe, Asia Pacific, and Rest of the World.
-
Enterprise NVMe SSDs dominate the product segment
-
PCIe 4.0 and 5.0 are key technology segments
-
Data centers are the leading application area
-
Asia Pacific offers the highest growth potential
-
NVMe over Fabrics is gaining rapid adoption
The Non-volatile Memory Express (NVMe) market is poised for substantial growth through 2036, driven by the increasing demand for high-speed, low-latency storage solutions in the era of AI, IoT, and digital transformation. As data volumes continue to grow exponentially, NVMe technology will play a critical role in enabling real-time analytics, improving system performance, and supporting next-generation applications. The integration of AI and automation into storage systems will further enhance efficiency and scalability, making NVMe a strategic investment for businesses worldwide. With strong growth potential across regions and industries, the NVMe market is set to become a cornerstone of modern data infrastructure.
FAQs
1. What is the current market size of the NVMe market?
The NVMe market was valued at approximately USD 68.5 billion in 2025.
2. What is the expected growth rate of the market?
The market is expected to grow at a CAGR of 12.1% from 2025 to 2036.
3. What are the key drivers of market growth?
Key drivers include AI adoption, IoT expansion, cloud computing growth, and increasing demand for high-speed storage.
4. Which region dominates the NVMe market?
North America currently holds the largest market share.
5. Who are the key players in the market?
Major companies include Samsung Electronics, Intel Corporation, Western Digital Corporation, Micron Technology, and Seagate Technology.
To speak to our analyst for a discussion on the above findings, click Speak to Analyst
 Exclusive indicates content/data unique to MarketsandMarkets and not available with any competitors.
Table of Contents
1 Introduction (Page No. - 20)
1.1 Study Objectives
1.2 Market Definition and Scope
1.2.1 Inclusions and Exclusions
1.3 Study Scope
1.3.1 Markets Covered
1.3.2 Geographic Scope
1.3.3 Years Considered
1.4 Currency
1.5 Limitations
1.6 Stakeholders
2 Research Methodology (Page No. - 23)
2.1 Research Data
2.1.1 Secondary Data
2.1.1.1 Secondary Sources
2.1.2 Primary Data
2.1.2.1 Primary Sources
2.1.2.2 Key Industry Insights
2.1.2.3 Breakdown of Primary Interviews
2.1.3 Secondary and Primary Research
2.2 Market Size Estimation
2.2.1 Bottom-Up Approach
2.2.1.1 Approach for Capturing Market Size Using Bottom-Up Analysis (Demand Side)
2.2.2 Top-Down Approach
2.2.2.1 Approach for Capturing Market Share Using Top-Down Analysis (Supply Side)
2.3 Data Triangulation
2.4 Assumptions
3 Executive Summary (Page No. - 32)
4 Premium Insights (Page No. - 38)
4.1 Opportunities in NVMe Market
4.2 NVMe Market for SSDS, By Vertical, 2017–2025 (USD Million)
4.3 APAC NVMe Market, By Vertical and Country
4.4 NVMe Market for BFSI, By Region, 2017–2025 (USD Billion)
4.5 APAC NVMe Market, By Country
5 Market Overview (Page No. - 41)
5.1 Introduction
5.2 Market Dynamics
5.2.1 Drivers
5.2.1.1 Increasing Adoption of NVMe Technologies in SSDS, Servers, and Storage Appliances
5.2.1.2 Exponential Rise in Data Generation and Evolving Demand for Data Storage and Processing Infrastructure
5.2.1.3 Significant Performance Advancements Offered By NVMe
5.2.2 Restraints
5.2.2.1 Performance Problems Associated With Storage Software
5.2.3 Opportunities
5.2.3.1 Growing Adoption of NVMe for Big Data, IoT, Artificial Intelligence, and Blockchain
5.2.3.2 End-To-End NVMe Over Fabrics (NVMe-Of)
5.2.4 Challenges
5.2.4.1 Issues Related to Data Integrity and Data Protection
5.2.4.2 High Cost of NVMe
5.3 Value Chain Analysis
6 NVM Express Market, By Product (Page No. - 52)
6.1 Introduction
6.2 Solid-State Drives (SSDS)
6.2.1 NVMe SSDS Projected to Hold Largest Share in NVMe Market
6.2.1.1 2.5”
6.2.1.2 M.2
6.2.1.3 U.2 (SFF 8639)
6.2.1.4 FHHL and HHHL
6.3 Adapters
6.3.1 Growth of Hyper-Converged Infrastructure is Expected to Lead to Increase in Adoption of NVMe Adapters
6.4 All-Flash Arrays
6.4.1 All-Flash Arrays to Grow at Highest CAGR During Forecast Period
6.5 Servers
6.5.1 Increased Enterprise, Data Center, and Hci Applications of NVMe Servers to Drive Growth of Servers Segment
6.6 Others (I/O Accelerator Blocks, Switches, and Controllers)
6.6.1 Other Products Segment to Grow Steadily Due to Increased Adoption of NVMe-Based Servers and Storage Solutions
7 NVM Express Market, By Communication Standard (Page No. - 67)
7.1 Introduction
7.2 Ethernet
7.2.1 Ethernet to Hold Largest Market Size During Forecast Period
7.3 Fibre Channel
7.3.1 NVMe Over Fibre Channel Expected to Grow Steadily During Forecast Period
7.4 Infiniband
7.4.1 Infiniband Expected to Grow at Second-Highest CAGR
8 NVM Express Market, By Deployment Location (Page No. - 72)
8.1 Introduction
8.2 On-Premise
8.2.1 On-Premise Deployment to Hold Largest Share of NVMe Market During Forecast Period
8.3 Remote
8.3.1 Remote NVMe Deployments are Expected to Grow Steadily During Forecast Period
8.4 Hybrid
8.4.1 Hybrid Deployments are Expected to Grow at Highest CAGR During Forecast Period
9 NVM Express Market, By Vertical (Page No. - 77)
9.1 Introduction
9.2 Banking, Financial Services, and Insurance (BFSI)
9.2.1 BFSI Held Largest Share in NVMe Market in 2019
9.3 Consumer Goods & Retail
9.3.1 Emergence of E-Commerce and Online Retail is Leading to Increasing Adoption of NVMe Solutions
9.4 Telecommunications & Ites
9.4.1 Emerging Opportunities in Data Science and Analytics Leading to Growth of NVMe in the Telecommunications & Ites Vertical
9.5 Healthcare
9.5.1 Healthcare Vertical to Grow at Highest CAGR During Forecast Period
9.6 Energy
9.6.1 Increasing Adoption of Real-Time Analytics Leading to NVMe Market Growth in Energy Vertical
9.7 Government
9.7.1 Increasing Investments to Adopt Digitization and Analytics are Driving Adoption of NVMe
9.8 Education & Research
9.8.1 E-Learning is Driving NVMe Market Growth in Education & Research Vertical
9.9 Media & Entertainment
9.9.1 Increasing Adoption of NVMe Solutions By Media & Entertainment Firms Drives NVMe Market Growth in This Vertical
9.10 Manufacturing
9.10.1 Emergence of Iiot and Industry 4.O Driving NVMe Market Growth in Manufacturing Vertical
9.11 Business & Consulting
9.11.1 Need for Efficient Data Management and High-Performance Computing to Drive NVMe Market in Business & Consulting Vertical
9.12 Others
10 Geographic Analysis (Page No. - 104)
10.1 Introduction
10.2 North America
10.2.1 US
10.2.1.1 US Projected to Account for Largest Size of NVMe Market in North America
10.2.2 Canada
10.2.2.1 NVMe Market in Canada Projected to Grow Due to Increasing Need for Efficient Data Management
10.2.3 Mexico
10.2.3.1 NVMe Market in Mexico Projected to Grow at Highest CAGR During Forecast Period
10.3 Europe
10.3.1 UK
10.3.1.1 UK Held Largest Share of European NVMe Market in 2019
10.3.2 Germany
10.3.2.1 Increasing Use of Connected Devices and Requirement of Managing Large Datasets to Drive NVMe Demand in Germany
10.3.3 France
10.3.3.1 France Expected to Be the Fastest-Growing NVMe Market in Europe
10.3.4 Rest of Europe
10.4 APAC
10.4.1 China
10.4.1.1 China LED NVMe Market in APAC in 2019
10.4.2 Australia
10.4.2.1 Australian NVMe Market Expected to Grow at Highest Rate Among APAC Countries During Forecast Period
10.4.3 Japan
10.4.3.1 Increased Adoption of Next-Generation Technologies Expected to Contribute to Growth of NVMe Market in Japan
10.4.4 South Korea
10.4.4.1 Flourishing Consumer Electronics Industry and Presence of Key Manufacturers of NVMe Fuel NVMe Market Growth in South Korea
10.4.5 India
10.4.5.1 Big Data, IoT, and Other Digital and Virtualized Platforms to Trigger Adoption of NVMe in India
10.4.6 Rest of APAC
10.5 RoW
10.5.1 Middle East &Africa
10.5.1.1 Established Market of Advanced Storage in UAE Drives NVMe Demand in Middle East & Africa
10.5.2 South America
11 Competitive Landscape (Page No. - 139)
11.1 Overview
11.2 Ranking Analysis
11.3 Competitive Scenario
11.3.1 Product Launches and Developments
11.3.2 Partnerships, Agreements, and Collaborations
11.3.3 Mergers and Acquisitions
11.4 Competitive Leadership Mapping
11.4.1 Visionary Leaders
11.4.2 Dynamic Differentiators
11.4.3 Innovators
11.4.4 Emerging Companies
12 Company Profiles (Page No. - 146)
(Business Overview, Products Offered, Recent Developments, SWOT Analysis, and MnM View)*
12.1 Key Companies
12.1.1 Intel
12.1.2 Western Digital
12.1.3 Samsung
12.1.4 Dell EMC
12.1.5 Hewlett Packard Enterprise (HPE)
12.1.6 Broadcom
12.1.7 Micron Technology
12.1.8 Cisco
12.1.9 Toshiba
12.1.10 Netapp
12.2 Right-To-Win
12.3 Other Key Companies
12.3.1 IBM
12.3.2 Microchip Technology
12.3.3 Marvell
12.3.4 Seagate Technology
12.3.5 SK Hynix
12.3.6 Renesas Electronics
12.3.7 Mellanox
12.3.8 Pure Storage
12.3.9 Supermicro
12.3.10 Huawei
*Details on Business Overview, Products & Services Offered, Recent Developments, SWOT Analysis, and MnM View Might Not Be Captured in Case of Unlisted Companies.
13 Appendix (Page No. - 180)
13.1 Insights From Industry Experts
13.2 Discussion Guide
13.3 Knowledge Store: Marketsandmarkets’ Subscription Portal
13.4 Available Customizations
13.5 Related Reports
13.6 Author Details
List of Tables (119 Tables)
Table 1 Specifications for Sata-Based Ssd, Sas-Based Ssd, Pcie-Based Ssd, and NVMe-Based Ssd
Table 2 Comparison of Sata Based on Ahci With Pcie Based on NVMe Protocol
Table 3 Comparison of Price Per Gb of Various Protocols
Table 4 NVMe Market, By Product, 2017–2025 (USD Billion)
Table 5 NVMe SSDS Market, By Communication Standard, 2017–2025 (USD Million)
Table 6 NVMe SSDS Market, By Deployment Location, 2017–2025 (USD Million)
Table 7 NVMe SSDS Market, By Vertical, 2017–2025 (USD Million)
Table 8 NVMe SSDS Market, 2017–2025 (Units in Zettabytes)
Table 9 NVMe SSDS Market, By Form Factor, 2017–2025 (USD Million)
Table 10 NVMe Adapters Market, By Communication Standard, 2017–2025 (USD Million)
Table 11 NVMe Adapters Market, By Deployment Location, 2017–2025 (USD Million)
Table 12 NVMe Adapters Market, By Vertical, 2017–2025 (USD Million)
Table 13 NVMe All-Flash Arrays Market, By Communication Standard, 2017–2025 (USD Million)
Table 14 NVMe All-Flash Arrays Market, By Deployment Location, 2017–2025 (USD Million)
Table 15 NVMe All-Flash Arrays Market, By Vertical, 2017–2025 (USD Million)
Table 16 NVMe Servers Market, By Communication Standard, 2017–2025 (USD Million)
Table 17 NVMe Servers Market, By Deployment Location, 2017–2025 (USD Million)
Table 18 NVMe Servers Market, By Vertical, 2017–2025 (USD Million)
Table 19 Non-volatile Memory Express Market for Other Products, By Communication Standard, 2017–2025 (USD Million)
Table 20 Non-volatile Memory Express Market for Other Products, By Deployment Location, 2017–2025 (USD Million)
Table 21 Non-volatile Memory Express Market for Other Products, By Vertical, 2017–2025 (USD Million)
Table 22 Non-volatile Memory Express Market, By Communication Standard, 2017–2025 (USD Billion)
Table 23 NVMe Over Ethernet Market, By Product, 2017–2025 (USD Million)
Table 24 NVMe Over Fibre Channel Market, By Product, 2017–2025 (USD Million)
Table 25 NVMe Over Infiniband Market, By Product, 2017–2025 (USD Million)
Table 26 Non-volatile Memory Express Market, By Deployment Location, 2017–2025 (USD Billion)
Table 27 On-Premise NVMe Market, By Product, 2017–2025 (USD Million)
Table 28 Remote NVMe Market, By Product, 2017–2025 (USD Million)
Table 29 Hybrid NVMe Market, By Product, 2017–2025 (USD Million)
Table 30 Non-volatile Memory Express Market, By Vertical, 2017–2025 (USD Billion)
Table 31 Non-volatile Memory Express Market in BFSI Vertical, By Product, 2017–2025 (USD Million)
Table 32 Non-volatile Memory Express Market in BFSI Vertical, By Deployment Location, 2017–2025 (USD Million)
Table 33 Non-volatile Memory Express Market in BFSI Vertical, By Region, 2017–2025 (USD Million)
Table 34 Non-volatile Memory Express Market in Consumer Goods & Retail Vertical, By Product, 2017–2025 (USD Million)
Table 35 Non-volatile Memory Express Market in Consumer Goods & Retail Vertical, By Deployment Location, 2017–2025 (USD Million)
Table 36 Non-volatile Memory Express Market in Consumer Goods & Retail Vertical, By Region, 2017–2025 (USD Million)
Table 37 Non-volatile Memory Express Market in Telecommunications & Ites Vertical, By Product, 2017–2025 (USD Million)
Table 38 Non-volatile Memory Express Market in Telecommunications & Ites Vertical, By Deployment Location, 2017–2025 (USD Million)
Table 39 Non-volatile Memory Express Market in Telecommunications & Ites Vertical, By Region, 2017–2025 (USD Million)
Table 40 Non-volatile Memory Express Market in Healthcare Vertical, By Product, 2017–2025 (USD Million)
Table 41 Non-volatile Memory Express Market in Healthcare Vertical, By Deployment Location, 2017–2025 (USD Million)
Table 42 Non-volatile Memory Express Market in Healthcare Vertical, By Region, 2017–2025 (USD Million)
Table 43 NVMe Market in Energy Vertical, By Product, 2017–2025 (USD Million)
Table 44 Non-volatile Memory Express Market in Energy Vertical, By Deployment Location, 2017–2025 (USD Million)
Table 45 Non-volatile Memory Express Market in Energy Vertical, By Region, 2017–2025 (USD Million)
Table 46 Non-volatile Memory Express Market in Government Vertical, By Product, 2017–2025 (USD Million)
Table 47 Non-volatile Memory Express Market in Government Vertical, By Deployment Location, 2017–2025 (USD Million)
Table 48 Non-volatile Memory Express Market in Government Vertical, By Region, 2017–2025 (USD Million)
Table 49 Non-volatile Memory Express Market in Education & Research Vertical, By Product, 2017–2025 (USD Million)
Table 50 Market in Education & Research Vertical, By Deployment Location, 2017–2025 (USD Million)
Table 51 Market in Education & Research Vertical, By Region, 2017–2025 (USD Million)
Table 52 Market in Media & Entertainment Vertical, By Product, 2017–2025 (USD Million)
Table 53 Market in Media & Entertainment Vertical, By Deployment Location, 2017–2025 (USD Million)
Table 54 Market in Media & Entertainment Vertical, By Region, 2017–2025 (USD Million)
Table 55 Market in Manufacturing Vertical, By Product, 2017–2025 (USD Million)
Table 56 Market in Manufacturing Vertical, By Deployment Location, 2017–2025 (USD Million)
Table 57 Market in Manufacturing Vertical, By Region, 2017–2025 (USD Million)
Table 58 Market in Business & Consulting Vertical, By Product, 2017–2025 (USD Million)
Table 59 Market in Business & Consulting Vertical, By Deployment Location, 2017–2025 (USD Million)
Table 60 Market in Business & Consulting Vertical, By Region, 2017–2025 (USD Million)
Table 61 Market in Other Verticals, By Product, 2017–2025 (USD Million)
Table 62 Market in Other Verticals, By Deployment Location, 2017–2025 (USD Million)
Table 63 Market in Other Verticals, By Region, 2017–2025 (USD Million)
Table 64 Market, By Region, 2017–2025 (USD Billion)
Table 65 Market in North America, By Vertical, 2017–2025 (USD Million)
Table 66 Market North America, By Country, 2017–2025 (USD Million)
Table 67 North America Non-volatile Memory Express Market for BFSI Vertical, By Country, 2017–2025 (USD Million)
Table 68 North America Non-volatile Memory Express Market for Consumer Goods & Retail Vertical, By Country, 2017–2025 (USD Million)
Table 69 North America Non-volatile Memory Express Market for Telecommunications & Ites Vertical, By Country, 2017–2025 (USD Million)
Table 70 North America Market for Healthcare Vertical, By Country, 2017–2025 (USD Million)
Table 71 North America NVMe Market for Energy Vertical, By Country, 2017–2025 (USD Million)
Table 72 North America NVMe for Government Vertical, By Country, 2017–2025 (USD Million)
Table 73 North America NVMe for Education & Research Vertical, By Country, 2017–2025 (USD Million)
Table 74 North America NVMe for Media & Entertainment Vertical, By Country, 2017–2025 (USD Million)
Table 75 North America NVMe for Manufacturing Vertical, By Country, 2017–2025 (USD Million)
Table 76 North America NVMe for Business & Consulting Vertical, By Country, 2017–2025 (USD Million)
Table 77 North America NVMe for Other Verticals, By Country, 2017–2025 (USD Million)
Table 78 NVMe Market in Europe, By Vertical, 2017–2025 (USD Million)
Table 79 NVMe Market in Europe, By Country, 2017–2025 (USD Million)
Table 80 Europe NVMe Market for BFSI Vertical, By Country, 2017–2025 (USD Million)
Table 81 Europe Non-volatile Memory Express Market for Consumer Goods & Retail Vertical, By Country, 2017–2025 (USD Million)
Table 82 Europe Non-volatile Memory Express Market for Telecommunications & Ites Vertical, By Country, 2017–2025 (USD Million)
Table 83 Europe Non-volatile Memory Express Market for Healthcare Vertical, By Country, 2017–2025 (USD Million)
Table 84 Europe Non-volatile Memory Express Market for Energy Vertical, By Country, 2017–2025 (USD Million)
Table 85 Europe Non-volatile Memory Express Market for Government Vertical, By Country, 2017–2025 (USD Million)
Table 86 Europe Non-volatile Memory Express Market for Education & Research Vertical, By Country, 2017–2025 (USD Million)
Table 87 Europe NVMe Market for Media & Entertainment Vertical, By Country, 2017–2025 (USD Million)
Table 88 Europe NVMe Market for Manufacturing Vertical, By Country, 2017–2025 (USD Million)
Table 89 Europe NVMe Market for Business & Consulting Vertical, By Country, 2017–2025 (USD Million)
Table 90 Europe NVMe Market for Other Verticals, By Country, 2017–2025 (USD Million)
Table 91 NVMe Market in APAC, By Vertical, 2017–2025 (USD Million)
Table 92 NVMe Market in APAC, By Country, 2017–2025 (USD Million)
Table 93 APAC NVMe for BFSI Vertical, By Country, 2017–2025 (USD Million)
Table 94 APAC NVMe for Consumer Goods & Retail Vertical, By Country, 2017–2025 (USD Million)
Table 95 APAC NVMe for Telecommunications & Ites Vertical, By Country, 2017–2025 (USD Million)
Table 96 APAC NVMe for Healthcare Vertical, By Country, 2017–2025 (USD Million)
Table 97 APAC NVMe Market for Energy Vertical, By Country, 2017–2025 (USD Million)
Table 98 APAC NVMe Market for Government Vertical, By Country, 2017–2025 (USD Million)
Table 99 APAC NVMe Market for Education & Research Vertical, By Country, 2017–2025 (USD Million)
Table 100 APAC NVMe Market for Media & Entertainment, By Country, 2017–2025 (USD Million)
Table 101 APAC NVMe Market for Manufacturing Vertical, By Country, 2017–2025 (USD Million)
Table 102 APAC NVMe Market for Business & Consulting Vertical, By Country, 2017–2025 (USD Million)
Table 103 APAC NVMe Market for Other Verticals, By Country, 2017–2025 (USD Million)
Table 104 NVMe Market in RoW, By Vertical, 2017–2025 (USD Million)
Table 105 RoW NVMe, By Region, 2017–2025 (USD Million)
Table 106 RoW NVMe for BFSI Vertical, By Region, 2017–2025 (USD Million)
Table 107 RoW NVMe for Consumer Goods & Retail Vertical, By Region, 2017–2025 (USD Million)
Table 108 RoW NVMe for Telecommunications & Ites Vertical, By Region, 2017–2025 (USD Million)
Table 109 RoW NVMe for Healthcare Vertical, By Region, 2017–2025 (USD Million)
Table 110 RoW NVMe for Energy Vertical, By Region, 2017–2025 (USD Million)
Table 111 RoW NVMe for Government Vertical, By Region, 2017–2025 (USD Million)
Table 112 RoW NVMe for Education & Research Vertical, By Region, 2017–2025 (USD Million)
Table 113 RoW NVMe for Media & Entertainment Vertical, By Region, 2017–2025 (USD Million)
Table 114 RoW NVMe for Manufacturing Vertical, By Region, 2017–2025 (USD Million)
Table 115 RoW NVMe for Business & Consulting Vertical, By Region, 2017–2025 (USD Million)
Table 116 RoW NVMe for Other Verticals, By Region, 2017–2025 (USD Million)
Table 117 Product Launches and Developments, March 2018– January 2020
Table 118 Partnerships, Agreements, and Collaborations, August 2017–September 2019
Table 119 Mergers and Acquisitions, January 2017–September 2019
List of Figures (62 Figures)
Figure 1 NVMe Market Segmentation
Figure 2 Research Flow
Figure 3 NVMe Market: Research Design
Figure 4 Bottom-Up Approach
Figure 5 Top-Down Approach
Figure 6 Data Triangulation
Figure 7 SSDS to Hold Largest Size of NVMe Market From 2020 to 2025
Figure 8 Ethernet Communication Standard to Hold Largest Size of NVMe Market From 2020 to 2025
Figure 9 Hybrid Deployment to Grow at Highest CAGR From 2020 to 2025
Figure 10 BFSI Vertical to Hold Largest Size of NVMe Market From 2020 to 2025
Figure 11 North America Accounted for Largest Share of NVMe Market in 2019
Figure 12 Increased Global Adoption of High-Performance Computing Projected to Fuel Growth of NVMe Market From 2020 to 2025
Figure 13 NVMe-Based SSDS Market to Grow at Highest CAGR in Healthcare Vertical From 2020 to 2025
Figure 14 BFSI Segment and China Accounted for the Largest Share of APAC NVMe Market in 2019
Figure 15 North America Projected to Lead NVMe Market for BFSI From 2020 to 2025
Figure 16 Australia NVMe Market Projected to Grow at Highest CAGR From 2020 to 2025
Figure 17 Non-Volatile Memory Express (NVMe) Market: Drivers, Restraints, Opportunities, and Challenges
Figure 18 Adoption Rate of NVMe Compared With Sata and SAS in Server-Attached Storage
Figure 19 Adoption Rate of NVMe Compared With SAS in Storage Arrays
Figure 20 Comparison of Average Latency for Traditional Sata, Sas, and Hdd With NVMe Protocol
Figure 21 Comparison of Sequential Read and Write Speed of Hdd, Sata, and NVMe
Figure 22 Value Chain: Non-Volatile Memory Express Market, 2019
Figure 23 SSDS Segment Expected to Lead NVMe Market From 2020 to 2025
Figure 24 On-Premise Deployment Holds Largest Share of NVMe SSDS Market
Figure 25 On-Premise Deployment to Hold Largest Share of NVMe Adapters Market
Figure 26 Ethernet to Hold Largest Share of NVMe Servers Market During Forecast Period
Figure 27 On-Premise Deployment Holds Largest Share of NVMe Market for Other Products
Figure 28 Ethernet Communication Standard of NVMe Market Projected to Grow at Highest CAGR From 2020 to 2025
Figure 29 On-Premise Deployment Projected to Lead NVMe Market Between 2020 and 2025
Figure 30 NVMe Market for Healthcare Expected to Grow at Highest Rate During Forecast Period
Figure 31 On-Premise Deployment Expected to Hold Largest Share of NVMe Market in BFSI Vertical During Forecast Period
Figure 32 NVMe Market in Consumer Goods & Retail Vertical to Grow at Highest CAGR in Rest of the World
Figure 33 NVMe SSDS Account for Largest Share in Telecommunications & Ites Vertical of NVMe Market
Figure 34 Remote Deployment to Grow at Highest CAGR in Healthcare Vertical of NVMe Market During Forecast Period
Figure 35 North America Expected to Hold Largest Share of NVMe Market in Energy Vertical During Forecast Period
Figure 36 Hybrid Deployment Expected to Grow at Highest CAGR in Government Vertical of the NVMe Market During Forecast Period
Figure 37 North America to Hold Largest Share of NVMe Market in Education & Research Vertical
Figure 38 All-Flash Arrays Expected to Grow at Highest CAGR in Media & Entertainment Vertical of the NVMe Market During Forecast Period
Figure 39 On-Premise Deployment to Account for Largest Share of NVMe Market in Manufacturing Vertical During Forecast Period
Figure 40 NVMe Market in Business & Consulting Vertical to Grow at Highest CAGR in Rest of the World During Forecast Period
Figure 41 On-Premise Deployment to Hold Largest Share of NVMe Market in Other Verticals
Figure 42 Geographic Snapshot of NVMe Market
Figure 43 North America Projected to Lead NVMe Market From 2020 to 2025
Figure 44 North America NVMe Market Snapshot
Figure 45 US Projected to Lead North America NVMe Market for Media & Entertainment From 2020 to 2025
Figure 46 Europe NVMe Market Snapshot
Figure 47 UK Projected to Lead Europe NVMe Market for Healthcare From 2020 to 2025
Figure 48 APAC NVMe Market Snapshot
Figure 49 China Projected to Lead APAC NVMe Market for Consumer Goods & Retail From 2020 to 2025
Figure 50 Companies Adopted Product Launches and Developments as the Key Growth Strategy From January 2017 to January 2020
Figure 51 Ranking Analysis of Top 5 Players in NVMe Market
Figure 52 NVMe Market (Global) Competitive Leadership Mapping, 2019
Figure 53 Intel: Company Snapshot
Figure 54 Western Digital: Company Snapshot
Figure 55 Samsung: Company Snapshot
Figure 56 Dell EMC: Company Snapshot
Figure 57 Hewlett Packard Enterprise: Company Snapshot
Figure 58 Broadcom: Company Snapshot
Figure 59 Micron Technology: Company Snapshot
Figure 60 Cisco: Company Snapshot
Figure 61 Toshiba: Company Snapshot
Figure 62 NetApp: Company Snapshot
The study involved the estimation of the current size of the Non-volatile Memory Express (NVMe) market. Exhaustive secondary research was conducted to collect information on the market, its peer markets, and its parent market. This was followed by the validation of these findings, assumptions, and sizing with the industry experts identified across the value chain through primary research. Both, top-down and bottom-up approaches were employed to estimate the overall size of the NVMe market. It was followed by the market breakdown and data triangulation procedures, which were used to estimate the size of the market based on different segments and subsegments.
Secondary Research
In the secondary research process, various secondary sources were referred to for the identification and collection of relevant information for this study on the NVMe market. Secondary sources included annual reports, press releases, and investor presentations of companies; white papers; journals and certified publications; and articles by recognized authors, websites, directories, and databases. Secondary research was conducted to obtain the key information regarding the supply chain and value chain of the industry, total pool of key players, market segmentation according to industry trends (to the bottom-most level), geographic markets, and key developments from market- and technology-oriented perspectives. Secondary data was collected and analyzed to arrive at the overall size of the NVMe market, which was further validated by primary research.
Primary Research
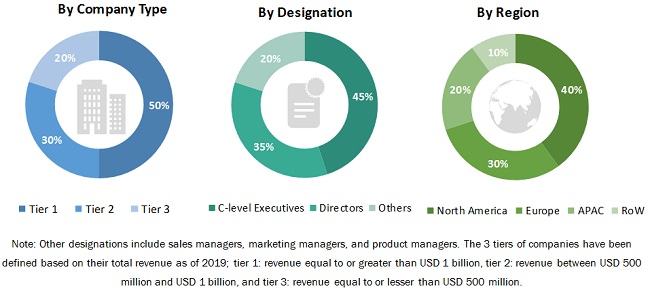
In the primary research process, various primary sources from both supply and demand sides were interviewed to obtain qualitative and quantitative information relevant to this report. Several primary interviews were conducted with the market experts from both demand (manufacturers of NVMe products and components used in different industries) and supply sides. The primary data was collected through questionnaires, emails, and telephonic interviews. Primary sources included industry experts such as chief executive officers (CEOs), vice presidents (VPs), marketing directors, technology and innovation directors, and related executives from various key companies and organizations operating in the NVMe market. Approximately 30% and 70% of the primary interviews were conducted from the demand and supply sides, respectively.
To know about the assumptions considered for the study, download the pdf brochure
Market Size Estimation
Top-down and bottom-up approaches were implemented to estimate and validate the total size of the NVMe market. These methods were used extensively to estimate the size of the market based on various segments and subsegments. The research methodology used to estimate the market size included the following steps:
- Key players in the industry were identified through extensive secondary research.
- The industry’s supply chain was identified, and the market size, in terms of value, was determined through primary and secondary research processes.
- All percentage shares, splits, and breakdowns were determined using secondary sources and verified through primary sources.
Data Triangulation
After arriving at the overall NVMe market size—using the market size estimation processes as explained above—the market was split into several segments and subsegments. Data triangulation and market breakdown procedures were employed, wherever applicable, to complete the overall market engineering process and arrive at the exact statistics of each market segment and subsegment. The data was triangulated by studying various factors and trends from the demand and supply sides across different applications.
Study Objectives
- To describe and forecast the NVMe market, in terms of value, based on product, communication standard, deployment location, and vertical
- To describe and forecast the market, in terms of value, for 4 major regions—North America, Europe, Asia Pacific (APAC), and the Rest of the World (RoW)
- To provide detailed information regarding the drivers, restraints, opportunities, and challenges influencing the growth of the NVMe market
- To strategically analyze micromarkets1 with respect to individual growth trends and contributions to the total market
- To profile key players and comprehensively analyze their position in terms of market ranking and core competencies2, along with a detailed competitive landscape of the market
- To analyze the competitive growth strategies—collaborations, agreements, partnerships, acquisitions, product launches and developments, research and development (R&D) activities—adopted by major players in the NVMe market
Available Customizations
With the given market data, MarketsandMarkets offers customizations according to the specific requirements of companies. The following customization options are available for this report:
- Product matrix that gives a detailed comparison of the product portfolio of each company
- Further breakdown of the RoW NVMe market at the country level
- Detailed analysis and profiling of additional market players (up to 5)


Growth opportunities and latent adjacency in Non-volatile Memory Express (NVMe) Market