Alpha Olefins Market by Type, Application (Poly-olefine Comonomer, Surfactants and Intermediates, Lubricants, Fine Chemicals, Oil Field Chemicals), and Region (North America, Europe, APAC, MEA, South America) - Global Forecast to 2028
Updated on : November 11, 2025
Alpha Olefins Market
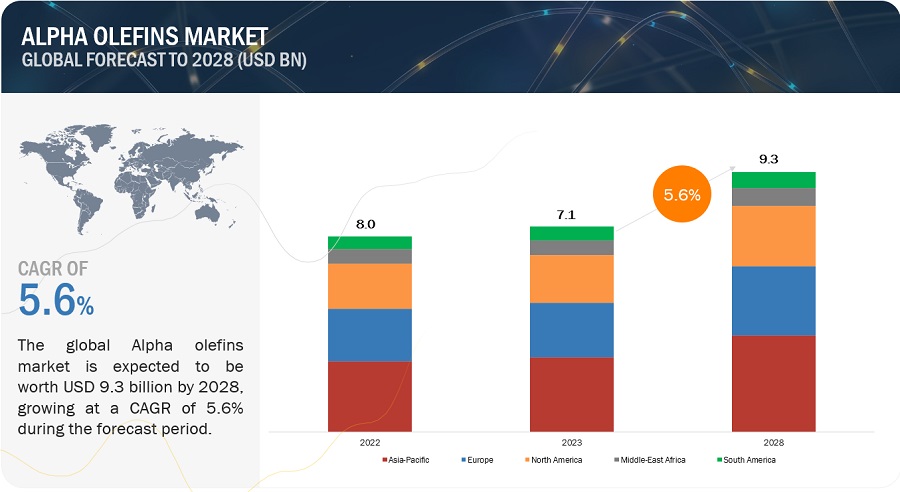
The global alpha olefins market was valued at USD 7.1 billion in 2023 and is projected to reach USD 9.3 billion by 2028, growing at 5.6% cagr from 2023 to 2028. Polyolefins comonomers are one of the major applications of alpha-olefins and offer market growth opportunities. Polyolefins are mainly used for manufacturing major plastics such as LLDPE, HDPE, LDPE, and PP. The demand for these plastics will be driven primarily by the rapidly growing economies of Asia-Pacific, Central Europe, and the Middle East.
Alpha Olefins Market Forecast & Trends
To know about the assumptions considered for the study, Request for Free Sample Report
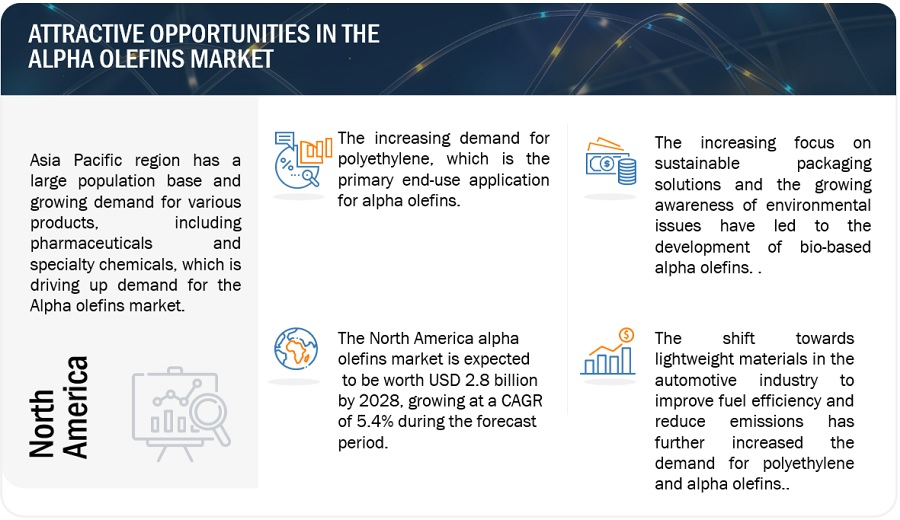
Attractive Opportunities in the Alpha Olefins Market
Alpha Olefins Market Dynamics
Driver: Abundancy of cheap natural gas-based feedstock in North America
The abundance of natural gas feedstock has made North America a competitive region for petrochemical investment and production. The availability of low-cost feedstock, combined with advanced manufacturing capabilities and infrastructure, has attracted significant investments in the construction of new petrochemical facilities, expansions of existing plants, and the development of downstream industries. Natural gas serves as a crucial feedstock for the production of a wide range of petrochemicals, including alpha olefins. The primary feedstock for alpha olefins production is ethylene, which can be derived from the cracking of ethane, a major component of natural gas. The abundant supply of ethane, thanks to the shale gas revolution, has had a direct impact on the availability and affordability of natural gas-based feedstock for the petrochemical industry in North America.
The United States, in particular, experienced a significant increase in natural gas production as a result of the shale gas revolution. Vast reserves of shale gas were discovered and tapped in regions such as the Marcellus Shale in the northeastern United States, the Barnett Shale in Texas, the Haynesville Shale in Louisiana, and the Utica Shale in Ohio.
Restraint: Stringent government regulations pertaining to plastic products
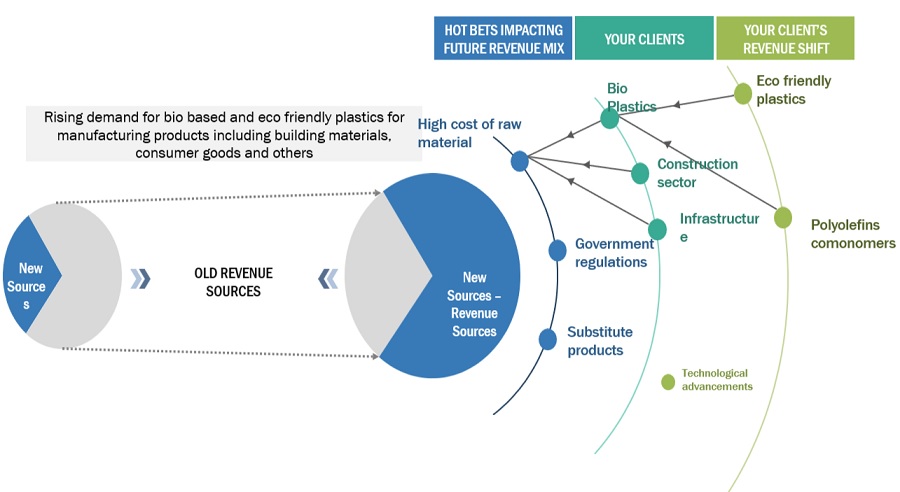
Governments worldwide have imposed stringent regulations on the use of traditional plastics to protect the environment and prevent health hazards. For example, plastics have been banned or restricted in certain applications due to their adverse effects on health and the environment. Besides, various governments aim to promote the use of bio-based and sustainable plastics and increase the demand for eco-friendly products.
Opportunities: growing investments in R&D for the development of alpha olefins from different sources
The increasing investment in research and development (R&D) for the development of alpha olefins from different sources is driven by several key factors. One such factor is the growing demand for sustainable and environmentally friendly chemical production. As concerns about climate change and resource depletion intensify, there is a need to explore alternative feedstocks and production methods that reduce reliance on fossil fuels and minimize environmental impact.
Investing in R&D for alpha olefins from different sources, such as bio-based feedstocks or carbon capture and utilization, aligns with the goals of sustainability and circular economy. These efforts aim to utilize renewable resources, reduce greenhouse gas emissions, and maximize the utilization of waste streams or CO2 emissions as valuable feedstocks.
Challenges: Highly volatile prices of raw materials
The high volatility in raw material prices poses significant challenges to the alpha olefins market. Fluctuations in the prices of crude oil or natural gas, which serve as the primary feedstocks, introduce uncertainty and cost pressure for manufacturers. These price fluctuations can directly impact production costs, profitability, and competitiveness in the market. Manufacturers may struggle to accurately forecast costs and pricing, leading to challenges in supply chain management and customer relationships. Additionally, volatility in raw material prices can affect the market's competitiveness against alternative feedstocks or substitutes. Attempts to pass on increased costs to customers through price increases may face resistance, leading to potential loss of market share. Effective risk management strategies, such as hedging, long-term contracts, and diversification of feedstock sources, become crucial for alpha olefins producers to mitigate the impact of price fluctuations and ensure stability in a volatile market environment.
Alpha Olefins Market Trends
1-Butene segment, by type, is expected to be the largest market during the forecast period
1-Butene is expected to register the highest growth during the forecast period. It is primarily used in the production of polyethylene and polypropylene, both of which are considered as the major building blocks in the petrochemical industry. Moreover, the increasing need for plastics such as HDPE, LLDPE, and LDPE is also contributing to its growth in the region. Moreover, 1-Butene serves as a starting material for the synthesis of various chemical intermediates. It can be converted into butadiene, a key monomer used in the production of synthetic rubbers, elastomers, and plastics. It is also used in the production of 1,3-butadiene, which is further processed into adiponitrile, a precursor for nylon production.
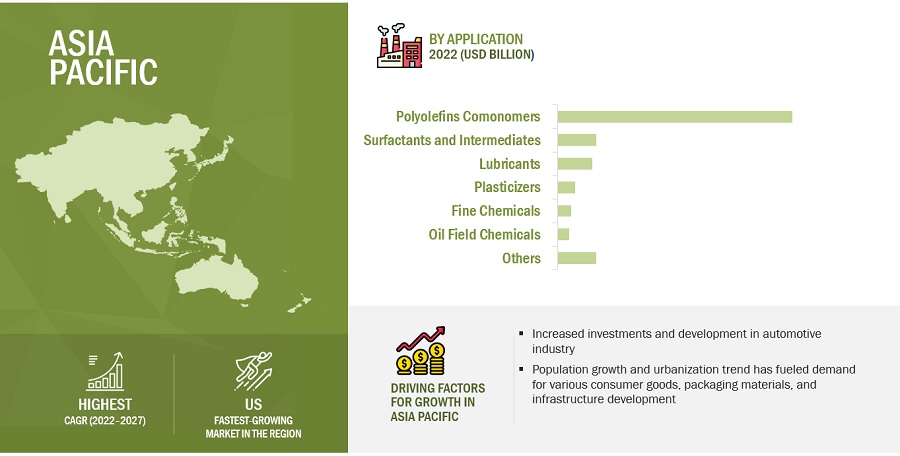
The Polyolefins Comonomer segment held the largest market share in the alpha olefins market By application,
Polyolefins comonomers offer flexibility in tailoring the properties of polyethylene and polypropylene to specific application needs. Different comonomers, such as 1-butene, 1-hexene, and 1-octene, have distinct effects on polymer properties, enabling manufacturers to create a wide range of polyolefin grades with varying characteristics. This versatility allows for customization and optimization of materials for different applications, including packaging, automotive, construction, and consumer goods.
“North America: The second fastest Alpha olefins market”
The market in Asia Pacific is witnessing the second-fastest region for alpha olefins. The industry will witness growth because the alpa olefins market in Asia Pacific is driven by rapid industrialization, economic growth, expanding construction and infrastructure development, increasing demand for polyethylene and the booming automotive industry. The regions strong manufacturing sectors rising consumer population and infrastructure projects create a significant demand for alpha olefins used in various application such as packaging, construction material, automotive components and synthetic lubricants.
To know about the assumptions considered for the study, download the pdf brochure
Alpha Olefins Market Players
The Alpha Olefins market is dominated by a few major players that have a wide regional presence. The key players in the Alpha olefins market are Royal Dutch Shell (Netherlands), Chevron Phillips Chemical Company (Texas), INEOS Group Limited (UK), SABIC (Saudi Arabia), Evonik Industries AG (Germany), Dow Chemical Company (Michigan), Sasol Limited (South Africa), ExxonMobil (US), Qatar Chemical Company (Qatar), PJSC Nizhnekamskneftekhim (Russia). In the last few years, the companies have adopted growth strategies such as Acquisitions and expansions to capture a larger share of the Alpha olefins market.
Alpha Olefins Market Report Scope
|
Report Metric |
Details |
|
Market Size Value in 2023 |
USD 7.1 billion |
|
Revenue Forecast in 2028 |
USD 9.3 billion |
|
CAGR |
5.6% |
|
Market size available for years |
2020–2028 |
|
Base year considered |
2022 |
|
Forecast period |
2023–2028 |
|
Forecast units |
Value (USD) |
|
Segments Covered |
application, type, and Region |
|
Geographies covered |
Asia Pacific, North America, Europe, Middle East & Africa, and South America |
|
Companies covered |
Royal Dutch Shell (Netherlands), Chevron Phillips Chemical Company (Texas), INEOS Group Limited (UK), SABIC (Saudi Arabia), Evonik Industries AG (Germany), Dow Chemical Company (Michigan), Sasol Limited (South Africa), ExxonMobil (US), Qatar Chemical Company (Qatar), PJSC Nizhnekamskneftekhim (Russia). |
This research report categorizes the alpha olefins market by fuel, applications, product type, power rating, end user, and region
Based on type, the alpha olefins market has been segmented as follows:
- 1-Hexene
- 1-Octene
- 1-Butene
- Others
Based on application, the alpha olefins market has been segmented as follows:
- Polyolefins comonomer
- Surfactants and intermediates
- Lubricants
- Fine chemicals
- Plasticizer
- Oil field chemicals
- Others
Based on region, the alpha olefins market has been segmented as follows:
- Asia Pacific
- Europe
- North America
- Middle East & Africa
- South America
Recent Developments
- Shell USA, Inc. and Shell Midstream Partners, L.P. announced to execute a definitive agreement and plan of merger pursuant to which Shell USA will acquire all of the common units representing limited partner interests in SHLX held by the public.
- INEOS Group & Polymers have announced it has entered into a joint venture with the NEXTLOOPP project, an UK collaboration to create circular food-grade recycled polypropylene from Post-Consumer Recycled (PCR) packaging.
- SABIC has joined with Estiko Packaging Solutions and Coldwater Prawns of Norway to develop and implement a highly sustainable new packaging pouch for frozen prawns. The packaging pouch is made from a multi-layer film produced by Estiko Packaging Solutions using a random circular certified polymer grade of SABIC® PP QRYSTAL with an ocean-bound plastic (OBP) content of around 60%.
Frequently Asked Questions (FAQ):
What is the current size of the Alpha Olefins market?
The current market size of the global Alpha olefins market is 8.04 Billion in 2022.
What are the major drivers for the Alpha Olefins market?
The abundance of cheap natural gas-based feedstock in North America
Which is the fastest-growing region during the forecasted period in the Alpha Olefins market?
Asia Pacific is expected to be the fastest-growing region for the global Alpha olefins market between 2022–2027. The industry will witness growth because of significant investments in re-exploring oil & gas and exploring new reserves.
Which is the fastest-growing segment, by type, during the forecasted period in the Alpha olefins market?
By type, the Alpha olefins market has been segmented into 1-Hexene, 1-Octene, 1-Butene, and others; it helps provide a versatile range of polypropylene resins.
What are the major restraints for the Alpha Olefins market?
The negative environmental impact of alpha olefins is the major restraining factor for the market .
To speak to our analyst for a discussion on the above findings, click Speak to Analyst


- 5.1 INTRODUCTION
-
5.2 MARKET DYNAMICSDRIVERS, RESTRAINTS, OPPORTUNITIES, AND CHALLENGES IN ALPHA OLEFINS MARKETDRIVERS- Discovery of shale gas- Growth of end-use industries- Increase in demand for PAO-based synthetic lubricantsOPPORTUNITIES- Growth in R&D investments for development of alpha olefins from different sourcesCHALLENGES- Volatile raw material pricesRESTRAINTS- Environmental concerns- Technological & infrastructural challenges
-
5.3 PORTER’S FIVE FORCES ANALYSISBARGAINING POWER OF SUPPLIERSBARGAINING POWER OF BUYERSTHREAT OF NEW ENTRANTSTHREAT OF SUBSTITUTESINTENSITY OF COMPETITIVE RIVALRY
-
6.1 MACROECONOMIC INDICATORSOIL & GAS INDUSTRY
-
6.2 TRADE ANALYSISEXPORT SCENARIOIMPORT SCENARIO
-
7.1 INTRODUCTION1-BUTENE- Catalytic nature to drive growth of 1-Butene in alpha olefins market1-HEXENE- Numerous applications, including oligomerization and production of LLDPE & HDPE to drive growth1-OCTENE- High reactivity and versatile chemical properties to drive marketOTHERS- 1-Decene- 1-Dodecene- 1-Tetradecene- 1-Hexadecene- 1-Octadecene- Others
-
8.1 INTRODUCTIONPOLYOLEFIN COMONOMERSSURFACTANTS AND INTERMEDIATESLUBRICANTSFINE CHEMICALSPLASTICIZERSOILFIELD CHEMICALSOTHERS
- 9.1 INTRODUCTION
-
9.2 NORTH AMERICARECESSION IMPACTUS- Increasing demand from packaging and plastic industries to drive marketCANADA- Growing plastic, chemical, and lubricant industries to drive growthMEXICO- Packaging industry to drive demand for alpha olefins
-
9.3 EUROPERECESSION IMPACTGERMANY- Booming automotive and electronics industries to drive demand for alpha olefinsBELGIUM- Packaging industry, coupled with sustainable practices by government, to drive demand for alpha olefinsITALY- Well-developed chemical & petrochemical industry to drive demand for alpha olefinsFRANCE- Growing medical and automotive industries to drive growthNETHERLANDS- Government initiatives to create revenue pockets for alpha olefins marketRUSSIA- Presence of huge chemical and oil & gas industries to drive growth- Rest of Europe
-
9.4 ASIA PACIFICRECESSION IMPACTCHINA- Rising automotive sector, coupled with agrochemical industry, to be major driversJAPAN- Automotive and pharmaceutical industries to drive demandSOUTH KOREA- Government initiatives, coupled with major chemical industry, to drive marketINDIA- Growing chemical industry to drive demand- Rest of Asia Pacific
-
9.5 MIDDLE EAST & AFRICARECESSION IMPACTSAUDI ARABIA- Major oil and petrochemical industries contributing to growthTURKEY- Major petrochemical industry to drive marketREST OF MIDDLE EAST & AFRICA
- 9.6 SOUTH AMERICA
-
9.7 RECESSION IMPACTBRAZIL- Major food & beverages industry to lead growthARGENTINA- Oil & gas industry and automotive sector to drive demand- Rest of South America

- 10.1 INTRODUCTION
-
10.2 MARKET SHARE ANALYSISRANKING OF KEY MARKET PLAYERS, 2022MARKET SHARE OF KEY PLAYERS
- 10.3 REVENUE ANALYSIS
-
10.4 COMPANY EVALUATION QUADRANT MATRIX, 2022STARSPERVASIVE PLAYERSEMERGING LEADERSPARTICIPANTS
-
10.5 START-UPS/SMES EVALUATION QUADRANT MATRIX, 2022PROGRESSIVE COMPANIESRESPONSIVE COMPANIESDYNAMIC COMPANIESSTARTING BLOCKS
- 10.6 COMPETITIVE BENCHMARKING
- 10.7 ALPHA OLEFINS MARKET: COMPANY FOOTPRINT
- 10.8 COMPETITIVE SCENARIOS & TRENDS
-
11.1 KEY PLAYERSROYAL DUTCH SHELL- Business overview- Products/Solutions/Services offered- Recent developments- MnM viewCHEVRON PHILLIPS CHEMICAL COMPANY- Business overview- Products/Solutions/Services offered- Recent developments- MnM viewINEOS GROUP LIMITED- Business overview- Products/Solutions/Services offered- Recent developments- MnM viewSABIC- Products/Solutions/Services offered- Recent development- MnM viewSASOL LIMITED- Business overview- Products/Solutions/Services offered- Recent developments- MnM viewEVONIK INDUSTRIES- Business overview- Products/Solutions/Services offered- Recent developments- MnM viewDOW CHEMICAL COMPANY- Business Overview- Products/Solutions/Services offered- Recent developments- MnM viewEXXONMOBIL- Business Overview- Products/Solutions/Services offered- Recent developments- MnM viewQATAR CHEMICAL COMPANY- Business overview- Products/Solutions/Services offered- Recent developments- MnM viewPJSC NIZHNEKAMSKNEFTEKHIM- Business overview- Products/Solutions/Services offered- Recent developments- MnM view
-
11.2 OTHER PLAYERSMITSUBISHI CHEMICAL CORPORATIONIDEMITSU PETROCHEMICAL COMPANYSINOPEC BEIJING YASHAN COMPANYPETRO RABIGHMITSUI CHEMICALS INC.MERCK GROUPNPC IRANJAM PETROCHEMICAL COMPANYTPC GROUPOIL AND GAS NATIONAL CORPORATIONSAUDI ARAMCO TOTAL REFINING AND PETROCHEMICAL COMPANY (SATORP)LYONDELLBASELL INDUSTRIES N.V.PETROCHINA COMPANY LIMITEDTOKYO CHEMICAL INDUSTRY COMPANY LIMITEDALFA AESAR
- 12.1 DISCUSSION GUIDE
- 12.2 KNOWLEDGESTORE: MARKETSANDMARKETS’ SUBSCRIPTION PORTAL
- 12.3 CUSTOMIZATION OPTIONS
- 12.4 RELATED REPORTS
- 12.5 AUTHOR DETAILS
- TABLE 1 ALPHA OLEFINS: MARKET SNAPSHOT
- TABLE 2 PORTER’S FIVE FORCES ANALYSIS
- TABLE 3 CRUDE OIL PRODUCTION STATISTICS, BY COUNTRY, 2015–2022 (MILLION TONNES)
- TABLE 4 NATURAL GAS PRODUCTION STATISTICS, BY COUNTRY, 2015–2022 (BILLION CUBIC METERS)
- TABLE 5 ALPHA OLEFINS MARKET, BY TYPE, 2020–2028 (KILOTON)
- TABLE 6 ALPHA OLEFINS MARKET, BY TYPE, 2020–2028 (USD MILLION)
- TABLE 7 ALPHA OLEFINS MARKET, BY APPLICATION, 2020–2028 KILOTONS)
- TABLE 8 ALPHA OLEFINS MARKET, BY APPLICATION, 2020–2028 (USD MILLION)
- TABLE 9 ALPHA OLEFINS MARKET, BY REGION, 2020–2028 (KILOTON)
- TABLE 10 ALPHA OLEFINS MARKET, BY REGION, 2020–2028 (USD MILLION)
- TABLE 11 NORTH AMERICA: ALPHA OLEFINS MARKET, BY COUNTRY, 2020–2028 (KILOTON)
- TABLE 12 NORTH AMERICA: ALPHA OLEFINS MARKET, BY COUNTRY, 2020–2028 (USD MILLION)
- TABLE 13 NORTH AMERICA: ALPHA OLEFINS MARKET, BY APPLICATION, 2020–2028 (KILOTON)
- TABLE 14 NORTH AMERICA: ALPHA OLEFINS MARKET, BY APPLICATION, 2020–2028 (USD MILLION)
- TABLE 15 US: ALPHA OLEFINS MARKET, BY APPLICATION, 2020–2028 (KILOTON)
- TABLE 16 US: ALPHA OLEFINS MARKET, BY APPLICATION, 2020–2028 (USD MILLION)
- TABLE 17 CANADA: ALPHA OLEFINS MARKET, BY APPLICATION, 2020–2028 (KILOTON)
- TABLE 18 CANADA: ALPHA OLEFINS MARKET, BY APPLICATION, 2020–2028 (USD MILLION)
- TABLE 19 MEXICO: ALPHA OLEFINS MARKET, BY APPLICATION, 2020–2028 (KILOTON)
- TABLE 20 MEXICO: ALPHA OLEFINS MARKET, BY APPLICATION, 2020–2028 (USD MILLION)
- TABLE 21 EUROPE: ALPHA OLEFINS MARKET, BY COUNTRY, 2020–2028 (KILOTON)
- TABLE 22 EUROPE: ALPHA OLEFINS MARKET, BY COUNTRY, 2020–2028 (USD MILLION)
- TABLE 23 EUROPE: ALPHA OLEFINS MARKET, BY APPLICATION, 2020–2028 (KILOTON)
- TABLE 24 EUROPE: ALPHA OLEFINS MARKET, BY APPLICATION, 2020–2028 (USD MILLION)
- TABLE 25 GERMANY: ALPHA OLEFINS MARKET, BY APPLICATION, 2020–2028 (KILOTON)
- TABLE 26 GERMANY: ALPHA OLEFINS MARKET, BY APPLICATION, 2020–2028 (USD MILLION)
- TABLE 27 BELGIUM: ALPHA OLEFINS MARKET, BY APPLICATION, 2020–2028 (KILOTON)
- TABLE 28 BELGIUM: ALPHA OLEFINS MARKET, BY APPLICATION, 2020–2028 (USD MILLION)
- TABLE 29 ITALY: ALPHA OLEFINS MARKET, BY APPLICATION, 2020–2028 (KILOTON)
- TABLE 30 ITALY: ALPHA OLEFINS MARKET, BY APPLICATION, 2020–2028 (USD MILLION)
- TABLE 31 FRANCE: ALPHA OLEFINS MARKET, BY APPLICATION, 2020–2028 (KILOTON)
- TABLE 32 FRANCE: ALPHA OLEFINS MARKET, BY APPLICATION, 2020–2028 (USD MILLION)
- TABLE 33 NETHERLANDS: ALPHA OLEFINS MARKET, BY APPLICATION, 2020–2028 (KILOTON)
- TABLE 34 NETHERLANDS: ALPHA OLEFINS MARKET, BY APPLICATION, 2020–2028 (USD MILLION)
- TABLE 35 RUSSIA: ALPHA OLEFINS MARKET, BY APPLICATION, 2020–2028 (KILOTON)
- TABLE 36 RUSSIA: ALPHA OLEFINS MARKET, BY APPLICATION, 2020–2028 (USD MILLION)
- TABLE 37 REST OF EUROPE: ALPHA OLEFINS MARKET, BY APPLICATION, 2020–2028 (KILOTON)
- TABLE 38 REST OF EUROPE: ALPHA OLEFINS MARKET, BY APPLICATION, 2020–2028 (USD MILLION)
- TABLE 39 ASIA PACIFIC: ALPHA OLEFINS MARKET, BY COUNTRY, 2020–2028 (KILOTON)
- TABLE 40 ASIA PACIFIC: ALPHA OLEFINS MARKET, BY COUNTRY, 2020–2028 (USD MILLION)
- TABLE 41 ASIA PACIFIC: ALPHA OLEFINS MARKET, BY APPLICATION, 2020–2028 (KILOTON)
- TABLE 42 ASIA PACIFIC: ALPHA OLEFINS MARKET, BY APPLICATION, 2020–2028 (USD MILLION)
- TABLE 43 CHINA: ALPHA OLEFINS MARKET, BY APPLICATION, 2020–2028 (KILOTON)
- TABLE 44 CHINA: ALPHA OLEFINS MARKET, BY APPLICATION, 2020–2028 (USD MILLION)
- TABLE 45 JAPAN: ALPHA OLEFINS MARKET, BY APPLICATION, 2020–2028 (KILOTON)
- TABLE 46 JAPAN: ALPHA OLEFINS MARKET, BY APPLICATION, 2020–2028 (USD MILLION)
- TABLE 47 SOUTH KOREA: ALPHA OLEFINS MARKET, BY APPLICATION, 2020–2028 (KILOTON)
- TABLE 48 SOUTH KOREA: ALPHA OLEFINS MARKET, BY APPLICATION, 2020–2028 (USD MILLION)
- TABLE 49 INDIA: ALPHA OLEFINS MARKET, BY APPLICATION, 2020–2028 (KILOTON)
- TABLE 50 INDIA: ALPHA OLEFINS MARKET, BY APPLICATION, 2020–2028 (USD MILLION)
- TABLE 51 REST OF ASIA PACIFIC: ALPHA OLEFINS MARKET, BY APPLICATION, 2020–2028 (KILOTON)
- TABLE 52 REST OF ASIA PACIFIC: ALPHA OLEFINS MARKET, BY APPLICATION, 2020–2028 (USD MILLION)
- TABLE 53 MIDDLE EAST AND AFRICA: ALPHA OLEFINS MARKET, BY COUNTRY, 2020–2028 (KILOTON)
- TABLE 54 MIDDLE EAST AND AFRICA: ALPHA OLEFINS MARKET, BY COUNTRY, 2020–2028 (USD MILLION)
- TABLE 55 MIDDLE EAST AND AFRICA: ALPHA OLEFINS MARKET, BY APPLICATION, 2020–2028 (KILOTON)
- TABLE 56 MIDDLE EAST AND AFRICA: ALPHA OLEFINS MARKET, BY APPLICATION, 2020–2028 (USD MILLION)
- TABLE 57 SAUDI ARABIA: ALPHA OLEFINS MARKET, BY APPLICATION, 2020–2028 (KILOTON)
- TABLE 58 SAUDI ARABIA: ALPHA OLEFINS MARKET, BY APPLICATION, 2020–2028 (USD MILLION)
- TABLE 59 TURKEY: ALPHA OLEFINS MARKET, BY APPLICATION, 2020–2028 (KILOTON)
- TABLE 60 TURKEY: ALPHA OLEFINS MARKET, BY APPLICATION, 2020–2028 (USD MILLION)
- TABLE 61 REST OF MIDDLE EAST & AFRICA: ALPHA OLEFINS MARKET, BY APPLICATION, 2020–2028 (KILOTON)
- TABLE 62 REST OF MIDDLE EAST & AFRICA: ALPHA OLEFINS MARKET, BY APPLICATION, 2020–2028 (USD MILLION)
- TABLE 63 SOUTH AMERICA: ALPHA OLEFINS MARKET, BY COUNTRY, 2020–2028 (KILOTON)
- TABLE 64 SOUTH AMERICA: ALPHA OLEFINS MARKET, BY COUNTRY, 2020–2028 (USD MILLION)
- TABLE 65 SOUTH AMERICA: ALPHA OLEFINS MARKET, BY APPLICATION, 2020–2028 (KILOTON)
- TABLE 66 SOUTH AMERICA: ALPHA OLEFINS MARKET, BY APPLICATION, 2020–2028 (USD MILLION)
- TABLE 67 BRAZIL: ALPHA OLEFINS MARKET, BY APPLICATION, 2020–2028 (KILOTON)
- TABLE 68 BRAZIL: ALPHA OLEFINS MARKET, BY APPLICATION, 2020–2028 (USD MILLION)
- TABLE 69 ARGENTINA: ALPHA OLEFINS MARKET, BY APPLICATION, 2020–2028 (KILOTON)
- TABLE 70 ARGENTINA: ALPHA OLEFINS MARKET, BY APPLICATION, 2020–2028 (USD MILLION)
- TABLE 71 REST OF SOUTH AMERICA: ALPHA OLEFINS MARKET, BY APPLICATION, 2020–2028 (KILOTON)
- TABLE 72 REST OF SOUTH AMERICA: ALPHA OLEFINS MARKET, BY APPLICATION, 2020–2028 (USD MILLION)
- TABLE 73 REVIEW OF STRATEGIES ADOPTED BY KEY MANUFACTURERS OF ALPHA OLEFINS
- TABLE 74 ALPHA OLEFINS MARKET: DEGREE OF COMPETITION
- TABLE 75 ALPHA OLEFINS MARKET: DETAILED LIST OF KEY STARTUPS/SMES
- TABLE 76 COMPETITIVE BENCHMARKING OF KEY STARTUPS/SMES, BY APPLICATION
- TABLE 77 COMPETITIVE BENCHMARKING OF KEY STARTUPS/SMES, BY REGION
- TABLE 78 APPLICATION: COMPANY FOOTPRINT
- TABLE 79 TYPE : COMPANY FOOTPRINT
- TABLE 80 REGION: COMPANY FOOTPRINT
- TABLE 81 COMPANY FOOTPRINT
- TABLE 82 ALPHA OLEFINS MARKET: PRODUCT LAUNCHES, 2020–2023
- TABLE 83 ALPHA OLEFINS MARKET: DEALS, APRIL 2019– JUNE 2022
- TABLE 84 ROYAL DUTCH SHELL: COMPANY OVERVIEW
- TABLE 85 ROYAL DUTCH SHELL: PRODUCTS/SOLUTIONS/SERVICES OFFERED
- TABLE 86 ROYAL DUTCH SHELL: DEALS
- TABLE 87 ROYAL DUTCH SHELL: EXPANSION/MERGER/ACQUISITION
- TABLE 88 CHEVRON PHILLIPS CHEMICAL COMPANY: COMPANY OVERVIEW
- TABLE 89 CHEVRON PHILLIPS CHEMICAL COMPANY: PRODUCTS/SOLUTIONS/ SERVICES OFFERED
- TABLE 90 CHEVRON PHILLIPS CHEMICAL COMPANY: DEALS
- TABLE 91 INEOS GROUP LIMITED: COMPANY OVERVIEW
- TABLE 92 INEOS GROUP LIMITED: PRODUCTS/SOLUTIONS/SERVICES OFFERED
- TABLE 93 INEOS GROUP LIMITED: DEALS
- TABLE 94 INEOS GROUP LIMITED: PRODUCT LAUNCHES
- TABLE 95 SABIC: COMPANY OVERVIEW
- TABLE 96 SABIC: PRODUCTS/SOLUTIONS/SERVICES OFFERED
- TABLE 97 SABIC: DEALS
- TABLE 98 SABIC: PRODUCT LAUNCHES
- TABLE 99 SASOL LIMITED: COMPANY OVERVIEW
- TABLE 100 SASOL LIMITED: PRODUCTS/SOLUTIONS/SERVICES OFFERED
- TABLE 101 SASOL LIMITED:EXPANSION
- TABLE 102 SASOL LIMITED: DEALS
- TABLE 103 EVONIK INDUSTRIES AG: COMPANY OVERVIEW
- TABLE 104 EVONIK INDUSTRIES AG: PRODUCTS/SOLUTIONS/SERVICES OFFERED
- TABLE 105 EVONIK INDUSTRIES AG: EXPANSION
- TABLE 106 EVONIK INDUSTRIES AG: DEALS
- TABLE 107 DOW CHEMICAL COMPANY: COMPANY OVERVIEW
- TABLE 108 DOW CHEMICAL COMPANY: PRODUCTS/SOLUTIONS/SERVICES OFFERED
- TABLE 109 DOW CHEMICAL COMPANY: DEALS
- TABLE 110 EXXONMOBIL: COMPANY OVERVIEW
- TABLE 111 EXXONMOBIL: PRODUCTS/SOLUTIONS/SERVICES OFFERED
- TABLE 112 EXXONMOBIL: DEALS
- TABLE 113 EXXONMOBIL: PRODUCT LAUNCHES
- TABLE 114 QATAR CHEMICAL COMPANY: COMPANY OVERVIEW
- TABLE 115 QATAR CHEMICAL COMPANY: PRODUCTS/SOLUTIONS/SERVICES OFFERED
- TABLE 116 QATAR CHEMICAL COMPANY: DEALS
- TABLE 117 PJSC NIZHNEKAMSKNEFTEKHIM: COMPANY OVERVIEW
- TABLE 118 PJSC NIZHNEKAMSKNEFTEKHIM: PRODUCTS/SOLUTIONS/SERVICES OFFERED
- TABLE 119 PJSC NIZHNEKAMSKNEFTEKHIM: DEALS
- FIGURE 1 ALPHA OLEFINS MARKET: RESEARCH DESIGN
- FIGURE 2 KEY INDUSTRY INSIGHTS
- FIGURE 3 BREAKDOWN OF PRIMARY INTERVIEWS
- FIGURE 4 DATA TRIANGULATION
- FIGURE 5 MARKET SIZE ESTIMATION METHODOLOGY: BOTTOM-UP APPROACH
- FIGURE 6 MARKET SIZE ESTIMATION METHODOLOGY: TOP-DOWN APPROACH
- FIGURE 7 MARKET SIZE ESTIMATION METHODOLOGY: DEMAND-SIDE CALCULATION
- FIGURE 8 METRICS CONSIDERED FOR ANALYZING AND ASSESSING DEMAND FOR ALPHA OLEFINS
- FIGURE 9 ASIA PACIFIC TO LEAD MARKET DURING FORECAST PERIOD
- FIGURE 10 POLYOLEFINS COMONOMERS APPLICATION TO BE LARGEST SEGMENT DURING FORECAST PERIOD
- FIGURE 11 1-BUTENE TO BE LARGEST TYPE DURING FORECAST PERIOD
- FIGURE 12 INCREASING AWARENESS REGARDING SUSTAINABLE TECHNOLOGY TO DRIVE MARKET
- FIGURE 13 ASIA PACIFIC TO GROW AT HIGHEST CAGR DURING FORECAST PERIOD
- FIGURE 14 1-BUTENE SEGMENT TO ACCOUNT FOR LARGEST SHARE BY 2028
- FIGURE 15 POLYOLEFINS COMONOMERS SEGMENT TO ACCOUNT FOR LARGEST SHARE IN 2028
- FIGURE 16 POLYOLEFINS COMONOMERS AND CHINA ACCOUNTED FOR SIGNIFICANT SHARE IN 2023
- FIGURE 17 PORTER’S FIVE FORCES ANALYSIS
- FIGURE 18 EXPORT SCENARIO FOR HS CODE 390290, BY KEY COUNTRY, 2019–2022
- FIGURE 19 IMPORT SCENARIO FOR HS CODE 390290, BY KEY COUNTRY, 2019–2022
- FIGURE 20 1-BUTENE TO BE LARGEST MARKET DURING FORECAST PERIOD
- FIGURE 21 POLYOLEFINS COMONOMERS TO BE LARGEST SEGMENT DURING FORECAST PERIOD
- FIGURE 22 ASIA PACIFIC TO BE FASTEST-GROWING MARKET DURING FORECAST PERIOD
- FIGURE 23 NORTH AMERICA: ALPHA OLEFINS MARKET SNAPSHOT
- FIGURE 24 EUROPE: ALPHA OLEFINS MARKET SNAPSHOT
- FIGURE 25 ASIA PACIFIC: ALPHA OLEFINS MARKET SNAPSHOT
- FIGURE 26 MIDDLE EAST AND AFRICA: ALPHA OLEFINS MARKET SNAPSHOT
- FIGURE 27 SOUTH AMERICA: ALPHA OLEFINS MARKET SNAPSHOT
- FIGURE 28 MARKET SHARE ANALYSIS OF TOP 5 PLAYERS IN ALPHA OLEFINS MARKET, 2022
- FIGURE 29 REVENUE ANALYSIS OF TOP 5 PLAYERS IN ALPHA OLEFINS MARKET 2022
- FIGURE 30 ALPHA OLEFINS MARKET: COMPANY EVALUATION QUADRANT, 2022
- FIGURE 31 ALPHA OLEFINS MARKET: STARTUPS/SMES EVALUATION QUADRANT, 2022
- FIGURE 32 ROYAL DUTCH SHELL: COMPANY SNAPSHOT
- FIGURE 33 CHEVRON PHILLIPS CHEMICAL COMPANY: COMPANY SNAPSHOT
- FIGURE 34 INEOS GROUP LIMITED: COMPANY SNAPSHOT
- FIGURE 35 SABIC: COMPANY SNAPSHOT
- FIGURE 36 SASOL LIMITED: COMPANY SNAPSHOT
- FIGURE 37 EVONIK INDUSTRIES AG: COMPANY SNAPSHOT
- FIGURE 38 DOW CHEMICAL COMPANY: COMPANY SNAPSHOT
- FIGURE 39 EXXONMOBIL: COMPANY SNAPSHOT
The study involved major activities in estimating the current size of the Alpha Olefins market. Exhaustive secondary research was done to collect information on the peer and parent markets. The next step was to validate these findings, assumptions, and sizing with industry experts across the value chain through primary research. Both top-down and bottom-up approaches were employed to estimate the complete market size. Thereafter, market breakdown and data triangulation were used to estimate the market size of the segments and subsegments.
Secondary Research
In the secondary research process, various sources, such as annual reports, press releases, investor presentations of companies, white papers, certified publications, articles from recognized authors, and databases, were considered for identifying and collecting information for this study. Secondary research was mainly conducted to obtain key information about the supply chain of the industry, the monetary chain of the market, the total number of market players, market classification and segmentation according to industry trends to the bottom-most level, regional markets, and key developments from both market- and technology-oriented perspectives.
Primary Research
In the primary research process, various primary sources from both supply and demand sides were interviewed to obtain qualitative and quantitative information for this report. Primary sources from the supply side include industry experts, such as chief executive officers (CEOs), vice presidents (VPs), marketing directors, technology and innovation directors, consultants, and related key executives from major companies and organizations operating in the market. Primary sources from the demand side include lab technicians, technologists, and sales/purchase managers in the industry. Following is the breakdown of primary respondents:
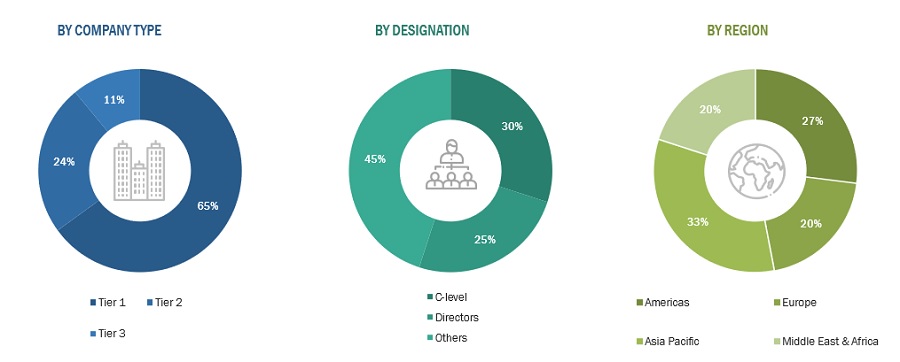
Note: Others include product engineers and product specialists.
The tier of the companies is defined on the basis of their total revenue; as of 2018: Tier 1 = > USD 1 billion, Tier 2 = From USD 500 million to USD 1 billion, and Tier 3 = < USD 500 million
To know about the assumptions considered for the study, download the pdf brochure
Market Size Estimation
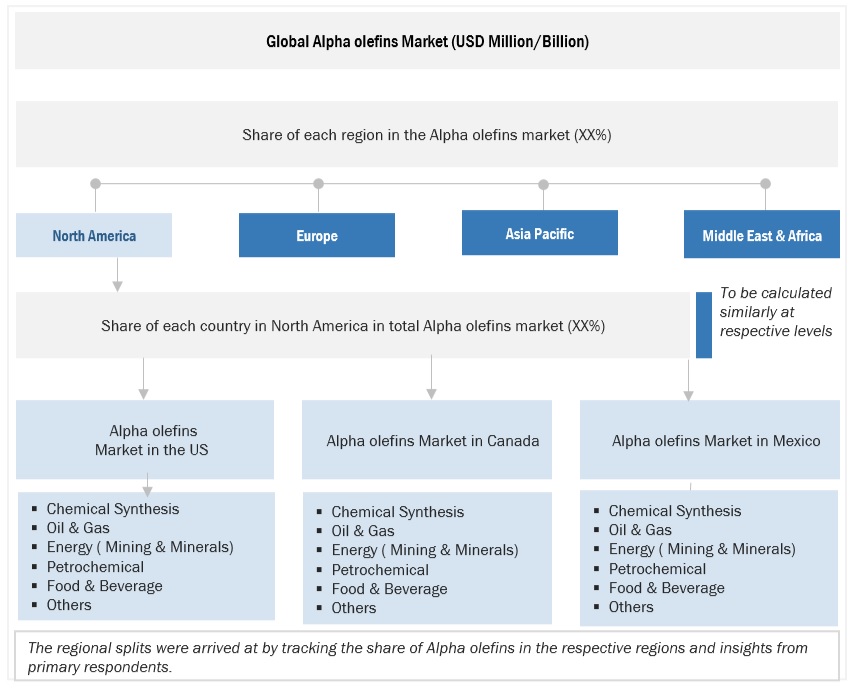
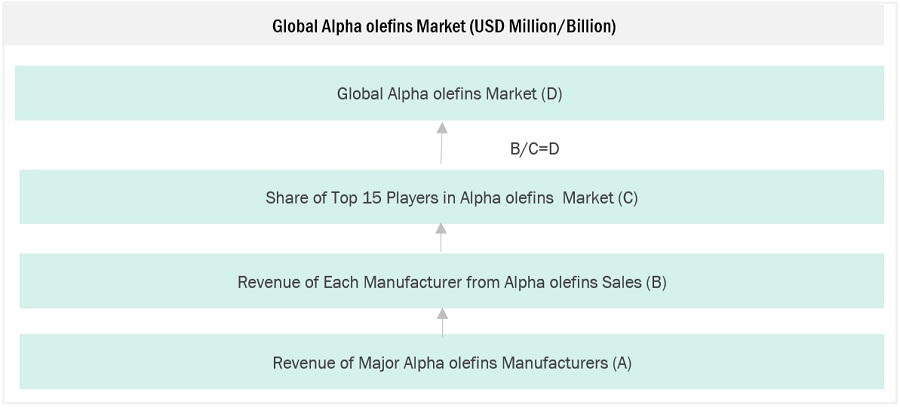
Both top-down and bottom-up approaches were used to estimate and validate the total size of the Alpha Olefins market. These methods were also used extensively to estimate the size of various subsegments in the market. The research methodology used to estimate the market size includes the following:
- The key players in the industry and market have been identified through extensive secondary research, and their market share in the respective regions has been determined through both primary and secondary research.
- The industry’s value chain and market size, in terms of value, have been determined through primary and secondary research processes.
- All percentage shares, splits, and breakdowns have been determined using secondary sources and verified through primary sources.
Global Alpha olefins Market Size: Bottom-up Approach
To know about the assumptions considered for the study, Request for Free Sample Report
Global Alpha Olefins Market Size: Top-Down Approach
Data Triangulation
After arriving at the overall market size from the estimation process explained above, the total market has been split into several segments and subsegments. To complete the overall market engineering process and arrive at the exact statistics for all the segments and subsegments, the data triangulation and market breakdown processes have been employed, wherever applicable. The data has been triangulated by studying various factors and trends from both the demand- and supply sides. Along with this, the market has been validated using both the top-down and bottom-up approaches.
Market Definition
The Alpha Olefins market encompasses the utilization of continuous Alpha Olefins principles and technologies, including various types, applications across industries, and regional market dynamics. The alpha olefins market refers to the global marketplace for the group of chemical compounds known as alpha olefins. Alpha olefins are unsaturated hydrocarbons containing a double bond at the primary carbon atom, which is the carbon atom directly adjacent to the end of the carbon chain. These compounds are versatile and are used to manufacture a variety of products in industries, such as plastics, chemicals, lubricants, and surfactants.
Key Stakeholders
- Alpha Olefins Manufacturers
- End-Use Industries
- Distributors and Suppliers
- Research and Development (R&D) Organizations
- Consumers and Consumer Advocacy Groups
Objectives of the Study
- To define, describe, segment, and forecast the Alpha olefins market size by technology, meter type, component, and application
- To provide detailed information on the major drivers, restraints, opportunities, and industry-specific challenges influencing the growth of the Alpha olefins market
- To strategically analyze the Alpha olefins market with respect to individual growth trends, prospects, and contributions of each segment to the market
- To analyze market opportunities for stakeholders and provide a detailed competitive landscape for market leaders
- To forecast the revenue of the market segments with respect to five main regions (along with countries), namely, North America, Europe, Asia Pacific, South America, and the Middle East & Africa
- To strategically profile key players and comprehensively analyze their market ranking and core competencies
- To track and analyze competitive developments such as new product developments, contracts & agreements, investments & expansions, and mergers & acquisitions in the Alpha Olefins market
Available Customizations:
With the given market data, MarketsandMarkets offers customizations as per the client’s specific needs. The following customization options are available for this report:
Geographic Analysis
Asia (China, Japan, South Korea, India, Singapore, and the Rest of Asia-Pacific), Europe (Germany, Italy, Belgium, France, Netherlands, Russia, and rest of Europe), North America (US, Canada, and Mexico), South America (Brazil, Venezuela, Argentina, Columbia, rest of South America), Middle East & Africa (Qatar, Saudi Arabia, UAE, Iran, rest of Middle East).


Growth opportunities and latent adjacency in Alpha Olefins Market
Want to check report avilability and sources used to publish the data
Looking for information on Specialty oil chemicals market
Specific information on production capacities of PAO by major market players
Data on market breakdown by product type of Alpha Olefin Market by application and regional growth trends, and value chain analysis.
Free report on alpha-olefin