Polyolefins Market by Type (Polethylene, Polypropylene, and Functional Polyolefins), Application (Film & Sheet, Injection Molding, Blow Molding, Fibers & Raffia), and Region - Global Forecasts to 2021


[263 Pages Report] The market size of polyolefins (PO) is projected to reach USD 297.09 Billion by 2021, at a CAGR of 7.82% during the forecast period. The years considered for the study includes:
Base Year: 2015
Forecast Period: 2016�2021
Objectives of the study:
- To define, describe, and forecast the PO market on the basis of type, application, and region
- To provide detailed information about the key factors influencing the growth of the market (drivers, restraints, opportunities, and challenges)
- To strategically analyze micromarkets with respect to individual growth trends, future prospects, and contribution to the overall market
- To analyze the opportunities in the market for stakeholders and provide a competitive landscape for market leaders
- To strategically profile key players and comprehensively analyze their market shares and core competencies
Top-down and bottom-up approaches have been used to estimate and validate the size of the market, and estimate the size of various other dependent submarkets in the overall PO market. The research study involves the extensive use of secondary sources, directories, and databases such as Hoovers, Bloomberg, Chemical Weekly, Factiva, ICIS, Securities and Exchange Commission (SEC), among other government and private websites, to identify and collect information useful for the technical, market-oriented, and commercial study of the PO market.
To know about the assumptions considered for the study, download the pdf brochure
PO is manufactured from various raw materials such as ethylene, propylene, alpha olefin, and catalysts. Chevron Phillips Chemical Company (U.S.), Sinopec Corp. (China), ExxonMobil Corporation (U.S.), and BASF SE (Germany) are the major raw material providers. These raw materials are supplied to the major manufacturers of PO such as The Dow Chemical Company (U.S.), Sinopec Corp. (China), ExxonMobil Corporation (U.S.), and Lyondell Basell Holdings B.V (Netherlands).
Key Target Audience:
- Manufacturers of PO
- Traders, distributors, and suppliers of PO
- Government and regional agencies and research organizations
- Investment research firms
Scope of the Report:
This research report categorizes the PO market on the basis of type, application, and region.
On the basis of Type:
- PE
- PP
- FPO
- Others
On the basis of PE Application:
- Film & Sheet
- Injection Molding
- Blow Molding
- Others
On the basis of PP Application:
- Film & Sheet
- Injection Molding
- Fibers & Raffia
- Others
On the basis of EVA Application:
- Film
- Extrusion Coating
- Injection Molding
- Compounding and Wire & Cable
- Other Non-extrusion
- Other Extrusion
On the basis of EPDM Application:
- Automotive
- Building & Construction
- Plastic Modification
- Others
On the basis of Region:
- North America
- Europe
- Asia-Pacific
- Middle East & Africa
- South America
The market is further analyzed on the basis of key countries in each of these regions.
Available Customizations:
With the given market data, MarketsandMarkets offers customizations according to the specific needs of the company. The following customization options are available for the report:
Regional Analysis:
- Country-level analysis of the PO market, by type.
Company Information:
- Detailed analysis and profiling of additional market players.
The market size of polyolefins (PO) is estimated to reach USD 297.09 Billion by 2021, at a CAGR of 7.82% during the forecast period. The market is driven by increasing demand from the plastic, packaging, building & construction, and transportation end-use industries. The need for PO is backed by increasing demand for plastic products in film & sheet, injection molding, extrusion coating, blow molding, and other applications.
Film & sheet is the largest end-use application of PO. Increasing use of films in automobile, construction, food & non-food packaging, and solar energy is one of the major drivers the PO market. PO materials such as PE, PP, and EVA are expected to show high demand in the film & sheet application. PE is the most widely used polymer in the plastic industry due to easy availability and cheaper processing techniques in comparison to other polymers. The primary driver for PO resin consumption is the increasing demand from developing countries. Growing preference of manufacturers for bio-based polyolefins products is also driving the market. The plastic industry has wide scope of expansion, which in turn is expected to increase the consumption of PO materials during the forecast period.
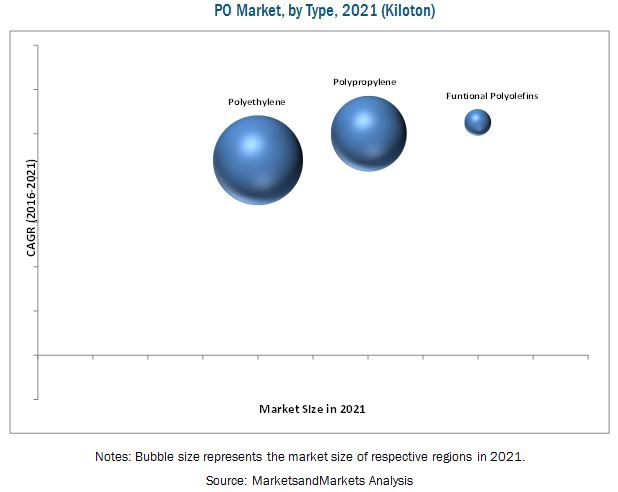
PO materials are segmented into PE, PP, and FPO, including EVA, EPDM, TPO, POE, and POP, based on type. In 2015, PE accounted for the largest market share, in terms of value and volume, and is projected to register the second-fastest growth in the PO market, between 2016 and 2021, owing to its superior properties and cost advantages over other PO products.
Asia-Pacific, North America, Europe, the Middle East & Africa, and South America are considered as the main regions for the PO market. Asia-Pacific dominates the market owing to increased population and rising demand for plastic products. The rising demand for high-quality PO products with superior physical properties has significantly increased the growth of the region�s process industry, which consequently has triggered the demand for PO. Film & sheet and injection molding are the top two end-use applications contributing to the growing demand for PO in Asia-Pacific.
High capacity-to-demand ratio is considered as a major restrain for the overall market. There has been a surge in plant capacities in the PO market, whereas the demand has been increasing at a moderate rate, resulting in higher capacity-to-demand ratio. Concerns over plastic disposal and stringent government regulations for increasing the use of paper products are also growing concerns of the PO market.
The global PO market is dominated by leading players such as Sinopec Corp. (China), LyondellBasell Industries Holdings B.V. (Netherlands), ExxonMobil Corporation (U.S.), and The Dow Chemical Company (U.S.). The diverse product portfolio, strategically positioned R&D centers, continuous adoption of development strategies, and technological advancements strengthen the market position of these companies in the PO market. They have been adopting various organic and inorganic growth strategies, such as new product launches, expansions, collaborations, & investments acquisitions, agreements, & technology transfers, to enhance their current market shares. This is expected to help the market evolve in more applications and expand their market shares.
To speak to our analyst for a discussion on the above findings, click Speak to Analyst
 Exclusive indicates content/data unique to MarketsandMarkets and not available with any competitors.
Table of Contents
1 Introduction (Page No. - 24)
1.1 Objectives of the Study
1.2 Market Definition
1.3 Scope of the Study
1.3.1 Years Considered for the Study
1.4 Currency
1.5 Package Size
1.6 Stakeholders
2 Research Methodology (Page No. - 27)
2.1 Research Data
2.1.1 Secondary Data
2.1.1.1 Key Data From Secondary Sources
2.1.2 Primary Data
2.1.2.1 Key Data From Primary Sources
2.1.2.2 Key Industry Insights
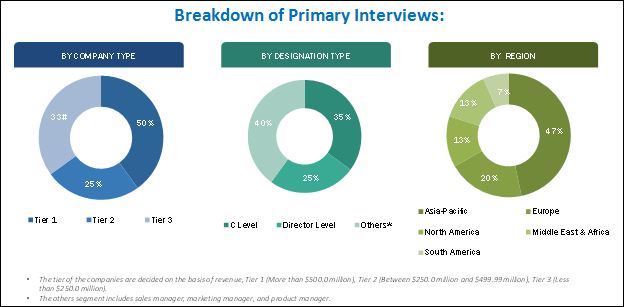
2.1.2.3 Breakdown of Primary Interviews
2.2 Market Size Estimation
2.3 Data Triangulation
2.4 Research Assumptions and Limitations
2.4.1 Assumptions
2.4.2 Limitations
3 Executive Summary (Page No. - 35)
4 Premium Insights (Page No. - 40)
4.1 PO Market Overview
4.2 PO Market Growth, By Type, 2016�2021
4.3 PE Market Share in Asia-Pacific, By Country and By Application
4.4 PE Market Share, By Region
4.5 PP Market Size, Top Five Countries
4.6 PE Market Attractiveness, By Application (2021)
4.7 Life Cycle Analysis, By Region
5 Market Overview (Page No. - 45)
5.1 Introduction
5.2 Market Segmentation
5.2.1 By Type
5.2.2 By Application
5.2.3 By Region
5.3 Market Dynamics
5.3.1 Drivers
5.3.1.1 Significant Growth in Solar Power Industry
5.3.1.2 Increasing Demand for Pos in Various Applications
5.3.2 Restraints
5.3.2.1 Higher Capacity to Demand Ratio
5.3.2.2 Rising Concerns Pertaining to Plastic Disposal
5.3.3 Opportunities
5.3.3.1 Increasing Demand for Metallocene-Based PO
5.3.3.2 Manufacturing of Bio-Based PO
5.3.4 Challenges
5.3.4.1 Fluctuation in Crude Oil Prices
5.3.4.2 Threats Posed By EVA Pv Encapsulation
6 Industry Trends (Page No. - 52)
6.1 Introduction
6.2 Value Chain Analysis
6.3 Porter�s Five Forces Analysis
6.3.1 Threat of New Entrants
6.3.2 Threat of Substitutes
6.3.3 Bargaining Power of Suppliers
6.3.4 Bargaining Power of Buyers
6.3.5 Intensity of Competitive Rivalry
6.4 Macroeconomic Overview and Trends
6.4.1 Plastic Industry Trends
6.4.1.1 Plastic Production Overview in North America
6.4.1.2 Plastic Production Overview in Europe
6.4.1.3 Plastic Production Overview in Asia-Pacific
6.4.1.4 Plastic Production Overview in Middle East & Africa
6.4.1.5 Plastic Production Overview in South America
6.5 Polyolefins Patents, 2015
7 PE Market, By Type, Catalyst, and Application (Page No. - 63)
7.1 Introduction
7.2 PE Market, By Type
7.2.1 Introduction
7.2.2 LDPE
7.2.3 LLDPE
7.2.4 HDPE
7.2.5 Others
7.3 PE Market, By Catalyst
7.3.1 Introduction
7.3.2 Ziegler-Natta Pe
7.3.3 Metallocene Pe
7.3.4 Chromium Pe
7.4 PE Market, By Application
7.4.1 Introduction
7.4.2 Film & Sheet
7.4.3 Injection Molding
7.4.4 Blow Molding
7.4.5 Others
8 PP Market, By Type, By Catalyst, and By Application (Page No. - 81)
8.1 Introduction
8.2 PP Market, By Type
8.2.1 Introduction
8.2.2 PP Homopolymer
8.2.3 PP Copolmer
8.2.4 Random Copolymer PP
8.3 PP Market, By Catalyst
8.3.1 Introduction
8.3.2 Ziegler-Natta PP
8.3.3 Metallocene PP
8.4 PP Market, By Application
8.4.1 Introduction
8.4.2 Film & Sheet
8.4.3 Injection Molding
8.4.4 Fibers & Raffia
8.4.5 Others
9 Functional PO, By Type (Page No. - 93)
9.1 Introduction
9.2 Functional PO Market, By Type
9.2.1 Introduction
9.2.2 EVA
9.2.2.1 EVA Market, By Application
9.2.2.1.1 Introduction
9.2.2.1.2 Film
9.2.2.1.3 Extrusion Coating
9.2.2.1.4 Injection Molding
9.2.2.1.5 Compounding and Wire & Cable
9.2.2.1.6 Other Non-Extrusion
9.2.2.1.7 Other Extrusion
9.2.3 EPDM
9.2.3.1 EPDM Market, By Application
9.2.3.1.1 Automotive
9.2.3.1.2 Building & Construction
9.2.3.1.3 Plastic Modification
9.2.3.1.4 Others
9.2.4 TPO
9.2.5 POE
9.2.6 POP
10 PO Market, By Region (Page No. - 115)
10.1 Introduction
10.2 Asia-Pacific
10.2.1 China
10.2.2 India
10.2.3 Japan
10.2.4 South Korea
10.2.5 Thailand
10.2.6 Indonesia
10.2.7 Taiwan
10.2.8 Rest of Asia-Pacific
10.3 Europe
10.3.1 Germany
10.3.2 Italy
10.3.3 France
10.3.4 U.K.
10.3.5 Spain
10.3.6 Rest of Europe
10.4 North America
10.4.1 U.S.
10.4.2 Canada
10.4.3 Mexico
10.5 Middle East & Africa
10.5.1 Turkey
10.5.2 Saudi Arabia
10.5.3 Rest of Middle East & Africa
10.6 South America
10.6.1 Brazil
10.6.2 Argentina
10.6.3 Rest of South America
11 Competitive Landscape (Page No. - 198)
11.1 Overview
11.2 Polyolefin Market Share Analysis
11.2.1 PE Market Share
11.2.2 PP Market Share
11.2.3 EVA Market Share
11.2.4 EPDM Market Share
11.3 Key Growth Strategies in the Polyolefin Market, 2011-2016
11.4 Competitive Situation and Trends
11.4.1 New Product Launch
11.4.2 Expansion, Collaboration, and Investment
11.4.3 Acquisition and Agreement
12 Company Profile (Page No. - 209)
(Overview, Products and Services, Financials, Strategy & Development)*
12.1 Sinopec Corporation
12.2 Lyondellbasell Industries Holdings N.V.
12.3 Exxonmobil Chemical
12.4 Petrochina Company Limited
12.5 Saudi Arabia Basic Industries Corporation
12.6 The DOW Chemical Company
12.7 Braskem S.A.
12.8 Total S.A.
12.9 Arkema S.A.
12.10 Borealis AG
12.11 Ineos Group AG
12.12 Abu Dhabi Polymers Company Ltd. (Borouge)
12.13 Chevron Phillips Chemical Company LLC
12.14 ENI S.P.A.
12.15 Formosa Plastics Corporation
12.16 Polyone Corporation
12.17 Sasol Ltd.
12.18 Tosoh Corporation
12.19 Reliance Industries Limited (RIL)
12.20 Repsol
*Details on Overview, Products and Services, Financials, Strategy & Development Might Not Be Captured in Case of Unlisted Companies
13 Appendix (Page No. - 256)
13.1 Insights From Industry Experts
13.2 Discussion Guide
13.3 Knowledge Store: Marketsandmarkets� Subscription Portal
13.4 Introducing RT: Real-Time Market Intelligence
13.5 Available Customizations
13.6 Related Reports
List of Tables (309 Tables)
Table 1 PO Market to Register Moderate Growth Between 2016 and 2021
Table 2 Plastic Production Analysis in Europe, 2014�2021 (USD Million)
Table 3 Plastic Production Analysis in Asia-Pacific, 2014�2021 (USD Million)
Table 4 Plastic Production Analysis in Middle East & Africa, 2014�2021 (USD Million)
Table 5 Plastic Production Analysis in South America, 2014�2021 (USD Million)
Table 6 Polyolefin Patents Filed in 2015
Table 7 PE Market Size, By Region, 2014�2021 (USD Billion)
Table 8 PE Market Size, By Region, 2014�2021 (Kiloton)
Table 9 PE Market Size, By Type, 2014�2021 (USD Billion)
Table 10 PE Market Size, By Type, 2014�2021 (Kiloton)
Table 11 LDPE Market Size, By Region, 2014-2020 (USD Million)
Table 12 LDPE Market Size, By Region, 2014�2021 (Kiloton)
Table 13 LLDPE Market Size, By Region, 2014�2021 (USD Million)
Table 14 LLDPE Market Size, By Region, 2014�2021 (Kiloton)
Table 15 HDPE Market Size, By Region, 2014�2021 (USD Million)
Table 16 HDPE Market Size, By Region, 2014�2021 (Kiloton)
Table 17 Others Market Size, By Region, 2014�2021 (USD Million)
Table 18 Others Market Size, By Region, 2014�2021 (Kiloton)
Table 19 PE Market Size, By Catalyst, 2014�2021 (Kiloton)
Table 20 Ziegler-Natta PE Market Size, By Region, 2014�2021 (Kiloton)
Table 21 Metallocene PE Market Size, By Region, 2014�2021 (Kiloton)
Table 22 Chromium PE Catalyst Market Size, By Region, 2014�2021 (Kiloton)
Table 23 PE Market Size, By Application, 2014�2021 (USD Billion)
Table 24 PE Market Size, By Application, 2014�2021 (Kiloton)
Table 25 PE Market Size in Film & Sheet, By Region, 2014�2021 (USD Million)
Table 26 PE Market Size in Film & Sheet, By Region, 2014�2021 (Kiloton)
Table 27 PE Market Size in Injection Molding, By Region, 2014�2021 (USD Million)
Table 28 PE Market Size in Injection Molding, By Region, 2014�2021 (Kiloton)
Table 29 PE Market Size in Blow Molding Application, By Region, 2014�2021 (USD Million)
Table 30 PE Market Size in Blow Molding Application, By Region, 2014�2021 (Kiloton)
Table 31 PE Market Size in Other Applications, By Region, 2014�2021 (USD Million)
Table 32 PE Market Size in Other Applications, By Region, 2014�2021 (Kiloton)
Table 33 PP Market Size, By Region, 2014�2021 (USD Million)
Table 34 PP Market Size, By Region, 2014�2021 (Kiloton)
Table 35 PP Market Size, By Region, 2014�2021 (Kiloton)
Table 36 Ziegler-Natta PP, By Region, 2014�2021 (Kiloton)
Table 37 Metallocene PP, By Region, 2014�2021 (Kiloton)
Table 38 PP Market Size, By Application, 2014�2021 (USD Million)
Table 39 PP Market Size, By Application, 2014�2021 (Kiloton)
Table 40 PP Market Size in Film & Sheet Application, By Region, 2014�2021 (USD Million)
Table 41 PP Market Size in Film & Sheet Application, By Region, 2014�2021 (Kiloton)
Table 42 PP Market Size in Injection Molding Application, By Region, 2014�2021 (USD Million)
Table 43 PP Market Size in Injection Molding Application, By Region, 2014�2021 (Kiloton)
Table 44 PP Market Size in Fibers & Raffia Application, By Region, 2014�2021 (USD Million)
Table 45 PP Market Size in Fibers & Raffia Application, By Region, 2014�2021 (Kiloton)
Table 46 PP Market Size in Other Applications, By Region, 2014�2021 (USD Million)
Table 47 PP Market Size in Other Applications, By Region, 2014�2021 (Kiloton)
Table 48 Functional P0 Market Size, By Region, 2014�2021 (USD Million)
Table 49 Functional P0 Market Size, By Region, 2014�2021 (Kiloton)
Table 50 Functional P0 Market Size, By Type, 2014�2021 (USD Million)
Table 51 Functional P0 Market Size, By Type, 2014�2021 (Kiloton)
Table 52 EVA Market Size, By Region, 2014�2021 (USD Million)
Table 53 EVA Market Size, By Region, 2014�2021 (Kiloton)
Table 54 EVA Market Size in Film Application, By Region, 2014�2021 (USD Million)
Table 55 EVA Market Size in Film Application, By Region, 2014�2021 (Kiloton)
Table 56 EVA Market Size in Extrusion Coating Application, By Region, 2014�2021 (USD Million)
Table 57 EVA Market Size in Extrusion Coating Application, By Region, 2014�2021 (Kiloton)
Table 58 EVA Market Size in Injection Molding Application, By Region, 2014�2021 (USD Million)
Table 59 EVA Market Size in Injection Molding Application, By Region, 2014�2021 (Kiloton)
Table 60 EVA Market Size in Compounding and Wire & Cable Applications, By Region, 2014�2021 (USD Million)
Table 61 EVA Market Size in Compounding and Wire & Cable Applications, By Region, 2014�2021 (Kiloton)
Table 62 EVA Market Size in Other Non-Extrusion Applications, By Region, 2014�2021 (USD Million)
Table 63 EVA Market Size in Other Non-Extrusion Applications, By Region, 2014�2021 (Kiloton)
Table 64 EVA Market Size in Other Extrusion Applications, By Region, 2014�2021 (USD Million)
Table 65 EVA Market Size in Other Extrusion Applications, By Region, 2014�2021 (Kiloton)
Table 66 EPDM Market Size, By Region, 2014�2021 (USD Million)
Table 67 EPDM Market Size, By Region, 2014�2021 (Kiloton)
Table 68 EPDM Market Size in Automotive Application, By Region, 2014�2021 (USD Million)
Table 69 EPDM Market Size in Automotive Application, By Region, 2014�2021 (Kiloton)
Table 70 EPDM Market in Building & Construction Application, By Region, 2014�2021 (USD Million)
Table 71 EPDM Market in Building & Construction Application, By Region, 2014�2021 (Kiloton)
Table 72 EPDM Market Size in Plastic Modification Application, By Region, 2014�2021 (USD Million)
Table 73 EPDM Market Size in Plastic Modification Application, By Region, 2014�2021 (Kiloton)
Table 74 EPDM Market Size in Other Applications, By Region, 2014�2021 (USD Million)
Table 75 EPDM Market Size in Other Applications, By Region, 2014�2021 (Kiloton)
Table 76 TPO Market Size, By Region, 2014�2021 (USD Million)
Table 77 TPO Market Size, Region, 2014�2021 (Kiloton)
Table 78 POE Market Size, By Region, 2014�2021 (USD Million)
Table 79 POE Market Size, Region, 2014�2021 (Kiloton)
Table 80 POP Market Size, By Region, 2014�2021 (USD Million)
Table 81 POP Market Size, Region, 2014�2021 (Kiloton)
Table 82 PO Market Size, By Region, 2014�2021 (USD Billion)
Table 83 PO Market Size, By Region, 2014�2021 ( Thousand Kiloton)
Table 84 PO Market Size, By Type, 2014�2021 (USD Billion)
Table 85 PO Market Size, By Type, 2014�2021 (Thousand Kiloton)
Table 86 PE Market Size, By Region, 2014�2021 (USD Billion)
Table 87 PE Market Size, By Region, 2014�2021 (Kiloton)
Table 88 PP Market Size, By Region, 2014�2021 (USD Million)
Table 89 PP Market Size, By Region, 2014�2021 (Kiloton)
Table 90 Functional PO Market Size, By Region, 2014�2021 (USD Million)
Table 91 Functional PO Market Size, By Region, 2014�2021 (Kiloton)
Table 92 EVA Functional PO Market Size, By Region, 2014�2021 (USD Million)
Table 93 EVA Functional PO Market Size, By Region, 2014�2021 (Kiloton)
Table 94 EPDM Functional PO Market Size, By Region, 2014�2021 (USD Million)
Table 95 EPDM Functional PO Market Size, By Region, 2014�2021 (Kiloton)
Table 96 TPO Functional PO Market Size, By Region, 2014�2021 (USD Million)
Table 97 TPO Functional PO Market Size, By Region, 2014�2021 (Kiloton)
Table 98 POE Functional PO Market Size, By Region, 2014�2021 (USD Million)
Table 99 POE Functional PO Market Size, By Region, 2014�2021 (Kiloton)
Table 100 POP Functional PO Market Size, By Region, 2014�2021 (USD Million)
Table 101 POP Functional PO Market Size, By Region, 2014�2021 (Kiloton)
Table 102 Asia-Pacific: PE Market Size, By Country, 2014�2021 (USD Million)
Table 103 Asia-Pacific: PE Market Size, By Country, 2014�2021 (Kiloton)
Table 104 Asia-Pacific: PE Market Size, By Type, 2014�2021 (USD Million)
Table 105 Asia-Pacific: PE Market Size, By Type, 2014�2021 (Kiloton)
Table 106 Asia-Pacific: PE Market Size, By Catalyst, 2014�2021 (Kiloton)
Table 107 Asia-Pacific: PE Market Size, By Application, 2014�2021 (USD Million)
Table 108 Asia-Pacific: PE Market Size, By Application, 2014�2021 (Kiloton)
Table 109 Asia-Pacific: PP Market Size, By Country, 2014�2021 (USD Million)
Table 110 Asia-Pacific: PP Market Size, By Country, 2014�2021 (Kiloton)
Table 111 Asia-Pacific: PP Market Size, By Catalyst, 2014�2021 (Kiloton)
Table 112 Asia-Pacific: PP Market Size, By Application, 2014�2021 (USD Million)
Table 113 Asia-Pacific: PP Market Size, By Application, 2014�2021 (Kiloton)
Table 114 Asia-Pacific: Functional PO Market Size, By Type, 2014�2021 (USD Million)
Table 115 Asia-Pacific: Functional PO Market Size, By Type, 2014�2021 (Kiloton)
Table 116 China: PE Market Size, By Type, 2014�2021 (USD Million)
Table 117 China: PE Market Size, By Type, 2014�2021 (Kiloton)
Table 118 China: PE Market Size, By Application, 2014�2021 (USD Million)
Table 119 China: PE Market Size, By Application, 2014�2021 (Kiloton)
Table 120 China: PP Market Size, By Application, 2014�2021 (USD Million)
Table 121 China: PP Market Size, By Application, 2014�2021 (Kiloton)
Table 122 India: PE Market Size, By Type, 2014�2021 (USD Million)
Table 123 India: PE Market Size, By Type, 2014�2021 (Kiloton)
Table 124 India: PE Market Size, By Application, 2014�2021 (USD Million)
Table 125 India: PE Market Size, By Application, 2014�2021 (Kiloton)
Table 126 India: PP Market Size, By Application, 2014�2021 (USD Million)
Table 127 India: PP Market Size, By Application, 2014�2021 (Kiloton)
Table 128 Japan: PE Market Size, By Type, 2014�2021 (USD Million)
Table 129 Japan: PE Market Size, By Type, 2014�2021 (Kiloton)
Table 130 Japan: PE Market Size, By Application, 2014�2021 (USD Million)
Table 131 Japan: PE Market Size, By Application, 2014�2021 (Kiloton)
Table 132 Japan: PP Market Size, By Application, 2014�2021 (USD Million)
Table 133 Japan: PP Market Size, By Application, 2014�2021 (Kiloton)
Table 134 South Korea: PE Market Size, By Type, 2014�2021 (USD Million)
Table 135 South Korea: PE Market Size, By Type, 2014�2021 (Kiloton)
Table 136 South Korea: PE Market Size, By Application, 2014�2021 (USD Million)
Table 137 South Korea: PE Market Size, By Application, 2014�2021 (Kiloton)
Table 138 South Korea: PP Market Size, By Application, 2014�2021 (USD Million)
Table 139 South Korea: PP Market Size, By Application, 2014�2021 (Kiloton)
Table 140 Thailand: PE Market Size, By Type, 2014�2021 (USD Million)
Table 141 Thailand: PE Market Size, By Type, 2014�2021 (Kiloton)
Table 142 Thailand: PE Market Size, By Application, 2014�2021 (USD Million)
Table 143 Thailand: PE Market Size, By Application, 2014�2021 (Kiloton)
Table 144 Thailand: PP Market Size, By Application, 2014�2021 (USD Million)
Table 145 Thailand: PP Market Size, By Application, 2014�2021 (Kiloton)
Table 146 Indonesia: PE Market Size, By Type, 2014�2021 (USD Million)
Table 147 Indonesia: PE Market Size, By Type, 2014�2021 (Kiloton)
Table 148 Indonesia: PE Market Size, By Application, 2014�2021 (USD Million)
Table 149 Indonesia: PE Market Size, By Application, 2014�2021 (Kiloton)
Table 150 Indonesia: PP Market Size, By Application, 2014�2021 (USD Million)
Table 151 Indonesia: PP Market Size, By Application, 2014�2021 (Kiloton)
Table 152 Taiwan: PE Market Size, By Type, 2014�2021 (USD Million)
Table 153 Taiwan: PE Market Size, By Type, 2014�2021 (Kiloton)
Table 154 Taiwan: PE Market Size, By Application, 2014�2021 (USD Million)
Table 155 Taiwan: PE Market Size, By Application, 2014�2021 (Kiloton)
Table 156 Taiwan: PP Market Size, By Application, 2014�2021 (USD Million)
Table 157 Taiwan: PP Market Size, By Application, 2014�2021 (Kiloton)
Table 158 Rest of Asia-Pacific: PE Market Size, By Type, 2014�2021 (USD Million)
Table 159 Rest of Asia-Pacific: PE Market Size, By Type, 2014�2021 (Kiloton)
Table 160 Rest of Asia-Pacific: PE Market Size, By Application, 2014�2021 (USD Million)
Table 161 Rest of Asia-Pacific: PE Market Size, By Application, 2014�2021 (Kiloton)
Table 162 Rest of Asia-Pacific: PP Market Size, By Application, 2014�2021 (USD Million)
Table 163 Rest of Asia-Pacific: PP Market Size, By Application, 2014�2021 (Kiloton)
Table 164 Europe: PE Market Size, By Country, 2014�2021 (USD Million)
Table 165 Europe: PE Market Size, By Country, 2014�2021 (Kiloton)
Table 166 Europe: PE Market Size, By Type, 2014�2021 (USD Million)
Table 167 Europe: PE Market Size, By Type, 2014�2021 (Kiloton)
Table 168 Europe: PE Market Size, By Catalyst, 2014�2021 (Kiloton)
Table 169 Europe: PE Market Size, By Application, 2014�2021 (USD Million)
Table 170 Europe: PE Market Size, By Application, 2014�2021 (Kiloton)
Table 171 Europe: PP Market Size, By Country, 2014�2021 (USD Million)
Table 172 Europe: PP Market Size, By Country, 2014�2021 (Kiloton)
Table 173 Europe: PP Market Size, By Catalyst, 2014�2021 (Kiloton)
Table 174 Europe: PP Market Size, By Application, 2014�2021 (USD Million)
Table 175 Europe: PP Market Size, By Application, 2014�2021 (Kiloton)
Table 176 Europe: Functional PO Market Size, By Type, 2014�2021 (USD Million)
Table 177 Europe: Functional PO Market Size, By Type, 2014�2021 (Kiloton)
Table 178 Germany: PE Market Size, By Type, 2014�2021 (USD Million)
Table 179 Germany: PE Market Size, By Type, 2014�2021 (Kiloton)
Table 180 Germany: PE Market Size, By Application, 2014�2021 (USD Million)
Table 181 Germany: PE Market Size, By Application, 2014�2021 (Kiloton)
Table 182 Germany: PP Market Size, By Application, 2014�2021 (USD Million)
Table 183 Germany: PP Market Size, By Application, 2014�2021 (Kiloton)
Table 184 Italy: PE Market Size, By Type, 2014�2021 (USD Million)
Table 185 Italy: PE Market Size, By Type, 2014�2021 (Kiloton)
Table 186 Italy: PE Market Size, By Application, 2014�2021 (USD Million)
Table 187 Italy: PE Market Size, By Application, 2014�2021 (Kiloton)
Table 188 Italy: PP Market Size, By Application, 2014�2021 (USD Million)
Table 189 Italy: PP Market Size, By Application, 2014�2021 (Kiloton)
Table 190 France: PE Market Size, By Type, 2014�2021 (USD Million)
Table 191 France: PE Market Size, By Type, 2014�2021 (Kiloton)
Table 192 France: PE Market Size, By Application, 2014�2021 (USD Million)
Table 193 France: PE Market Size, By Application, 2014�2021 (Kiloton)
Table 194 France: PP Market Size, By Application, 2014�2021 (USD Million)
Table 195 France: PP Market Size, By Application, 2014�2021 (Kiloton)
Table 196 U.K.: PE Market Size, By Type, 2014�2021 (USD Million)
Table 197 U.K.: PE Market Size, By Type, 2014�2021 (Kiloton)
Table 198 U.K.: PE Market Size, By Application, 2014�2021 (USD Million)
Table 199 U.K.: PE Market Size, By Application, 2014�2021 (Kiloton)
Table 200 U.K.: PP Market Size, By Application, 2014�2021 (USD Million)
Table 201 U.K.: PP Market Size, By Application, 2014�2021 (Kiloton)
Table 202 Spain: PE Market Size, By Type, 2014�2021 (USD Million)
Table 203 Spain: PE Market Size, By Type, 2014�2021 (Kiloton)
Table 204 Spain: PE Market Size, By Application, 2014�2021 (USD Million)
Table 205 Spain: PE Market Size, By Application, 2014�2021 (Kiloton)
Table 206 Spain: PP Market Size, By Application, 2014�2021 (USD Million)
Table 207 Spain: PP Market Size, By Application, 2014�2021 (Kiloton)
Table 208 Rest of Europe: PE Market Size, By Type, 2014�2021 (USD Million)
Table 209 Rest of Europe: PE Market Size, By Type, 2014�2021 (Kiloton)
Table 210 Rest of Europe: PE Market Size, By Application, 2014�2021 (USD Million)
Table 211 Rest of Europe: PE Market Size, By Application, 2014�2021 (Kiloton)
Table 212 Rest of Europe: PP Market Size, By Application, 2014�2021 (USD Million)
Table 213 Rest of Europe: PP Market Size, By Application, 2014�2021 (Kiloton)
Table 214 North America: PE Market Size, By Country, 2014�2021 (USD Million)
Table 215 North America: PE Market Size, By Country, 2014�2021 (Kiloton)
Table 216 North America: PE Market Size, By Type, 2014�2021 (USD Million)
Table 217 North America: PE Market Size, By Type, 2014�2021 (Kiloton)
Table 218 North America: PE Market Size, By Catalyst, 2014�2021 (Kiloton)
Table 219 North America: PE Market Size, By Application, 2014�2021 (USD Million)
Table 220 North America: PE Market Size, By Application, 2014�2021 (Kiloton)
Table 221 North America: PP Market Size, By Country, 2014�2021 (USD Million)
Table 222 North America: PP Market Size, By Country, 2014�2021 (Kiloton)
Table 223 North America: PP Market Size, By Catalyst, 2014�2021 (Kiloton)
Table 224 North America: PP Market Size, By Application, 2014�2021 (USD Million)
Table 225 North America: PP Market Size, By Application, 2014�2021 (Kiloton)
Table 226 North America: Functional PO Market Size, By Type, 2014�2021 (USD Million)
Table 227 North America: Functional PO Market Size, By Type, 2014�2021 (Kiloton)
Table 228 U.S.: PE Market Size, By Type, 2014�2021 (USD Million)
Table 229 U.S.: PE Market Size, By Type, 2014�2021 (Kiloton)
Table 230 U.S.: PE Market Size, By Application, 2014�2021 (USD Million)
Table 231 U.S.: PE Market Size, By Application, 2014�2021 (Kiloton)
Table 232 U.S.: PP Market Size, By Application, 2014�2021 (USD Million)
Table 233 U.S.: PP Market Size, By Application, 2014�2021 (Kiloton)
Table 234 Canada: PE Market Size, By Type, 2014�2021 (USD Million)
Table 235 Canada: PE Market Size, By Type, 2014�2021 (Kiloton)
Table 236 Canada: PE Market Size, By Application, 2014�2021 (USD Million)
Table 237 Canada: PE Market Size, By Application, 2014�2021 (Kiloton)
Table 238 Canada: PP Market Size, By Application, 2014�2021 (USD Million)
Table 239 Canada: PP Market Size, By Application, 2014�2021 (Kiloton)
Table 240 Mexico: PE Market Size, By Type, 2014�2021 (USD Million)
Table 241 Mexico: PE Market Size, By Type, 2014�2021 (Kiloton)
Table 242 Mexico: PE Market Size, By Application, 2014�2021 (USD Million)
Table 243 Mexico: PE Market Size, By Application, 2014�2021 (Kiloton)
Table 244 Mexico: PP Market Size, By Application, 2014�2021 (USD Million)
Table 245 Mexico: PP Market Size, By Application, 2014�2021 (Kiloton)
Table 246 Middle East & Africa: PE Market Size, By Country, 2014�2021 (USD Million)
Table 247 Middle East & Africa: PE Market Size, By Country, 2014�2021 (Kiloton)
Table 248 Middle East & Africa: PE Market Size, By Type, 2014�2021 (USD Million)
Table 249 Middle East & Africa: PE Market Size, By Type, 2014�2021 (Kiloton)
Table 250 Middle East & Africa: PE Market Size, By Catalyst, 2014�2021 (Kiloton)
Table 251 Middle East & Africa: PE Market Size, By Application, 2014�2021 (USD Million)
Table 252 Middle East & Africa: PE Market Size, By Application, 2014�2021 (Kiloton)
Table 253 Middle East & Africa: PP Market Size, By Country, 2014�2021 (USD Million)
Table 254 Middle East & Africa: PP Market Size, By Country, 2014�2021 (Kiloton)
Table 255 Middle East & Africa: PP Market Size, By Catalyst, 2014�2021 (Kiloton)
Table 256 Middle East & Africa: PP Market Size, By Application, 2014�2021 (USD Million)
Table 257 Middle East & Africa: PP Market Size, By Application, 2014�2021 (Kiloton)
Table 258 Middle East & Africa: Functional PO Market Size, By Type, 2014�2021 (USD Million)
Table 259 Middle East & Africa: Functional PO Market Size, By Type, 2014�2021 (Kiloton)
Table 260 Turkey: PE Market Size, By Type, 2014�2021 (USD Million)
Table 261 Turkey: PE Market Size, By Type, 2014�2021 (Kiloton)
Table 262 Turkey: PE Market Size, By Application, 2014�2021 (USD Million)
Table 263 Turkey: PE Market Size, By Application, 2014�2021 (Kiloton)
Table 264 Turkey: PP Market Size, By Application, 2014�2021 (USD Million)
Table 265 Turkey: PP Market Size, By Application, 2014�2021 (Kiloton)
Table 266 Saudi Arabia: PE Market Size, By Type, 2014�2021 (USD Million)
Table 267 Saudi Arabia: PE Market Size, By Type, 2014�2021 (Kiloton)
Table 268 Saudi Arabia: PE Market Size, By Application, 2014�2021 (USD Million)
Table 269 Saudi Arabia: PE Market Size, By Application, 2014�2021 (Kiloton)
Table 270 Saudi Arabia: PP Market Size, By Application, 2014�2021 (USD Million)
Table 271 Saudi Arabia: PP Market Size, By Application, 2014�2021 (Kiloton)
Table 272 Rest of Middle East & Africa: PE Market Size, By Type, 2014�2021 (USD Million)
Table 273 Rest of Middle East & Africa: PE Market Size, By Type, 2014�2021 (Kiloton)
Table 274 Rest of Middle East & Africa: PE Market Size, By Application, 2014�2021 (USD Million)
Table 275 Rest of Middle East & Africa: PE Market Size, By Application, 2014�2021 (Kiloton)
Table 276 Rest of Middle East & Africa: PP Market Size, By Application, 2014�2021 (USD Million)
Table 277 Rest of Middle East & Africa: PP Market Size, By Application, 2014�2021 (Kiloton)
Table 278 South America: PE Market Size, By Country, 2014�2021 (USD Million)
Table 279 South America: PE Market Size, By Country, 2014�2021 (Kiloton)
Table 280 South America: PE Market Size, By Type, 2014�2021 (USD Million)
Table 281 South America: PE Market Size, By Type, 2014�2021 (Kiloton)
Table 282 South America: PE Market Size, By Catalyst, 2014�2021 (Kiloton)
Table 283 South America: PE Market Size, By Application, 2014�2021 (USD Million)
Table 284 South America: PE Market Size, By Application, 2014�2021 (Kiloton)
Table 285 South America: PP Market Size, By Country, 2014�2021 (USD Million)
Table 286 South America: PP Market Size, By Country, 2014�2021 (Kiloton)
Table 287 South America: PP Market Size, By Catalyst, 2014�2021 (Kiloton)
Table 288 South America: PP Market Size, By Application, 2014�2021 (USD Million)
Table 289 South America: PP Market Size, By Application, 2014�2021 (Kiloton)
Table 290 South America: Functional PO Market Size, By Type, 2014�2021 (USD Million)
Table 291 South America: Functional PO Market Size, By Type, 2014�2021 (Kiloton)
Table 292 Brazil: PE Market Size, By Type, 2014�2021 (USD Million)
Table 293 Brazil: PE Market Size, By Type, 2014�2021 (Kiloton)
Table 294 Brazil: PE Market Size, By Application, 2014�2021 (USD Million)
Table 295 Brazil: PE Market Size, By Application, 2014�2021 (Kiloton)
Table 296 Brazil: PP Market Size, By Application, 2014�2021 (USD Million)
Table 297 Brazil: PP Market Size, By Application, 2014�2021 (Kiloton)
Table 298 Argentina: PE Market Size, By Type, 2014�2021 (USD Million)
Table 299 Argentina: PE Market Size, By Type, 2014�2021 (Kiloton)
Table 300 Argentina: PE Market Size, By Application, 2014�2021 (USD Million)
Table 301 Argentina: PE Market Size, By Application, 2014�2021 (Kiloton)
Table 302 Argentina: PP Market Size, By Application, 2014�2021 (USD Million)
Table 303 Argentina: PP Market Size, By Application, 2014�2021 (Kiloton)
Table 304 Rest of South America: PE Market Size, By Type, 2014�2021 (USD Million)
Table 305 Rest of South America: PE Market Size, By Type, 2014�2021 (Kiloton)
Table 306 Rest of South America: PE Market Size, By Application, 2014�2021 (USD Million)
Table 307 Rest of South America: PE Market Size, By Application, 2014�2021 (Kiloton)
Table 308 Rest of South America: PP Market Size, By Application, 2014�2021 (USD Million)
Table 309 Rest of South America: PP Market Size, By Application, 2014�2021 (Kiloton)
List of Figures (78 Figures)
Figure 1 PO Market: Research Design
Figure 2 Bottom-Up Approach
Figure 3 Top-Down Approach
Figure 4 Research Methodology: Data Triangulation
Figure 5 Functional PO Segment to Register the Highest CAGR in PO Market During Forecast Period
Figure 6 Film & Sheet Application to Dominate PE Market During the Forecast Period
Figure 7 HDPE Projected to Dominate the PE Market During the Forecast Period
Figure 8 EVA: South America to Be the Fastest-Growing Region During Forecast Period
Figure 9 Asia-Pacific Dominated PO Market in 2015
Figure 10 PO Market to Grow at Moderate Pace
Figure 11 PP: Fastest-Growing Type of PO Between 2016 and 2021
Figure 12 Film & Sheet Accounted for the Largest Share of PE Market in Asia-Pacific in 2015
Figure 13 China Accounted for the Largest Share in PE Market, 2015
Figure 14 China Will Continue to Dominate PP Market in the Forecast Period
Figure 15 Injection Molding and Blow Molding to Be the Most Attractive Markets for PE Between 2016 and 2021
Figure 16 PO Market in Asia-Pacific to Grow Rapidly During Forecast Period
Figure 17 Drivers, Restraints, Opportunities, and Challenges in PO Market
Figure 18 Fluctuations of Crude Oil Price, January 2014�August 2016
Figure 19 Maximum Value is Added During the Manufacturing Stage
Figure 20 Porter�s Five Forces Analysis
Figure 21 Plastic Production Analysis in North America, 2014�2021 (USD Million))
Figure 22 U.S. to Dominate the Plastic Industry in North America 2016 vs 2021
Figure 23 Other European Countries Dominate the Plastic Industry in Europe, 2016 vs 2021
Figure 24 China Dominates the Plastic Industry in Asia-Pacific, 2016 vs 2021
Figure 25 Turkey Dominates the Plastic Industry in Middle East & Africa, 2016 vs 2021
Figure 26 Other Countries of South America Dominate the Plastic Industry, 2016 vs 2021
Figure 27 Asia-Pacific to Register Highest CAGR During the Forecast Period
Figure 28 HDPE to Dominate the PE Market During the Forecast Period
Figure 29 Asia-Pacific to Dominate LDPE Market During the Forecast Period
Figure 30 South America Projected to Be Second-Fastest Growing LLDPE Market During the Forecast Period
Figure 31 Asia-Pacific Projected to Be Fastest-Growing HDPE Market During the Forecast Period
Figure 32 Ziegler Natta to Dominate PE Catalyst Market During the Forecast Period
Figure 33 Film & Sheet Application Projected to Dominate PE Market During the Forecast Period
Figure 34 Asia-Pacific Market Projected to Witness High Grow Rate in Film & Sheet Application During the Forecast Period
Figure 35 Asia-Pacific to Dominate Injection Molding Application During the Forecast Period
Figure 36 South America Projected to Witness High CAGR for Blow Molding Application During the Forecast Period
Figure 37 Middle East & Africa to Register the Second-Highest CAGR During the Forecast Period
Figure 38 Injection Molding to Dominate PP Market During the Forecast Period
Figure 39 Europe to Be the Second-Largest Market for PP Film & Sheet Application During the Forecast Period
Figure 40 Asia-Pacific to Dominate PP Market in Injection Molding Application During the Forecast Period
Figure 41 Asia-Pacific: the Fastest-Growing Region for Fibers & Raffia Application During the Forecast Period
Figure 42 Asia-Pacific to Dominate Functional PO Market During the Forecast Period
Figure 43 EVA to Dominate Functional PO Market During the Forecast Period
Figure 44 Asia-Pacific to Dominate EVA Market During the Forecast Period Between 2016 and 2021
Figure 45 Compounding and Wire & Cable Projected to Be Fastest Growing Application of EVA Market
Figure 46 In EPDM Market, South America Projected to Grow at the Second-Highest CAGR, During the Forecast Period
Figure 47 Automotive Application Dominate EPDM Market During the Forecast Period
Figure 48 In TPO Market, Asia-Pacific Projected to Grow at Highest CAGR During the Forecast Period
Figure 49 In POE Market, Asia-Pacific Projected to Grow at Highest CAGR During the Forecast Period
Figure 50 North America to Dominate POP Market During the Forecast Period
Figure 51 Regional Snapshot (2016�2021): Asia-Pacific to Lead the PO Market
Figure 52 Asia-Pacific Market Snapshot: Increasing Demand for Film & Sheet Packaging to Drive the PO Market
Figure 53 North America Market Snapshot: Growing Applications of PO to Drive the Market
Figure 54 Companies Adopted New Product Launch as the Key Growth Strategy
Figure 55 The DOW Chemical Company Dominates the PE Market in Terms of Production Capacity
Figure 56 Sinopec Corp Dominates the PP Market in Terms of Production Capacity
Figure 57 Exxonmobil Corporation Dominates the EVA Market in Terms of Production Capacity
Figure 58 Lanxess AG Dominates the EPDM Market in Terms of Production Capacity
Figure 59 Battle for Market Share: New Product Launch Was the Key Strategy Between 2011�2016
Figure 60 Sinopec Corp.: Company Snapshot
Figure 61 Sinopec Corp.: SWOT Analysis
Figure 62 Lyondellbasell Industries Holdings N.V.: Company Snapshot
Figure 63 Lyondellbasell Industries Holding N.V.: SWOT Analysis
Figure 64 Exxonmobil Chemical: Company Snapshot
Figure 65 Exxonmobil Chemical: SWOT Analysis
Figure 66 Petrochina Company Limited: Company Snapshot
Figure 67 Petrochina Company Limited: SWOT Analysis
Figure 68 Saudi Arabia Basic Industries Corporation: Company Snapshot
Figure 69 The DOW Chemical Company: Company Snapshot
Figure 70 The DOW Chemical Company: SWOT Analysis
Figure 71 Braskem S.A.: Company Snapshot
Figure 72 Total S.A.: Company Snapshot
Figure 73 Total S.A.: SWOT Analysis
Figure 74 Arkema S.A.: Company Snapshot
Figure 75 Borealis AG: Company Snapshot
Figure 76 Chevron Phillips Chemical Company: Company Snapshot
Figure 77 ENI S.P.A.: Company Snapshot
Figure 78 Sasol Ltd.: Company Snapshot


Growth opportunities and latent adjacency in Polyolefins Market
Information on Polyolefins foils Market with focus on supplier trends and advanced products.
General information on Polyolefins Market
Specific information on cross-linked and non-crossed linked co-extruded shrink overwrap polyolefin films
Incomplete
PEX market report with specific information regarding Chevron Phillips