Anechoic Chamber Market by Type (Semi Anechoic chamber and Full Anechoic chamber), End-Use Application (Automotive, Military & Defense, IT & Telecom, Consumer Appliances and Electronics, Medical, and Others), and Geography - Global Forecast to 2035


 Exclusive indicates content/data unique to MarketsandMarkets and not available with any competitors.
TABLE OF CONTENTS
1 INTRODUCTION (Page No. - 12)
1.1 STUDY OBJECTIVES
1.2 DEFINITION
1.3 SCOPE OF THE STUDY
1.3.1 MARKETS COVERED
1.3.2 YEARS CONSIDERED
1.4 CURRENCY
1.5 LIMITATIONS
1.6 STAKEHOLDERS
2 RESEARCH METHODOLOGY (Page No. - 16)
2.1 RESEARCH DATA
2.1.1 SECONDARY DATA
2.1.1.1 Secondary sources
2.1.2 PRIMARY DATA
2.1.2.1 Primary sources
2.1.3 SECONDARY AND PRIMARY RESEARCH
2.1.3.1 Key industry insights
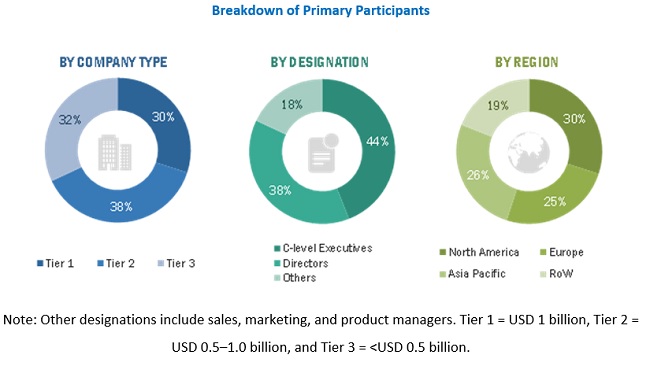
2.1.3.2 Breakdown of primaries
2.2 MARKET SIZE ESTIMATION
2.2.1 BOTTOM-UP APPROACH
2.2.1.1 Approach used to arrive at the market size via bottom-up analysis
2.2.2 TOP-DOWN APPROACH
2.2.2.1 Approach used to capture the market size via top-down analysis
2.3 MARKET BREAKDOWN AND DATA TRIANGULATION
2.4 RESEARCH ASSUMPTIONS
3 EXECUTIVE SUMMARY (Page No. - 25)
4 PREMIUM INSIGHTS (Page No. - 28)
4.1 LUCRATIVE OPPORTUNITIES IN ANECHOIC CHAMBERS MARKET
4.2 ANECHOIC CHAMBERS MARKET, BY COUNTRY
4.3 ANECHOIC CHAMBERS MARKET, BY APPLICATION AND REGION
4.4 ANECHOIC CHAMBERS MARKET IN APAC, BY APPLICATION
4.5 ANECHOIC CHAMBERS MARKET SHARE, BY COUNTRY
5 MARKET OVERVIEW (Page No. - 31)
5.1 INTRODUCTION
5.2 MARKET DYNAMICS
5.2.1 DRIVERS
5.2.1.1 Stringent government regulations pertaining to electromagnetic interference (EMI) across the electronics industry
5.2.1.2 Increasing trend of outsourcing testing, inspection, and certification (TIC) services that require anechoic chambers
5.2.1.3 Increased need for anechoic chambers for electromagnetic compatibility pre-compliance testing
5.2.1.4 Growing use of industry-specific customized anechoic chambers
5.2.2 RESTRAINTS
5.2.2.1 High cost involved in electromagnetic compatibility testing used in anechoic chamber
5.2.2.2 Occurrences of errors while testing in anechoic chambers
5.2.3 OPPORTUNITIES
5.2.3.1 Growth of the hybrid and electric vehicles market
5.2.3.2 Evolution of 5G technology
5.2.3.3 Increasing application of anechoic chambers in robotics testing
5.2.3.4 Testing opportunities in 2D electronics and molecular electronics
5.2.4 CHALLENGES
5.2.4.1 Long lead time for overseas qualification assessments
5.2.4.2 Testing the flammability of the equipment that is being tested
5.3 IMPACT ANALYSIS
5.4 IMPACT OF COVID-19 ON ANECHOIC CHAMBER MARKET
6 ANECHOIC CHAMBER MARKET, BY TYPE (Page No. - 39)
6.1 INTRODUCTION
6.2 SEMI ANECHOIC CHAMBER
6.2.1 ELECTROMAGNETIC COMPATIBILITY AND RADIO FREQUENCY TESTING IN ANECHOIC CHAMBERS HELP IN ABSORBING DIFFERENT BANDS OF FREQUENCY
6.3 FULL ANECHOIC CHAMBER
6.3.1 FULL AND HEMI ANECHOIC CHAMBERS PROVIDE LOW-COST AND SIZE-EFFECTIVE TESTING
7 ANECHOIC CHAMBER MARKET, BY APPLICATION (Page No. - 43)
7.1 INTRODUCTION
7.2 AUTOMOTIVE
7.2.1 INCREASING NEED FOR MEASURING RADIO FREQUENCY EMISSIONS IN VEHICLES ON BOARD TO BOOST THE DEMAND FOR ANECHOIC CHAMBERS
7.3 MILITARY & DEFENSE
7.3.1 IMPLEMENTATION OF STANDARDS AND GOVERNMENT REGULATIONS RELATED TO ELECTROMAGNETIC COMPATIBILITY TESTING TO INCREASE DEMAND FOR ANECHOIC CHAMBERS
7.4 IT & TELECOM
7.4.1 GROWING NEED FOR TESTING 5G TRANSMISSION ANTENNAS TO FUEL THE DEMAND FOR ANECHOIC CHAMBERS
7.5 CONSUMER APPLIANCES AND ELECTRONICS
7.5.1 NEED TO ADHERE TO THE SAFETY STANDARDS OF CONSUMER ELECTRONICS RELATED TO ELECTROMAGNETIC COMPATIBILITY AND ELECTROMAGNETIC INTERFERENCE TESTING TO PROPEL THE DEMAND FOR ANECHOIC CHAMBERS
7.6 MEDICAL
7.6.1 NEED TO MAINTAIN A PROPER FUNCTIONING OF MEDICAL EQUIPMENT RELATED TO ELECTROMAGNETIC INTERFERENCE TESTING TO BOOST THE DEMAND FOR ANECHOIC CHAMBERS IN THE MEDICAL SECTOR
7.7 OTHERS
7.7.1 INCREASING DEMAND FOR ANECHOIC CHAMBERS IN DIFFERENT SECTORS
8 ANECHOIC CHAMBER MARKET, BY REGION (Page No. - 59)
8.1 INTRODUCTION
8.2 NORTH AMERICA
8.2.1 US
8.2.1.1 Growing demand for modern gadgets and innovations in medical equipment offer growth opportunities for the anechoic chamber market
8.2.2 CANADA
8.2.2.1 Increasing demand for communication equipment testing and automotive testing to boost the market growth in Canada
8.2.3 MEXICO
8.2.3.1 Increasing demand for compact cars and electronic components are expected to fuel the growth of the Mexico market
8.3 EUROPE
8.3.1 GERMANY
8.3.1.1 Complexity of automobile electronics and increasing focus on R&D to boost the demand for anechoic chambers
8.3.2 UK
8.3.2.1 High demand for EMC/EMI testing across aerospace and military applications to boost the demand for anechoic chamber
8.3.3 FRANCE
8.3.3.1 Rise in the adoption of EMI vulnerable equipment in military & defense applications
8.3.4 ITALY
8.3.4.1 Increasing demand for medical equipment
8.3.5 REST OF EUROPE
8.4 ASIA PACIFIC
8.4.1 CHINA
8.4.1.1 Expanding telecommunication industry to drive the growth of the anechoic chamber market
8.4.2 JAPAN
8.4.2.1 Increase in FDI in the industrial sector owing to technological advancements to boost the demand for anechoic chambers
8.4.3 INDIA
8.4.3.1 Initiatives by the government to boost the aviation sector to increase the need for testing the components in anechoic chambers
8.4.4 REST OF ASIA PACIFIC
8.5 REST OF THE WORLD (ROW)
8.5.1 MIDDLE EAST & AFRICA
8.5.1.1 Growing investments in communication, infrastructure, and networking applications to increase the adoption of anechoic chambers
8.5.2 SOUTH AMERICA
8.5.2.1 Growing adoption of wireless communication and networking solutions to drive the market growth in South America
9 COMPETITIVE LANDSCAPE (Page No. - 74)
9.1 OVERVIEW
9.2 MARKET RANKING ANALYSIS: ANECHOIC CHAMBER MARKET
9.3 COMPETITIVE LEADERSHIP MAPPING, 2019
9.3.1 VISIONARY LEADERS
9.3.2 DYNAMIC DIFFERENTIATORS
9.3.3 INNOVATORS
9.3.4 EMERGING COMPANIES
9.4 STRENGTH OF SERVICE PORTFOLIO
9.5 BUSINESS STRATEGY EXCELLENCE
9.6 COMPETITIVE SITUATIONS AND TRENDS
9.6.1 PRODUCT LAUNCHES
10 COMPANY PROFILES (Page No. - 80)
(Business overview, Products offered, Recent developments, SWOT analysis, MNM view)*
10.1 INTRODUCTION
10.2 TDK CORPORATION
10.3 ESCO TECHNOLOGIES (ETS-LINDGREN)
10.4 MICROWAVE VISION GROUP (MVG)
10.5 ECKEL INDUSTRIES
10.6 ALBATROSS PROJECTS
10.7 FRANKONIA GROUP
10.8 COMTEST ENGINEERING
10.9 CUMING MICROWAVE CORPORATION
10.10 ECOTONE SYSTEM
*Business overview, Products offered, Recent developments, SWOT analysis, MNM view might not be captured in case of unlisted companies.
11 APPENDIX (Page No. - 98)
11.1 INSIGHTS OF INDUSTRY EXPERTS
11.2 DISCUSSION GUIDE
11.3 KNOWLEDGE STORE: MARKETSANDMARKETS’ SUBSCRIPTION PORTAL
11.4 AVAILABLE CUSTOMIZATIONS
11.5 RELATED REPORTS
11.6 AUTHOR DETAILS
LIST OF TABLES (44 TABLES)
TABLE 1 COST ESTIMATES OF ELECTROMAGNETIC COMPATIBILITY TESTING
TABLE 2 ANECHOIC CHAMBER MARKET, BY TYPE, 2017–2025 (USD MILLION)
TABLE 3 SEMI ANECHOIC CHAMBER MARKET, BY APPLICATION, 2017–2025 (USD MILLION)
TABLE 4 FULL ANECHOIC CHAMBER MARKET, BY APPLICATION, 2017–2025 (USD MILLION)
TABLE 5 ANECHOIC CHAMBER MARKET, BY APPLICATION, 2017–2025 (USD MILLION)
TABLE 6 ANECHOIC CHAMBER MARKET FOR AUTOMOTIVE, BY TYPE, 2017–2025 (USD MILLION)
TABLE 7 ANECHOIC CHAMBER MARKET FOR AUTOMOTIVE, BY REGION, 2017–2025 (USD MILLION)
TABLE 8 ANECHOIC CHAMBER MARKET FOR AUTOMOTIVE IN NORTH AMERICA, BY COUNTRY, 2017–2025 (USD MILLION)
TABLE 9 ANECHOIC CHAMBER MARKET FOR AUTOMOTIVE IN EUROPE, BY COUNTRY, 2017–2025 (USD MILLION)
TABLE 10 ANECHOIC CHAMBER MARKET FOR AUTOMOTIVE IN APAC, BY COUNTRY, 2017–2025 (USD MILLION)
TABLE 11 ANECHOIC CHAMBER MARKET FOR MILITARY & DEFENSE, BY TYPE, 2017–2025 (USD MILLION)
TABLE 12 ANECHOIC CHAMBER MARKET FOR MILITARY & DEFENSE, BY REGION, 2017–2025 (USD MILLION)
TABLE 13 ANECHOIC CHAMBER MARKET FOR MILITARY & DEFENSE IN NORTH AMERICA, BY COUNTRY, 2017–2025 (USD MILLION)
TABLE 14 ANECHOIC CHAMBER MARKET FOR MILITARY & DEFENSE IN EUROPE, BY COUNTRY, 2017–2025 (USD MILLION)
TABLE 15 ANECHOIC CHAMBER MARKET FOR MILITARY & DEFENSE IN APAC, BY COUNTRY, 2017–2025 (USD MILLION)
TABLE 16 ANECHOIC CHAMBER MARKET FOR IT & TELECOM, BY TYPE, 2017–2025 (USD MILLION)
TABLE 17 ANECHOIC CHAMBER MARKET FOR IT & TELECOM, BY REGION, 2017–2025 (USD MILLION)
TABLE 18 ANECHOIC CHAMBER MARKET FOR IT & TELECOM IN NORTH AMERICA, BY COUNTRY, 2017–2025 (USD MILLION)
TABLE 19 ANECHOIC CHAMBER MARKET FOR IT & TELECOM IN EUROPE, BY COUNTRY, 2017–2025 (USD MILLION)
TABLE 20 ANECHOIC CHAMBER MARKET FOR IT & TELECOM IN APAC, BY COUNTRY, 2017–2025 (USD MILLION)
TABLE 21 ANECHOIC CHAMBER MARKET FOR CONSUMER APPLIANCES AND ELECTRONICS, BY TYPE, 2017–2025 (USD MILLION)
TABLE 22 ANECHOIC CHAMBER MARKET FOR CONSUMER APPLIANCES AND ELECTRONICS, BY REGION, 2017–2025 (USD MILLION)
TABLE 23 ANECHOIC CHAMBER MARKET FOR CONSUMER APPLIANCES AND ELECTRONICS IN NORTH AMERICA, BY COUNTRY, 2017–2025 (USD MILLION)
TABLE 24 ANECHOIC CHAMBER MARKET FOR CONSUMER APPLIANCES AND ELECTRONICS IN EUROPE, BY COUNTRY, 2017–2025 (USD MILLION)
TABLE 25 ANECHOIC CHAMBER MARKET FOR CONSUMER APPLIANCES AND ELECTRONICS IN APAC, BY COUNTRY, 2017–2025 (USD MILLION)
TABLE 26 ANECHOIC CHAMBER MARKET FOR MEDICAL, BY TYPE, 2017–2025 (USD MILLION)
TABLE 27 ANECHOIC CHAMBER MARKET FOR MEDICAL, BY REGION, 2017–2025 (USD MILLION)
TABLE 28 ANECHOIC CHAMBER MARKET FOR MEDICAL IN NORTH AMERICA, BY COUNTRY, 2017–2025 (USD MILLION)
TABLE 29 ANECHOIC CHAMBER MARKET FOR MEDICAL IN EUROPE, BY COUNTRY, 2017–2025 (USD MILLION)
TABLE 30 ANECHOIC CHAMBER MARKET FOR MEDICAL IN APAC, BY COUNTRY, 2017–2025 (USD MILLION)
TABLE 31 ANECHOIC CHAMBER MARKET FOR OTHERS, BY TYPE, 2017–2025 (USD MILLION)
TABLE 32 ANECHOIC CHAMBER MARKET FOR OTHERS, BY REGION, 2017–2025 (USD MILLION)
TABLE 33 ANECHOIC CHAMBER MARKET FOR OTHERS IN NORTH AMERICA, BY COUNTRY, 2017–2025 (USD MILLION)
TABLE 34 ANECHOIC CHAMBER MARKET FOR OTHERS IN EUROPE, BY COUNTRY, 2017–2025 (USD MILLION)
TABLE 35 ANECHOIC CHAMBER MARKET FOR OTHERS IN APAC, BY COUNTRY, 2017–2025 (USD MILLION)
TABLE 36 ANECHOIC CHAMBER MARKET, BY REGION, 2017–2025 (USD MILLION)
TABLE 37 ANECHOIC CHAMBER MARKET IN NORTH AMERICA, BY COUNTRY, 2017–2025 (USD MILLION)
TABLE 38 ANECHOIC CHAMBER MARKET IN NORTH AMERICA, BY APPLICATION, 2017–2025 (USD MILLION)
TABLE 39 ANECHOIC CHAMBER MARKET IN EUROPE, BY COUNTRY, 2017–2025 (USD MILLION)
TABLE 40 ANECHOIC CHAMBER MARKET IN EUROPE, BY APPLICATION, 2017–2025 (USD MILLION)
TABLE 41 ANECHOIC CHAMBER MARKET IN APAC, BY COUNTRY, 2017–2025 (USD MILLION)
TABLE 42 ANECHOIC CHAMBER MARKET IN APAC, BY APPLICATION, 2017–2025 (USD MILLION)
TABLE 43 ANECHOIC CHAMBER MARKET IN ROW, BY APPLICATION, 2017–2025 (USD MILLION)
TABLE 44 PRODUCT LAUNCHES, 2018–2019
LIST OF FIGURES (33 FIGURES)
FIGURE 1 ANECHOIC CHAMBER MARKET SEGMENTATION
FIGURE 2 ANECHOIC CHAMBER MARKET: RESEARCH DESIGN
FIGURE 3 PROCESS FLOW
FIGURE 4 MARKET SIZE ESTIMATION METHODOLOGY: BOTTOM-UP APPROACH
FIGURE 5 MARKET SIZE ESTIMATION METHODOLOGY: TOP-DOWN APPROACH
FIGURE 6 DATA TRIANGULATION
FIGURE 7 ANECHOIC CHAMBERS MARKET, BY TYPE, 2020
FIGURE 8 ANECHOIC CHAMBERS MARKET, BY APPLICATION
FIGURE 9 APAC ANECHOIC CHAMBER MARKET IN 2020
FIGURE 10 ANECHOIC CHAMBER MARKET EXPECTED TO WITNESS LUCRATIVE GROWTH OPPORTUNITIES OWING TO ITS INCREASING DEMAND IN THE IT & TELECOM AND MEDICAL APPLICATIONS
FIGURE 11 US AND CHINA ARE EXPECTED TO HOLD THE LARGEST MARKET SHARES IN 2020
FIGURE 12 APAC TO HOLD LARGEST SHARE OF ANECHOIC CHAMBERS MARKET IN 2020
FIGURE 13 AUTOMOTIVE AND IT & TELECOM SEGMENTS TO ACCOUNT FOR THE LARGEST SHARES OF ANECHOIC CHAMBER IN APAC
FIGURE 14 US IS EXPECTED TO HOLD LARGEST SHARE OF ANECHOIC CHAMBERS MARKET IN 2020
FIGURE 15 ANECHOIC CHAMBER MARKET: DRIVERS, RESTRAINTS, OPPORTUNITIES, AND CHALLENGES
FIGURE 16 ANECHOIC CHAMBER MARKET, BY TYPE
FIGURE 17 ANECHOIC CHAMBER MARKET, BY APPLICATION
FIGURE 18 REGIONAL SNAPSHOT (2020): ANECHOIC CHAMBER MARKET IN INDIA TO WITNESS SIGNIFICANT GROWTH FROM 2020 TO 2025
FIGURE 19 NORTH AMERICA ANECHOIC CHAMBER MARKET SNAPSHOT
FIGURE 20 REGIONAL SNAPSHOT (2020): ANECHOIC CHAMBER MARKET IN EUROPE
FIGURE 21 ASIA PACIFIC ANECHOIC CHAMBER MARKET SNAPSHOT 2020
FIGURE 22 KEY PLAYER MARKET RANKING, 2019
FIGURE 23 ANECHOIC CHAMBER MARKET (GLOBAL) COMPETITIVE LEADERSHIP MAPPING, 2019
FIGURE 24 SERVICE PORTFOLIO ANALYSIS OF TOP PLAYERS IN ANECHOIC CHAMBER MARKET
FIGURE 25 BUSINESS STRATEGY EXCELLENCE OF TOP PLAYERS IN ANECHOIC CHAMBER MARKET
FIGURE 26 TDK CORPORATION: COMPANY SNAPSHOT
FIGURE 27 TDK CORPORATION: SWOT ANALYSIS
FIGURE 28 ESCO TECHNOLOGIES (ETS-LINDGREN): COMPANY SNAPSHOT
FIGURE 29 ESCO TECHNOLOGIES: SWOT ANALYSIS
FIGURE 30 MICROWAVE VISION GROUP (MVG): COMPANY SNAPSHOT
FIGURE 31 MICROWAVE VISION GROUP (MVG): SWOT ANALYSIS
FIGURE 32 ECKEL INDUSTRIES: SWOT ANALYSIS
FIGURE 33 ALBATROSS PROJECTS: SWOT ANALYSIS
The study involved four major activities in estimating the current size of the anechoic chamber market. Exhaustive secondary research was done to collect information on the market and its peer and parent markets. The next step was to validate these findings, assumptions, and sizing with industry experts across the value chain through primary research. Both top-down and bottom-up approaches were employed to estimate the total market size. After that, market breakdown and data triangulation were employed to estimate the market size of segments and subsegments.
Secondary Research
In the secondary research process, various secondary sources have been referred to for identifying and collecting information important for this study. These secondary sources include biometric technologies journals and magazines, IEEE journals; annual reports, press releases, and investor presentations of companies; white papers; certified publications and articles from recognized authors; and directories and databases such as Factiva, Hoovers, and OneSource.
Primary Research
In the primary research process, various primary sources from both supply and demand sides have been interviewed to obtain qualitative and quantitative information important for this report. The primary sources from the supply side included industry experts such as CEOs, VPs, marketing directors, technology and innovation directors, and related executives from key companies and organizations operating in the anechoic chamber market. After complete market engineering (including calculations regarding market statistics, market breakdown, market size estimations, market forecasting, and data triangulation), extensive primary research was conducted to gather information as well as verify and validate the critical numbers arrived at.
To know about the assumptions considered for the study, download the pdf brochure
Market Size Estimation
In the complete market engineering process, both top-down and bottom-up approaches have been implemented, along with several data triangulation methods, to estimate and validate the size of the anechoic chamber market and other dependent submarkets listed in this report.
- Key players in the industry and markets have been identified through extensive secondary research.
- In terms of value, the industry’s supply chain and market size have been determined through primary and secondary research processes.
- All percentage shares, splits, and breakdowns have been determined using secondary sources and verified through primary sources.
Data Triangulation
After arriving at the overall market size from the estimation process explained above, the global market has been split into several segments and subsegments. To complete the overall market engineering process and arrive at exact statistics for all segments and subsegments, market breakdown and data triangulation procedures have been employed wherever applicable. The data has been triangulated by studying various factors and trends identified from both demand and supply sides in government, consumer electronics, healthcare, banking & finance, travel & immigration, automotive, and military & defense verticals among others.
Report Objectives
The following are the primary objectives of the study.
- To define, describe, and forecast the anechoic chamber market, by type, application, and geography
- To forecast the market size of various segments with respect to 4 main regions: North America, Europe, Asia Pacific, and the Rest of the World
- To provide detailed information regarding the major factors influencing the growth of the market (drivers, restraints, opportunities, and industry-specific challenges)
- To strategically analyze the micromarkets with respect to individual growth trends, prospects, and contributions to the total market
- To strategically profile the key players and comprehensively analyze their market ranking and core competencies, along with detailing the competitive landscape for market leaders
- To analyze the competitive developments such as agreements, contracts, partnerships, acquisitions, and product launches & developments carried out in the anechoic chamber market
Available Customizations
With the given market data, MarketsandMarkets offers customizations according to a company’s specific needs. The following customization options are available for the report:
Company Information:
- Detailed analysis and profiling of additional market players (up to 5)


Growth opportunities and latent adjacency in Anechoic Chamber Market