Mobile, PC & Console Gaming & Animation (by Entertainment, 2D, 3D, Visual Effects, TV, Direct-to-DVD and Content) Market - Global Advancements, Business Models, Market Forecasts & Analysis (2012 - 2016)


Creativity and expansion of the target market are the major reasons for the massive registration of patents for animation. The U.S. leads the market for animation patents, due to wide scope and demand for locally generated animation content, and the presence of top industry players such as Disney and DreamWorks. There is a huge demand for 3D animation across the globe, and most of the animation industry players such as Disney Enterprises Inc, Adobe Systems Incorporated, and Sony Corporation are trying to grab a share of the 3D market.
Innovative gaming techniques such as massively multiplayer online games and online role playing games have given a new outlook to the gaming market. The U.S. registers the maximum number of patents due to government support and the presence of industry giants such as Microsoft Corporation, Electronic Arts Inc, and Disney among others.
The global animation and gaming market is expected to grow from $122.20 billion in 2010 to $242.93 billion by 2016. This represents a compound annual growth rate (CAGR) of 12.94% from 2011 to 2016.
Major driving force behind the animation market is government initiatives; whereas the gaming market is pulled up by greater penetration & accessibility to broadband internet. The lack of skills and piracy remain the restraining factors. Key issues in the industry today are consumers� shift from buying to renting and dropping prices due to rise of freemium models.
The overall animation and gaming market is segmented on the basis of animation and gaming sub segments. Animation includes e-Education, web designing, and animation entertainment. Furthermore, animation entertainment includes segments such as movies, Visual Effects (VFX), TV & Broadcast, and Direct to DVD. Movies are further divided into 2D animation and 3D animation. Gaming includes PC games, mobile games, console games, and online games.
The global animation & gaming market is segmented into four geographies: North America, Europe, Asia-Pacific and Japan, and ROW (Rest of the world). North America forms the largest segment with about 42% of the overall share, followed by Europe; whereas APJ is the fastest growing region with an expected CAGR of 19.08% from 2011 to 2016.
Scope of the report
Global Animation & Gaming Market research report provides an extensive analysis of Animation Market and Gaming Market, which segmented on the basis of segments and sub segments in animation and gaming individually including current market trends, industry drivers, and challenges for better understanding of the market. This report covers the strategies followed by �global animation & gaming� players.
Market overview
This section discusses the market definition of �global animation & gaming market�. It also discusses the way market is segmented and the methodology and assumptions considered for forecasting the revenue. The winning imperatives, along with the burning issues in the market are covered as well. Drivers, restraints, and opportunities for �global animation & gaming market" have also been covered in this section.
Market segmentation
This research report categorizes the global animation & gaming market for forecasting the revenue and analyzing the trends in each of the following submarkets:
On the basis of animation segments
- e-Education
- Web designing
- Animation entertainment
- Movies
- 2D animation movies
- 3D animation movies
- Visual effect (VFX)
- TV, broadcast
- Direct to DVD
- Movies
On the basis of types in gaming software market
- PC games
- Mobile games
- Console games
- Online games
On the basis of Geography
- North America
- Europe
- Asia-Pacific & Japan (APJ)
- ROW (Rest of the World)
Geographic analysis
This section provides a brief overview of all the geographies pertaining to �Global Animation & Gaming Market� on the basis of segments in animation as well as gaming market. It covers the trends prevailing in every region and the factors impacting the overall market in that particular geography.
Company profiles
This section provides the company profiles of the major companies participating in the �Global Animation & Gaming Market Size and Forecast Market Research Report�. Company profiles include a brief overview of the company, products & services, financial overview, and strategies, followed by developments.
The global animation & gaming market is expected to grow from $122.20 billion in 2010 to $242.92 billion by 2016 at a CAGR of 12.94% from 2011 to 2016. North America leads the overall animation & gaming market in terms of absolute dollar value; followed by Europe due to availability of essential animation infrastructure and advancements in technology. Asia-Pacific & Japan have a smaller market in terms of revenue. However, with increasing penetration of mobile subscriber base and rising government initiatives; the market is expected to grow at the highest CAGR of 19.08 % from 2011 to 2016.
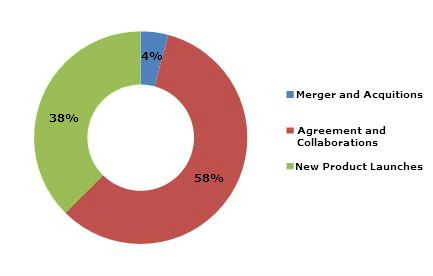
Players in this market can gain competitive advantage by shifting their focus from catering to individual services than bundling of entertainment services. The competitive landscape for the animation market is focused on agreements and collaborations being adopted by the major players from January 2010 to September 2011. The following figure depicts the competitive developments for animation players from January 2010 to September 2011. Large players such as Walt Disney Company, DreamWorks Animation, and Aardman Animations are entering into agreements in regards to distribution, licensing, and utilization of each other�s expertise.
Animation Market Competitive Developments
(January 2010 - September 2011)
Source: MarketsandMarkets
 Exclusive indicates content/data unique to MarketsandMarkets and not available with any competitors.
TABLE OF CONTENTS
1 INTRODUCTION
1.1 KEY TAKE AWAYS
1.2 REPORT DESCRIPTION
1.3 MARKETS COVERED
1.4 STAKEHOLDERS
1.5 RESEARCH METHODOLOGY
1.5.1 MARKET SIZE
1.5.2 KEY DATA POINTS FROM SECONDARY SOURCES
1.5.3 KEY DATA POINTS FROM PRIMARY SOURCES
1.5.4 ASSUMPTIONS MADE FOR THIS REPORT
1.5.5 LIST OF COMPANIES COVERED DURING PRIMARIES
2 EXECUTIVE SUMMARY
3 MARKET OVERVIEW
3.1 MARKET DEFINITION
3.2 MARKET SIZE
3.3 WINNING IMPERATIVES
3.3.1 EXPANSION INTO HOME ENTERTAINMENT MARKET
3.3.2 GAMING INDUSTRY PLAYERS SHOULD COLLABORATE WITH MOBILE VAS PROVIDERS
3.4 BURNING ISSUES
3.4.1 CONSUMERS SHIFT FROM BUYING TO RENTING
3.4.2 DROPPING PRICES DUE TO RISE OF FREEMIUM MODELS
3.5 MARKET DYNAMICS
3.5.1 DRIVERS
3.5.1.1 Market drivers for the animation industry
3.5.1.1.1 Rising number of TV channels
3.5.1.1.2 Expansion of target market
3.5.1.1.3 Government initiatives
3.5.1.1.4 Growth in BPO sector
3.5.1.2 Market drivers for gaming industry
3.5.1.2.1 Greater penetration & accessibility to broadband Internet
3.5.1.2.2 Online gaming to become a medium for marketing & promotion of films
3.5.1.2.3 Growth in mobile subscriber base
3.5.2 RESTRAINTS
3.5.2.1 Market restraints for the animation market
3.5.2.1.1 Shortage of skills
3.5.2.1.2 Protection of Intellectual Property(IP)
3.5.2.2 Market restraints for the gaming market
3.5.2.2.1 Piracy
3.5.2.2.2 Cultural barrier
3.5.3 OPPORTUNITIES
3.5.3.1 Opportunities in the animation market
3.5.3.1.1 Animation players to tie up with Internet subscription service providers
3.5.3.2 Opportunities in the gaming market
3.5.3.2.1 Changing trend from touch interaction to no-touch interaction
3.5.3.2.2 Establishment of a media brand for games
3.6 MARKET PRESENCE ANALYSIS
3.6.1 ANIMATION MARKET
3.6.2 GAMING MARKET
3.7 VALUE CHAIN ANALYSIS
3.7.1 ANIMATION VALUE CHAIN
3.7.2 GAMING VALUE CHAIN
3.8 PATENT ANALYSIS
3.8.1 ANIMATION PATENTS
3.8.2 GAMING PATENTS
4 ANIMATION & GAMING MARKET SEGMENTS
4.1 ANIMATION & GAMING MARKET
4.1.1 ANIMATION MARKET
4.1.2 MARKET SIZE & FORECAST
4.1.2.1 E-Education
4.1.2.2 Web designing
4.1.2.3 Animation entertainment
4.1.3 MARKET SIZE & FORECAST
4.1.3.1.1 Movies
4.1.3.1.2 Market Size & forecast
4.1.3.1.2.1 2D animation movies
4.1.3.1.2.2 3D animation movies
4.1.3.1.3 Visual effects (VFX)
4.1.3.1.4 TV or Broadcast
4.1.3.1.5 Direct-to-DVD
4.1.4 GAMING MARKET
4.1.5 MARKET SIZE & FORECAST
4.1.5.1 PC
4.1.5.2 Mobile
4.1.5.3 Console
4.1.5.4 Online
5 GEOGRAPHICAL ANALYSIS
5.1 OVERVIEW
5.1.1 MARKET SIZE & FORECAST
5.1.2 ANIMATION MARKET
5.1.2.1 Overview
5.1.2.2 Market size & forecast
5.1.3 GAMING MARKET
5.1.3.1 Overview
5.1.3.2 Market size & forecast
5.2 NORTH AMERICA: ANIMATION & GAMING MARKET
5.2.1 OVERVIEW
5.2.2 MARKET SIZE & FORECAST
5.2.3 NORTH AMERICA: ANIMATION MARKET
5.2.3.1 Overview
5.2.3.2 Market size & forecast
5.2.4 NORTH AMERICA: GAMING MARKET
5.2.4.1 Overview
5.2.4.2 Market size & forecast
5.3 EUROPE ANIMATION & GAMING MARKET
5.3.1 OVERVIEW
5.3.2 MARKET SIZE & FORECAST
5.3.3 EUROPE: ANIMATION MARKET
5.3.3.1 Overview
5.3.3.2 Market size & forecast
5.3.4 EUROPE: GAMING MARKET
5.3.4.1 Overview
5.3.4.2 Market size & forecast
5.4 APJ: ANIMATION & GAMING MARKET
5.4.1 OVERVIEW
5.4.2 MARKET SIZE & FORECAST
5.4.3 APJ: ANIMATION MARKET
5.4.3.1 Overview
5.4.3.2 Market size & forecast
5.4.4 APJ: GAMING MARKET
5.4.4.1 Overview
5.4.4.2 Market size & forecast
5.5 ROW: ANIMATION & GAMING MARKET
5.5.1 OVERVIEW
5.5.2 MARKET SIZE & FORECAST
5.5.3 ROW: ANIMATION MARKET
5.5.3.1 Overview
5.5.3.2 Market size & forecast
5.5.4 ROW: GAMING MARKET
5.5.4.1 Overview
5.5.4.2 Market size & forecast
6 COMPETITIVE LANDSCAPE
6.1 INTRODUCTION
6.1.1 ANIMATION COMPETITIVE LANDSCAPE
6.1.2 GAMING COMPETITIVE LANDSCAPE
7 COMPANY PROFILES
7.1 AARDMAN ANIMATIONS LTD
7.1.1 OVERVIEW
7.1.2 PRODUCTS & SERVICES
7.1.3 FINANCIALS
7.1.4 STRATEGY
7.1.5 DEVELOPMENTS
7.2 ACTIVISION BLIZZARD INC
7.2.1 OVERVIEW
7.2.2 PRODUCTS & SERVICES
7.2.3 FINANCIALS
7.2.4 STRATEGY
7.2.5 DEVELOPMENTS
7.3 ADOBE SYSTEMS INCORPORATED
7.3.1 OVERVIEW
7.3.2 PRODUCTS & SERVICES
7.3.3 FINANCIALS
7.3.4 STRATEGY
7.3.5 DEVELOPMENTS
7.4 AUTODESK INC
7.4.1 OVERVIEW
7.4.2 PRODUCTS & SERVICES
7.4.3 FINANCIALS
7.4.4 STRATEGY
7.4.5 DEVELOPMENTS
7.5 CAPCOM CO. LTD
7.5.1 OVERVIEW
7.5.2 PRODUCTS & SERVICES
7.5.3 FINANCIALS
7.5.4 STRATEGY
7.5.5 DEVELOPMENTS
7.6 CREST ANIMATION STUDIOS LTD
7.6.1 OVERVIEW
7.6.2 PRODUCTS & SERVICES
7.6.3 FINANCIALS
7.6.4 STRATEGY
7.6.5 DEVELOPMENTS
7.7 DQ ENTERTAINMENT PLC
7.7.1 OVERVIEW
7.7.2 PRODUCTS & SERVICES
7.7.3 FINANCIALS
7.7.4 STRATEGY
7.7.5 DEVELOPMENTS
7.8 DREAMWORKS ANIMATION SKG INC
7.8.1 OVERVIEW
7.8.2 PRODUCTS & SERVICES
7.8.3 FINANCIALS
7.8.4 STRATEGY
7.8.5 DEVELOPMENTS
7.9 ELECTRONIC ARTS INC
7.9.1 OVERVIEW
7.9.2 PRODUCTS & SERVICES
7.9.3 FINANCIALS
7.9.4 STRATEGY
7.9.5 DEVELOPMENTS
7.10 LEGO GROUP
7.10.1 OVERVIEW
7.10.2 PRODUCTS & SERVICES
7.10.3 FINANCIALS
7.10.4 STRATEGY
7.10.5 DEVELOPMENTS
7.11 MICROSOFT CORPORATION
7.11.1 OVERVIEW
7.11.2 PRODUCTS & SERVICES
7.11.3 FINANCIALS
7.11.4 STRATEGY
7.11.5 DEVELOPMENTS
7.12 NAMCO BANDAI HOLDINGS INC.
7.12.1 OVERVIEW
7.12.2 PRODUCTS & SERVICES
7.12.3 FINANCIALS
7.12.4 STRATEGY
7.12.5 DEVELOPMENTS
7.13 NINTENDO CO. LTD
7.13.1 OVERVIEW
7.13.2 PRODUCTS & SERVICES
7.13.3 FINANCIALS
7.13.4 STRATEGY
7.13.5 DEVELOPMENTS
7.14 NVIDIA CORPORATION
7.14.1 OVERVIEW
7.14.2 PRODUCTS & SERVICES
7.14.3 FINANCIALS
7.14.4 STRATEGY
7.14.5 DEVELOPMENTS
7.15 SONY COMPUTER ENTERTAINMENT INC.
7.15.1 OVERVIEW
7.15.2 PRODUCTS & SERVICES
7.15.3 FINANCIALS
7.15.4 STRATEGY
7.15.5 DEVELOPMENTS
7.16 TAKE-TWO INTERACTIVE SOFTWARE INC.
7.16.1 OVERVIEW
7.16.2 PRODUCTS & SERVICES
7.16.3 FINANCIALS
7.16.4 STRATEGY
7.16.5 DEVELOPMENTS
7.17 THQ INC
7.17.1 OVERVIEW
7.17.2 PRODUCTS & SERVICES
7.17.3 FINANCIALS
7.17.4 STRATEGY
7.17.5 DEVELOPMENTS
7.18 THE WALT DISNEY COMPANY
7.18.1 OVERVIEW
7.18.2 PRODUCTS & SERVICES
7.18.3 FINANCIALS
7.18.4 STRATEGY
7.18.5 DEVELOPMENTS
7.18.5.1 Gaming
7.18.5.2 Animation
7.19 TIME WARNER INC
7.19.1 OVERVIEW
7.19.2 PRODUCTS & SERVICES
7.19.3 FINANCIALS
7.19.4 STRATEGY
7.19.5 DEVELOPMENTS
7.20 UBISOFT ENTERTAINMENT SA
7.20.1 OVERVIEW
7.20.2 PRODUCTS & SERVICES
7.20.3 FINANCIALS
7.20.4 STRATEGY
7.20.5 DEVELOPMENTS
APPENDIX
ANIMATION PATENTS
� U.S. PATENTS
� EUROPE PATENTS
� JAPAN PATENTS
GAMING PATENTS
� U.S. PATENTS
� EUROPE PATENTS
� JAPAN PATENTS
LIST OF TABLES
TABLE 1 GLOBAL ANIMATION & GAMING MARKET REVENUE, BY SEGMENTS, 2011 - 2016 ($BILLION)
TABLE 2 GLOBAL ANIMATION & GAMING MARKET REVENUE, BY SEGMENTS, 2011 � 2016 (Y-O-Y GROWTH %)
TABLE 3 GLOBAL ANIMATION & GAMING MARKET REVENUE, BY SEGMENTS, 2011 � 2016 ($BILLION)
TABLE 4 ANIMATION MARKET REVENUE, BY TYPES, 2010 � 2016 ($BILLION)
TABLE 5 ANIMATION MARKET REVENUE, BY TYPES, 2011 � 2016 (Y-O-Y GROWTH %)
TABLE 6 ANIMATION ENTERTAINMENT MARKET REVENUE, BY TYPES, 2010 � 2016 ($BILLION)
TABLE 7 ANIMATION ENTERTAINMENT MARKET REVENUE, BY TYPES, 2011 � 2016 (Y-O-Y GROWTH %)
TABLE 8 ANIMATED MOVIES MARKET REVENUE, BY TYPES, 2010 � 2016 ($BILLION)
TABLE 9 ANIMATED MOVIES MARKET REVENUE, BY TYPES, 2011 � 2016 (Y-O-Y GROWTH %)
TABLE 10 GAMING MARKET REVENUE, BY TYPES, 2010 � 2016 ($BILLION)
TABLE 11 GAMING MARKET REVENUE, BY TYPES, 2011 � 2016 (Y-O-Y GROWTH %)
TABLE 12 ANIMATION & GAMING MARKET REVENUE, BY GEOGRAPHY, 2010 � 2016 ($BILLION)
TABLE 13 ANIMATION & GAMING MARKET REVENUE, BY GEOGRAPHY, 2011 � 2016 (Y-O-Y GROWTH %)
TABLE 14 ANIMATION MARKET REVENUE, BY GEOGRAPHY, 2010 � 2016 ($BILLION)
TABLE 15 ANIMATION MARKET REVENUE, BY GEOGRAPHY, 2011 � 2016 (Y-O-Y GROWTH %)
TABLE 16 GAMING MARKET REVENUE, BY GEOGRAPHY, 2010 � 2016 ($BILLION)
TABLE 17 GAMING MARKET REVENUE, BY GEOGRAPHY, 2011 � 2016 (Y-O-Y GROWTH %)
TABLE 18 NORTH AMERICA: ANIMATION & GAMING MARKET REVENUE, BY SEGMENTS, 2010 � 2016 ($BILLION)
TABLE 19 NORTH AMERICA: ANIMATION & GAMING MARKET REVENUE, BY SEGMENTS, 2011 � 2016 (Y-O-Y GROWTH %)
TABLE 20 NORTH AMERICA: ANIMATION MARKET REVENUE, BY TYPES, 2010 � 2016 ($BILLION)
TABLE 21 NORTH AMERICA: ANIMATION MARKET REVENUE, BY TYPES, 2011 � 2016 (Y-O-Y GROWTH %)
TABLE 22 NORTH AMERICA: GAMING MARKET REVENUE, BY TYPES, 2010 � 2016 ($BILLION)
TABLE 23 NORTH AMERICA: GAMING MARKET REVENUE, BY TYPES, 2011 � 2016 (Y-O-Y GROWTH %)
TABLE 24 EUROPE: ANIMATION & GAMING MARKET REVENUE, BY SEGMENTS, 2010 � 2016 ($BILLION)
TABLE 25 EUROPE: ANIMATION & GAMING MARKET REVENUE, BY SEGMENTS, 2011 � 2016 (Y-O-Y GROWTH %)
TABLE 26 EUROPE: ANIMATION MARKET REVENUE, BY TYPES, 2010 � 2016 ($BILLION)
TABLE 27 EUROPE: ANIMATION MARKET REVENUE, BY TYPES, 2011 � 2016 (Y-O-Y GROWTH %)
TABLE 28 EUROPE: GAMING MARKET REVENUE, BY TYPES, 2010 � 2016 ($BILLION)
TABLE 29 EUROPE: GAMING MARKET REVENUE, BY TYPES, 2011 � 2016 (Y-O-Y GROWTH %)
TABLE 30 APJ: ANIMATION & GAMING MARKET REVENUE, BY SEGMENTS, 2010 � 2016 ($BILLION)
TABLE 31 APJ: ANIMATION & GAMING MARKET REVENUE, BY SEGMENTS, 2011 � 2016 (Y-O-Y GROWTH %)
TABLE 32 APJ: ANIMATION MARKET REVENUE, BY TYPES, 2010 � 2016 ($BILLION)
TABLE 33 APJ: ANIMATION MARKET REVENUE, BY TYPES, 2011 � 2016 (Y-O-Y GROWTH %)
TABLE 34 APJ: GAMING MARKET REVENUE, BY TYPES, 2010 � 2016 ($BILLION)
TABLE 35 APJ: GAMING MARKET REVENUE, BY TYPES, 2011 � 2016 (Y-O-Y GROWTH %)
TABLE 36 ROW: ANIMATION & GAMING MARKET REVENUE, BY SEGMENTS, 2010 � 2016 ($BILLION)
TABLE 37 ROW: ANIMATION & GAMING MARKET REVENUE, BY SEGMENTS, 2011 � 2016 (Y-O-Y GROWTH %)
TABLE 38 ROW: ANIMATION MARKET REVENUE, BY TYPES, 2010 � 2016 ($BILLION)
TABLE 39 ROW: ANIMATION MARKET REVENUE, BY TYPES, 2011 � 2016 (Y-O-Y GROWTH%)
TABLE 40 ROW: GAMING MARKET REVENUE, BY TYPES, 2010 � 2016 ($BILLION)
TABLE 41 ROW: GAMING MARKET REVENUE, BY TYPE, 2011 � 2016 (Y-O-Y GROWTH %)
TABLE 42 MERGERS & ACQUISITIONS, 2010 � 2011
TABLE 43 AGREEMENTS & COLLABORATIONS, 2010 � 2011
TABLE 44 NEW PRODUCT LAUNCHES, 2010 � 2011
TABLE 45 MERGERS & ACQUISITIONS, 2010 � 2011
TABLE 46 AGREEMENTS & COLLABORATIONS, 2010 � 2011
TABLE 47 NEW PRODUCT LAUNCHES, 2010 � 2011
TABLE 48 AARDMAN ANIMATIONS LTD: TOTAL REVENUES, 2008 � 2009 ($MILLIONS)
TABLE 49 ACTIVISION BLIZZARD INC: REVENUE, BY SEGMENTS, 2009 � 2O10 ($MILLION)
TABLE 50 ACTIVISION BLIZZARD INC: REVENUE, BY GEOGRAPHY, 2009 � 2O10 ($MILLION)
TABLE 51 ADOBE SYSTEMS INCORPORATED: TOTAL REVENUES AND R&D EXPENDITURE, 2009 � 2O10 ($MILLION)
TABLE 52 ADOBE SYSTEMS INCORPORATED: TOTAL REVENUE, BY SEGMENTS, 2009 � 2O10 ($MILLION)
TABLE 53 ADOBE SYSTEMS INCORPORATED: REVENUE, BY GEOGRAPHY, 2009 � 2O10 ($MILLION)
TABLE 54 AUTODESK INC: TOTAL REVENUE AND R&D EXPENDITURE, 2010 � 2O11 ($MILLION)
TABLE 55 AUTODESK INC: REVENUE, BY SEGMENTS, 2010 � 2O11 ($MILLION)
TABLE 56 AUTODESK INC: REVENUES, BY GEOGRAPHY, 2010 � 2O11 ($MILLION)
TABLE 57 CAPCOM CO. LTD: TOTAL REVENUES, 2010 � 2011 ($MILLIONS)
TABLE 58 CAPCOM CO. LTD: REVENUES, BY BUSINESS SEGMENTS, 2010 � 2011 ($MILLION)
TABLE 59 CAPCOM CO. LTD: REVENUES, BY GEOGRAPHY, 2010 � 2011 ($MILLION)
TABLE 60 CREST ANIMATION STUDIOS: TOTAL REVENUES, 2010 � 2011 ($MILLIONS)
TABLE 61 CREST ANIMATION STUDIOS: REVENUES, BY BUSINESS SEGMENTS, 2010 � 2011 ($MILLIONS)
TABLE 62 DQE: TOTAL REVENUES, 2010 � 2011 ($MILLIONS)
TABLE 63 DQE: REVENUES, BY BUSINESS SEGMENTS, 2010 � 2011 ($MILLIONS)
TABLE 64 DQE: REVENUES, BY GEOGRAPHY, 2010 � 2011 ($MILLIONS)
TABLE 65 DREAMWORKS ANIMATION: TOTAL REVENUES AND PRODUCT & DEVELOPMENT COST, 2009 � 2010 ($MILLIONS)
TABLE 66 DREAMWORKS ANIMATION: REVENUE, BY FILM AND OTHERS, 2009 � 2010 ($MILLIONS)
TABLE 67 DREAMWORKS ANIMATION: REVENUE, BY GEOGRAPHY, 2009 � 2010 ($MILLIONS)
TABLE 68 ELECTRONIC ARTS: TOTAL REVENUES AND R&D EXPENDITURE, 2010 � 2O11 ($MILLION)
TABLE 69 ELECTRONIC ARTS: REVENUES, BY BUSINESS SEGMENTS, 2010 � 2011 ($MILLION)
TABLE 70 ELECTRONIC ARTS: REVENUES, BY GEOGRAPHY, 2010 � 2011 ($MILLION)
TABLE 71 LEGO: TOTAL REVENUES, 2009 � 2010 ($MILLIONS)
TABLE 72 MICROSOFT CORPORATION: TOTAL REVENUES AND R&D EXPENDITURE, 2010 � 2011 ($MILLION)
TABLE 73 MICROSOFT CORPORATION: REVENUES, BY BUSINESS SEGMENTS, 2010 � 2011 ($MILLION)
TABLE 74 MICROSOFT CORPORATION: REVENUES, BY GEOGRAPHY, 2010 � 2011 ($MILLION)
TABLE 75 NAMCO BANDAI: TOTAL REVENUES AND R&D EXPENDITURE, 2010 � 2011 ($MILLION)
TABLE 76 NAMCO BANDAI: REVENUES, BY BUSINESS SEGMENTS, 2010 � 2011 ($MILLIONS)
TABLE 77 NAMCO BANDAI: REVENUES, BY GEOGRAPHY, 2010 � 2011 ($MILLIONS)
TABLE 78 NINTENDO: TOTAL REVENUES AND R&D EXPENDITURE, 2010 � 2011 ($MILLION)
TABLE 79 NINTENDO: REVENUES, BY PRODUCTS & SERVICES, 2011 ($MILLION)
TABLE 80 NINTENDO: REVENUES, BY GEOGRAPHY, 2010 � 2011 ($MILLION)
TABLE 81 NVIDIA: TOTAL REVENUES AND R&D EXPENDITURE, 2010 � 2011 ($MILLION)
TABLE 82 NVIDIA: REVENUES, BY BUSINESS SEGMENTS, 2010 � 2011 ($MILLION)
TABLE 83 NVIDIA : REVENUES, BY GEOGRAPHY, 2010 � 2011 ($MILLION)
TABLE 84 SONY COMPUTER ENTERTAINMENT: TOTAL GAME REVENUE, 2010 � 2011 ($MILLION)
TABLE 85 TAKE-TWO INTERACTIVE SOFTWARE: TOTAL REVENUE AND R&D EXPENDITURE, 2010 � 2011 ($MILLION)
TABLE 86 TAKE-TWO INTERACTIVE SOFTWARE: MARKET REVENUE, BY PRODUCT PLATFORM, 2010 � 2011 ($MILLION)
TABLE 87 TAKE-TWO INTERACTIVE SOFTWARE: MARKET REVENUE, BY GEOGRAPHY, 2010 � 2011 ($MILLION)
TABLE 88 THQ: TOTAL REVENUE, 2010 � 2011 ($MILLION)
TABLE 89 THQ: MARKET REVENUE, BY BUSINESS SEGMENTS, 2010 � 2011 ($MILLION)
TABLE 90 THQ: MARKET REVENUE, BY GEOGRAPHY, 2010 � 2011 ($MILLION)
TABLE 91 DISNEY: TOTAL REVENUE, 2009 � 2010 ($MILLION)
TABLE 92 DISNEY: MARKET REVENUE, BY BUSINESS SEGMENTS, 2009 � 2010 ($MILLION)
TABLE 93 DISNEY: MARKET REVENUE, BY GEOGRAPHY, 2009 � 2010 ($MILLION)
TABLE 94 TIME WARNER: MARKET REVENUE, BY BUSINESS SEGMENTS, 2009 � 2O10 ($MILLION)
TABLE 95 TIME WARNER: MARKET REVENUE, BY GEOGRAPHY, 2009 � 2O10 ($MILLION)
TABLE 96 UBISOFT: TOTAL REVENUE AND R&D EXPENDITURE, 2010 � 2011 ($MILLION)
TABLE 97 UBISOFT: MARKET REVENUE, BY PRODUCT PLATFORM, 2010 � 2011 ($MILLION)
TABLE 98 UBISOFT: MARKET REVENUE, BY BUSINESS SEGEMENT, 2010 � 2011 ($MILLION)
TABLE 99 UBISOFT: MARKET REVENUE, BY GEOGRAPHY, 2010 � 2011 ($MILLION)
LIST OF FIGURES
FIGURE 1 MOBILE CELLULAR TELEPHONE SUBSCRIPTIONS (POSTPAID + PREPAID)
FIGURE 2 MARKET SHARE OF PLAYERS IN ANIMATION MARKET, BY STRATEGIC DEVELOPMENTS, (JANUARY 2009 � SEPTEMBER 2011)
FIGURE 3 MARKET SHARE OF PLAYERS IN GAMING MARKET, BY STRATEGIC DEVELOPMENTS (JANUARY 2009 - SEPTEMBER 2011)
FIGURE 4 ANIMATION VALUE CHAIN
FIGURE 5 GAMING VALUE CHAIN
FIGURE 6 ANIMATION PATENTS (JANUARY 2008 - SEPTEMBER 2011)
FIGURE 7 GAMING PATENTS (JANUARY2008 � SEPTEMBER 2011)
FIGURE 8 ANIMATION MARKET COMPETITIVE DEVELOPMENTS (JANUARY 2010 � SEPTMBER 2011)
FIGURE 9 GAMING MARKET COMPETITIVE DEVELOPMENTS (JANUARY 2010 � SEPTEMBER 2011)


Growth opportunities and latent adjacency in Mobile, PC & Console Gaming & Animation (by Entertainment, 2D, 3D, Visual Effects, TV, Direct-to-DVD and Content) Market