Anti-Jamming Market for GPS by Receiver Type (Military & Government Grade, and Commercial Transportation Grade), Technique (Nulling, Beam Steering, and Civilian), End-User, Application, and Geography - Global Forecast to 2025
Anti-Jamming Market for GPS
GPS Anti-Jamming Market and Top Companies
- BAE Systems (UK) − BAE Systems provides a full range of products and services for air, land, and naval forces; advanced electronics; security, information technology solutions; and support services. BAE Systems has proven expertise in delivering reliable, accurate navigation products for precision-guided missile and munitions systems. This includes Integrated GPS Anti-jam System (IGAS). Furthermore, BAE Systems’ next-generation of Digital GPS Anti-jam Receiver (DIGAR) technology offers the best available airborne GPS jamming protection. To grow in the GPS anti-jamming market, the company has selected inorganic growth strategies such as contracts and acquisitions, which resulted in the expansion of the company’s product offerings and has strengthened its position in the GPS anti-jamming market.
- Raytheon Technologies Corp. (US) – Raytheon Technologies Corp. is an aerospace & defense Company that provides advanced systems and services for commercial, military, and government customers worldwide. The company provides various anti-jamming systems and solutions through the Space and Airborne Systems segment. SAS designs, develops, and manufactures integrated sensor and communication systems for advanced missions. Its product line, Secure Sensor Solutions, develops sophisticated anti-jam GPS solutions. Raytheon is one of the leaders in the development, production, and supply of analogue and digital GPS anti-jamming systems to the majority of the world’s military forces. Currently, Raytheon UK provides GPS anti-jam systems to the UK Ministry of Defence, US Department of Defense, and more than 20 other nations.
- Thales Group (UK) − Thales Group is a holding company that manufactures, markets, and sells electronic equipment and systems for the aeronautics, naval, and defense sectors. Thales has the unique capability of designing and deploying equipment, systems, and services to meet the most complex security requirements in civil, military, and government sectors. For more than 30 years, Thales military receivers have been onboard various military platforms with thousands of units delivered: missiles, fighters, air transport, helicopters, patrol aircraft, surface ships, UAVs, radar, fire control systems, etc. They are all suitable for both, linefit and retrofit programs. Thales offers a range of GNSS receivers with high-performance accuracy, integrity, anti-jamming, anti-spoofing, and SAASM functionalities for demanding platforms such as helicopters, UAVs, radars, missiles, fighters, and surface ships.
- Cobham Ltd. (UK) − Cobham Ltd. is a provider of aerospace, space, and defense systems for the air, land, and sea platforms. It designs, manufactures, and supplies components and subsystems for military and civil applications. Cobham systems provide significant immunity to jamming compared with a conventional GPS antenna, allowing the platform to operate up to 100 times closer to the jammer and maintain reception. Cobham’s customizable modular family of products and installed performance simulation tools help provide solutions to suit all platform types and requirements.To grow in the GPS anti-jamming market, the company has selected inorganic growth strategies such as contracts and acquisitions, which resulted in the strengthening of the company’s market share in the GPS anti-jamming market.
- Hexagon (Sweden) – Hexagon develops sensor, software, and autonomous solutions. It provides information technology solutions that drive productivity and quality across geospatial and industrial enterprise applications. NovAtel, part of Hexagon, is a global technology leader, pioneering end-to-end solutions for assured autonomy and positioning on land, sea, and air. NovAtel offers anti-jamming and anti-spoofing solutions through the Autonomy & Positioning division. NovAtel announced an addition to its GPS Anti-Jam Technology (GAJT) portfolio, the GAJT-410ML. In May 2019, the GAJT-410ML is the next evolution of NovAtel’s battle-proven anti-jam technology.
GPS Anti-Jamming Techniques
- Nulling Technique − Nulling is the most common anti-jamming technique used to counter GPS jamming threats. Most GPS receivers have an antenna array, with a maximum of seven receiving elements, which are arrayed in a pattern that is geometrically symmetrical. Whenever jamming interference is detected, a part of that pattern is turned down so that the noise or jamming signal coming from a particular direction no longer interferes with the system. However, whenever a nulling pattern is activated, the GPS receiver loses its ability to receive satellite signals for navigation, which is a major disadvantage of nulling.
- Beam Steering Technique − Beam steering, or beam former, is the most effective GPS anti-jamming technique used by various armed forces. This technique is independent of the source of the jamming signal. It selects and receives signals from at least four different GPS satellites and correspondingly produces four different anti-jamming solutions in the form of four different anti-jamming algorithms. These algorithms are decoded by GPS receivers to determine the best possible solution to counter the jamming threat.
- Civilian Techniques − Civilian GPS anti-jamming techniques refer to various preventive measures taken on standard civilian-grade GPS receivers to enhance their ability to receive GPS signals. GPS signals, being inherently weak, are prone to unintentional jamming. The main objective of the civilian GPS anti-jamming systems is to counter unintentional jamming and also to counter the jamming threats caused by commercially available GPS jammers.
GPS Anti-Jamming Technology Trends
- Compact GPS anti-jam systems
Recently, manufacturers have been developing new, compact, and cost-effective GPS anti-jamming solutions. For example, in August 2019, Raytheon UK designed a compact GPS anti-jam antenna system that protects its signal within the electromagnetic spectrum. The one-box system, called Landshield Plus, allows the GPS equipment to function against a wide range of jammers. It is a low-cost and low-power technology that can be used with standalone GPS receivers. The system also works within communication, inertial navigation, sighting, vehicle, or weapon-aiming systems.
- Alternative to GPS Anti-Jam technology
GPS anti-jam has long been a major concern for military users. Controlled Radiation Pattern Antennas (CRPAs) have dominated military anti-jam solutions; however, they are costly, require a great deal of power, and are inherently limited in the number of spatial nulls that can be formed. Current state-of-the-art in GPS anti-jam technology relies heavily on antennas that consist of multi-element arrays and a processing unit that performs a phase-destructive sum of any intentional and unintentional interference signals in the GPS band. The protection that these technologies provide is limited to the number of individual elements contained in the antenna array. If this limitation is exceeded, the GPS signal will rapidly degrade and become buried in the noise. In order to overcome these limitations, GPS anti-jam technologies that do not rely on multi-element antennas are required. Alternative technologies may include, but are not limited to, hardware and software solutions such as antenna masking, power limiters, and advanced signal processing techniques.The US army is trying to develop alternative ways to obtain positioning, navigation, and timing (PNT) other than GPS.
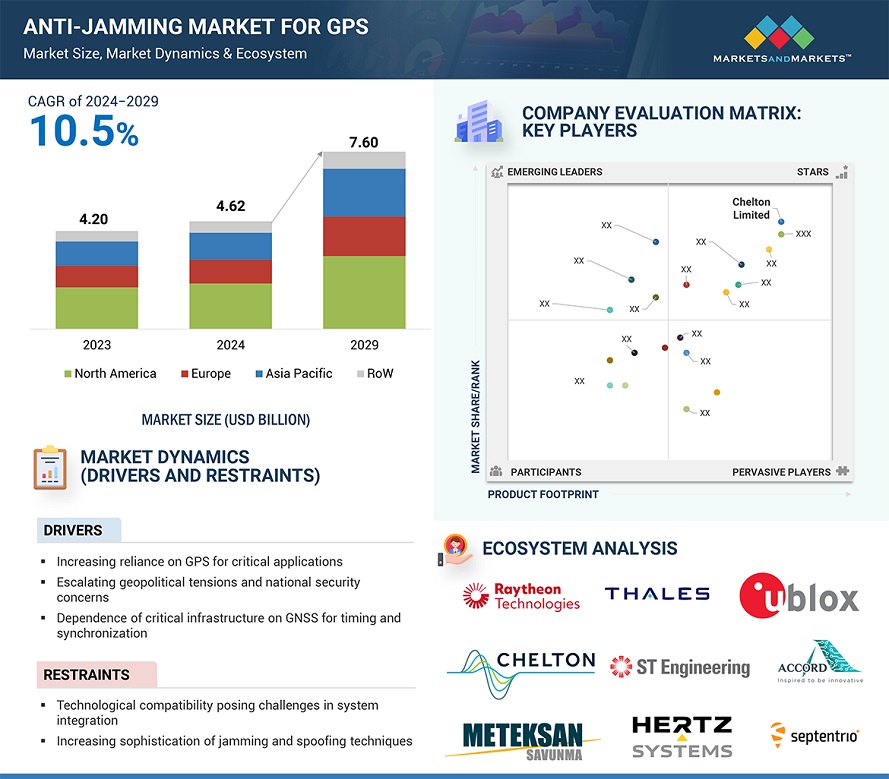
The global anti-jamming market for GPS is expected to grow from USD 4.62 billion in 2024 to USD 7.60 billion by 2029, growing at a CAGR of 10.5% during the forecast period. Increasing dependence on GPS for various critical applications such as navigation, defense, and management of infrastructure is the primary growth factor for the Anti-Jamming Market for GPS. Increasing geopolitical tensions and rising national security concerns amplify the requirements for more robust GPS protection systems. The reliance of these infrastructures on GNSS-based timing and synchronization further intensifies the necessity for such anti-jamming solutions. Technological advancement of methods that prevent jamming as well as increased application of autonomous technologies is promoting growth by ensuring uninterrupted and secure operation of the GPS.
To know about the assumptions considered for the study, Request for Free Sample Report
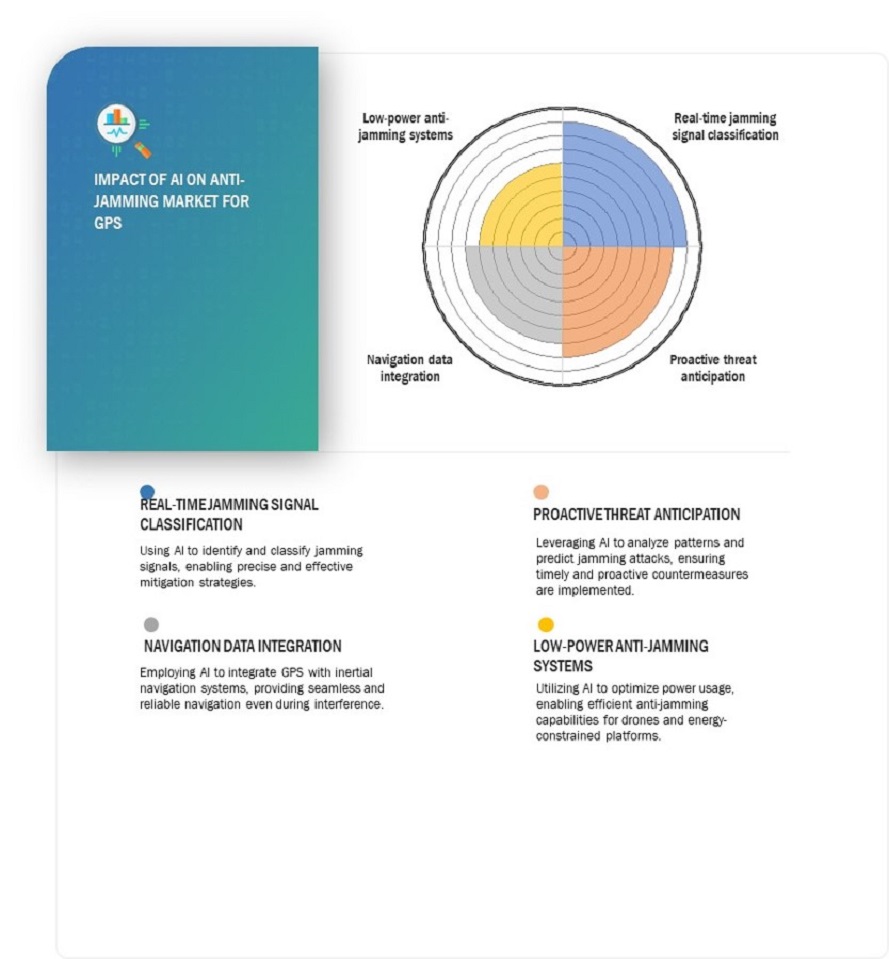
AI Impact on Anti-jamming market for GPS
Advances in AI in the anti-jamming market of GPS have transformed the capability to detect, mitigate, and adapt. Therefore, algorithms based on AI allow the real-time identification of jamming signals to be optimally used in order to identify complex patterns in the interference GPS signal. This therefore minimizes the chances of malicious jamming. Integration of AI also supports predictive analytics, which allows the anti-jamming systems to predict and adapt the shifting jamming strategies particularly within high-risk environments like military operations and autonomous systems. As GPS-dependent technologies including drones, autonomous vehicles, and IoT devices rise in popularity, AI-driven anti-jamming solutions come at a critical stage as it ensures the systems to work within the reliability and resiliency boundaries of system survivability.
Further, Al supports adaptive beamforming and signal processing methods in which the anti-jamming systems can dynamically adjust parameters in real time to respond to threats by active jamming. Since it keeps on learning and evolving due to further advancements in machine learning, it is better for emerging technologies in jamming. Al is employed for reducing latency in multi-signal environment to ensure that mission-critical applications run without problem. Al-based anti-jamming solutions have been deployed to provide commercial logistics and aviation sectors with the reliability of GPS systems necessary for navigation and communication. As Al progresses, the role it will play in cost optimization, scalability, and performance enhancement is likely to transform the Anti-Jamming market, driving growth and innovation across industries relying on GPS technologies.
Anti-jamming market for GPS Dynamics
Driver: Developing dependence on GPS for critical applications
This increased dependence of GPS on critical applications in various sectors speed up the development of anti-jamming technology. Transportation, finance, power distribution, and agriculture rely increasingly on GNSS to gain proper positioning, navigation, and timing. This dependency has developed rapidly and, more often than not, without adequate safeguards, which makes them vulnerable to devastating losses that may lead to serious disturbances in the provision of essential services and national security threats. As GPS becomes foundational to new paradigms such as self-driving cars and drones, it makes possible the danger of jamming-intentional or otherwise-and seriously risks their functioning and safety, thereby making heavy defense is a must. To address these liabilities, there has been a growing demand for more advanced anti-jamming capabilities that ensure the reliability of GPS-dependent systems. Some of the organizations and government, in particular the US government, have been encouraging for tougher GPS receivers that are capable of resisting obstruction, plus backup systems to mitigate possible GPS signal interferences. To foster the reliability of PNT systems, the Department of Homeland Security has introduced sources that are to be used by the user for planning signal loss and to ensure precision in received data. With the threat landscape in evolution, the push for durable GPS technologies becomes increasingly important in safeguarding infrastructure and maintaining operational efficiency in a world that relies heavily on satellite navigation.
Challenge: Improved complexity of jamming and spoofing technologies
The more complex the jamming and spoofing technologies, the more significant the challenge it imposes on the GPS anti-jamming market. Jamming overpowers legitimate GPS signals with noise or other signals that disrupt navigation and positioning systems. Although jamming has long been a recognized threat, the increasing ease of accessibility and affordability of jamming devices makes the technology a significant problem. For example, cheap jammers can easily jam the L1 band, which most commercial GPS receivers use. With the advancement of the technology to produce multi-frequency jammers, the threat level increases, and hence the anti-jamming solution needs to be improved day by day. This rising trend in jamming capabilities raises the need for strong countermeasures, which increases the demand for high-end anti-jamming technologies that can fight these powerful attacks. Spoofing, in contrast, is the more sneaky challenge since it involves transmitting false GPS signals for deception purposes that would inform users of their wrong location. Spoofing techniques have significantly improved in sophistication, especially with the emergence of SDRs, which enable malicious actors to create convincing fake signals. Unlike jamming, spoofing attacks are subtle, and the source may be hardly detectable using high-quality equipment. As such, detection of spoofing attacks proves to be complex, hence complicating the development of effective anti-spoofing measures that must differentiate between the authentic and the counterfeit signals in real time. This dynamic threat requires ever-changing innovation in detection algorithms and techniques in signal processing, which imposes additional pressure on the anti-jamming market to move along with these advanced tactics and ensure reliable GPS functionality across various applications.
Anti-jamming market for GPS Ecosystem
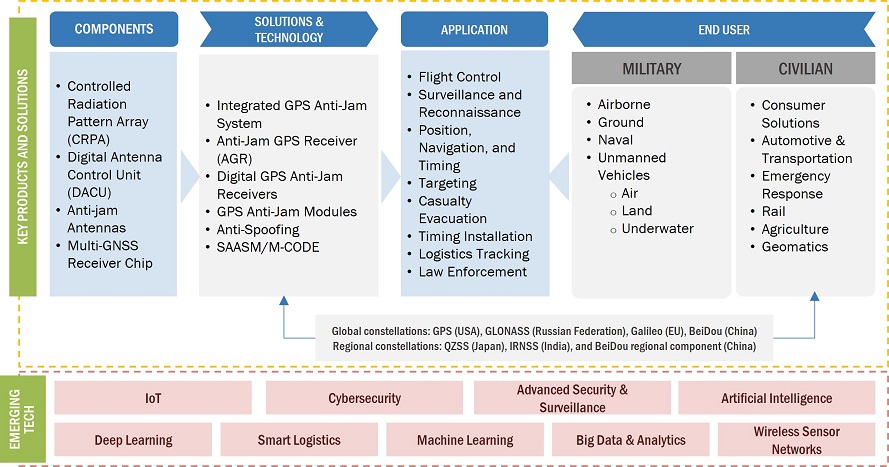
This chapter addresses the GPS anti-jamming ecosystem and its adaptation in various military and civil applications. A GPS anti-jamming system involves basic constituents like digital antenna control units, anti-jam antennas, and receiver chips. Solutions include integrated GPS anti-jam systems, anti-jam GPS receivers, SAASM GPS receivers, and GPS anti-jam modules, operating on global navigation satellite systems like GPS of the US, GLONASS of Russia, Galileo of the EU, and BeiDou of China. Its applications range from flight control, security and surveillance, targeting to position, navigation, and timing (PNT). Big data, AI, IoT, and cybersecurity are at the forefront of the innovations and adoption of this ecosystem.
Excision technique segment to register highest CAGR during forecast period
Excision is a type of GPS anti-jamming technique that eliminates or suppresses narrowband interference from the received data. It identifies signals that are above a predetermined threshold calculated by statistical calculations and eliminates them. It is an effective method of dealing with narrowband interference like radio signals or any specific-frequency emitters without consuming the reserved nulling channels. The transformed signals are then used for nulling and other further processes that would ensure signal integrity once interference is removed. In this method, the system would be able to retain valid GPS signals while eliminating harmful jamming sources. The adoption of excision techniques is increasingly being motivated by the growing complexity of interference scenarios, especially for environments where there may exist multiple jammers. Such excision thus presents a solution which requires no multiple antennas and less hardware to be used, therefore becoming cheaper and more scalable for numerous applications. Increasing GPS applications in such sectors as aviation, defense, and autonomous systems mean increasing the demands for better anti-jamming techniques like excision where powerful computing can help in the processing reduce latency that used to plague the approach.
Military & Government Grade receiver type segment to register highest CAGR during the forecast period
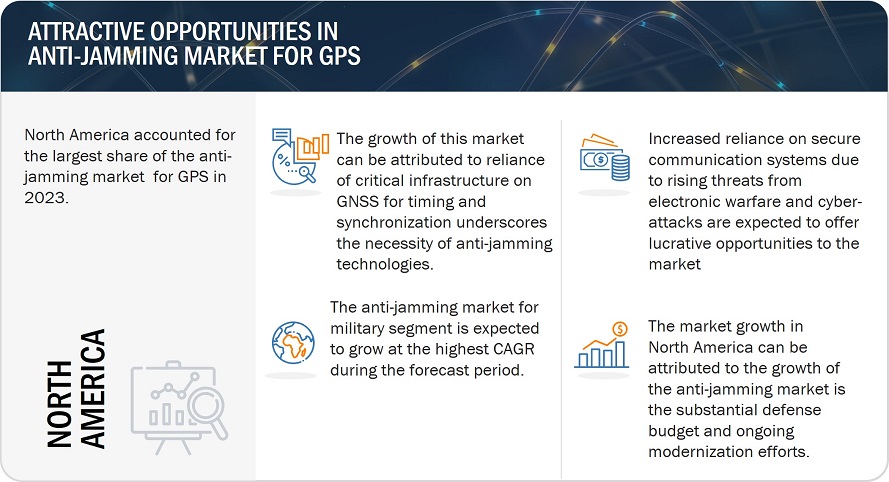
The market for military- & government-grade receivers is pushed by the critical requirement of reliable navigation and communication in defense operations. Military devices are vulnerable to jamming. GPS technology used in military applications must be capable of withstanding and working around vulnerabilities to oppose the risk of jamming attacks. Military receivers make use of encrypted GPS signals that protect them from jamming and authenticate signals. Military applications require accurate and secure levels of positioning because GPS technology is being used for many operations like missile guidance, troop movements, and reconnaissance missions. It is another reason for military forces to invest in advanced anti-jamming solutions that preserve operational effectiveness as opponents start more broadly deploying sophisticated jamming and spoofing technologies aimed at degrading the reliability of GPS signals. On-demand modernization of military assets coupled with the introduction of technologies, such as AI and ML into the navigation systems is accelerating the growth of robust anti-jamming capabilities. In addition, increasing geopolitical conflicts and tensions in multiple regions increased the need for protection from signal jamming in military resources. Governments continue to set aside large research budgets dedicated to developing next-generation GPS anti-jamming systems against a vast array of threats, ranging from electronic warfare tactics and spoofing attacks to cyber interferences.
Military segment captured largest share of anti-jamming market for GPS in 2023
The most prominent impacts of the invention of GPS technology in modern warfare is its role in satellite-based systems of position, timing, and communication upon which military organizations rely for accurate positioning. However, on the ground, the received signals are inherently weak and prone to interference or deliberate jamming. Most signals are also masked by thermal noise and could not be detected by ordinary devices without a GPS receiver. Low-power jammers that can affect GPS signals over large areas are now so widespread that they pose a serious threat to military operations. Traditionally, anti-jamming solutions were only feasible for high-value assets, such as strategic aircraft and naval ships, because of their size and cost, but technological advancements are rapidly changing that landscape. Modern GPS anti-jamming technology blocks interference from narrowband signals, such as those coming from TV stations or FM radios, and more threatening broadband jammers that could occupy the entire GPS frequency spectrum. Most of the effectiveness of the systems depends on the number of antenna elements, which sets the number of interfering signals that can be neutralized. This makes the technology more accessible throughout a broader range of military applications, thus ensuring greater protection against jamming threats in modern warfare.
China to exhibit highest CAGR in Asia Pacific anti-jamming market for GPS during forecast period
China is experiencing rapid growth in the GPS anti-jamming market, driven by growing defense spending and an increased need to strengthen military navigation systems. The conflicts, which the country faces continuously in various areas, especially in South China Sea, are increasing its demands for improved marine communication and surveillance capabilities. Given rising tensions in the region, the Chinese military is now acquiring GPS anti-jamming technologies to protect its operations of navigation, targeting, and reconnaissance, all dependent on GPS signals prone to interference. The need for GPS anti-jamming systems is likely to increase drastically within the coming years in China because the country is modernizing its forces and increasing defense spending. The increase in its use for core military missions has created the need for China to take high-quality anti-jamming capabilities to help improve the performance and protection against electronic threats. Improvements in the GPS protection are hence imperative for guaranteeing the robustness and consistency of the military engagements under disputed circumstances. China also established the BeiDou Navigation Satellite System, incorporating the powerful capabilities with good anti-jamming, for military applications among others. During military modernization, China is placing BeiDou-based systems within its People's Liberation Army to achieve safe and continuous GPS guidance and aiming during hostile areas. PLA is further strengthening its concentration on the security of GPS with the creation of electronic warfare teams against the jamming of GPS signals.
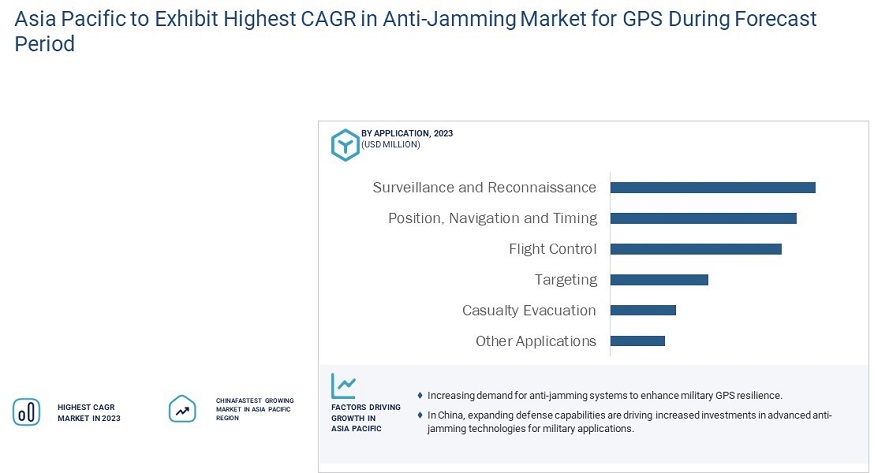
Anti-Jamming Market by Region
To know about the assumptions considered for the study, download the pdf brochure
Anti-Jamming Market Report Scope:
|
Report Metric |
Details |
| Estimated Market Size | USD 4.0 Billion |
| Projected Market Size | USD 5.9 Billion |
| Growth Rate | CAGR of 7.9% |
|
Market size available for years |
2020–2025 |
|
On Demand Data Available |
2030 |
|
Report Coverage |
|
|
Segments covered |
|
|
Geographies covered |
|
|
Companies covered |
|
| Key Market Driver | High Demand for GPS Technology in Military Applications |
| Largest Growing Region | Asia Pacific |
| Largest Market Share Segment | Surveillance and Reconnaissance Segment |
| Highest CAGR Segment | Civilian Techniques Segment |
This report categorizes the GPS anti-jamming market based receiver types, anti-jamming techniques, end users, applications, and geography.
Anti-Jamming Market for GPS, by Receiver Type
- Military & Government Grade
- Commercial Transportation Grade
Anti-Jamming Market for GPS, by Anti-Jamming Technique
- Nulling Technique
- Beam steering Technique
- Civilian Technique
Anti-Jamming Market for GPS, by Application
- Flight Control
- Surveillance and Reconnaissance;
- Position, Navigation, and Timing;
- Targeting;
- Casualty Evacuation;
- Other Applications (Timing Installation, Logistics Tracking, and Law Enforcement)
Anti-Jamming Market for GPS, by End User
-
Military
- Airborne
- Ground
- Naval
-
Unmanned Vehicles
- Air
- Land
- Underwater
- Civilian
Anti-Jamming Market for GPS, by Geography
-
North America
- US
- Canada
- Mexico
-
Europe
- Germany
- UK
- France
- Rest of Europe
-
APAC
- China
- Japan
- India
- South Korea
- Rest of APAC
-
RoW
- Middle East & Africa
- South America
Key Market Players
The anti-jamming market for GPS market is dominated by players such as:
- BAE Systems (UK)
- RTX (US)
- Thales (France)
- L3Harris Technologies, Inc. (US)
- Lockheed Martin Corporation (US)
- Hexagon AB (Sweden)
- DS Navcours (South Korea)
- Honeywell International Inc. (US)
- Mayflower Communications (US)
- InfiniDome (Israel)
- Israel Aerospace Industries Ltd. (IAI) (Israel)
- FURUNO ELECTRIC CO.,LTD. (Japan)
- Meteksan Defence Industry Inc. (Turkey)
- SAFRAN (France)
- u-blox (Switzerland)
Recent Developments
- In June 2024, BAE Systems (UK) launched the NavStorm-M, a gun-hardened anti-jamming GPS receiver designed for military applications, including artillery and unmanned systems. This advanced receiver utilizes a layered protection approach incorporating beamforming, anti-spoofing, and software assurance to ensure reliable positioning, navigation, and timing (A-PNT).
- In March 2024, L3Harris Technologies, Inc. (US) launched the Anti-jam Resilient Radio Objective Waveform (ARROW) designed to enhance communication resilience in mobile, tactical-edge operations amid adversarial interference. This waveform is purpose-built for secure coalition interoperability, supporting Type 3 voice, data, and Position Location Information without reliance on GPS.
- In November 2023, Thales (France), expanded its presence in India by opening a new office in Bengaluru, extending its 2019 Engineering Competence Centre. It supports the company’s plan to double its engineering staff in India by 2027, focusing on aerospace and defense systems.
- In July 2023, RTX (US) announced that the UK Ministry of Defence has purchased its 1,000th Landshield unit, a significant milestone in enhancing the defense of critical GPS signals. The Landshield system is a compact, lightweight, anti-jamming solution that protects military operations from GPS interference.
- In May 2023, NovAtel (Canada) made a contract to provide its GPS Anti-Jam Technology (GAJT) antennas for the Canadian Army’s Armoured Combat Support Vehicles (ACSVs), enhancing resilience against cyber electromagnetic activities (CEMA). The GAJT system effectively mitigates threats to positioning, navigation, and timing (PNT) by ensuring continuous access to GPS signals while blocking interference from jammers.
Frequently Asked Questions (FAQ):
What is the expected CAGR for the anti-jamming market for GPS from 2024 to 2029?
The global anti-jamming market for GPS is expected to record a CAGR of 10.5% between 2024 and 2029.
Which regions are expected to pose significant demand for anti-jamming market for GPS during the forecast period?
Asia Pacific and North America are expected to witness significant demand due to rapid urbanization, infrastructure development, and increased security concerns in major economies such as India, China, Japan, the US, and Canada.
What are the significant growth opportunities in the anti-jamming market for GPS?
Significant growth opportunities in the GPS anti-jamming market include increasing demand for secure navigation in autonomous systems, expanding military modernization programs globally, and growing reliance on satellite navigation for critical infrastructure. Additionally, advancements in AI-powered anti-jamming solutions and rising adoption of regional navigation systems like BeiDou and Galileo further drive market potential.
Which are the key players operating in the anti-jamming market for GPS?
Key players operating in the anti-jamming market for GPS BAE Systems (UK), RTX (US), Thales (France), L3Harris Technologies, Inc. (US), Lockheed Martin Corporation (US), Hexagon AB (Sweden), and DS Navcours (South Korea).
What are the major applications of anti-jamming market for GPS?
Flight Control, Surveillance and Reconnaissance, Position, Navigation, and Timing, Targeting, Casualty Evacuation, and Other Applicationsare the major applications of anti-jamming market for GPS.
To speak to our analyst for a discussion on the above findings, click Speak to Analyst

The study involved 4 major activities to estimate the size of the anti-jamming market for GPS. Exhaustive secondary research has been conducted to collect information on the anti-jamming market for GPS. Validation of these findings, assumptions, and sizing with industry experts across value chain through primary research has been the next step. Both, top-down and bottom-up approaches have been employed to estimate the complete market size. After that, market breakdown and data triangulation have been used to estimate the market size of segments and subsegments.
Secondary Research
In the secondary research, various secondary sources have been referred to for identifying and collecting information important for this study. Secondary sources include corporate filings (such as annual reports, investor presentations, and financial statements); trade, business, and professional associations; white papers, machine condition monitoring related journals, and certified publications; articles from recognized authors; gold and silver standard websites; directories; and databases. A few examples of secondary sources are GPS: The Global Positioning System, European GNSS Agency, Federal Communications Commission (FCC), and US Department of Defense.
Primary Research
In the primary research, various primary sources from both the supply and demand sides have been interviewed with to obtain the qualitative and quantitative information for this report. Primary sources from the supply side include industry experts such as CEOs, VPs, marketing directors, technology and innovation directors, and related key executives from major companies and organizations operating in the anti-jamming market for GPS. Following is the breakdown of primary respondents.
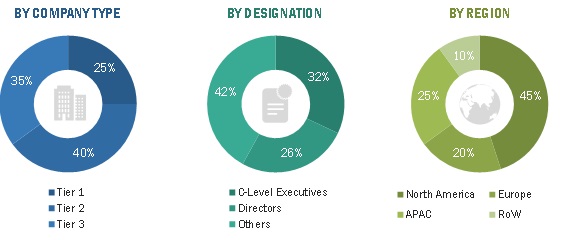
To know about the assumptions considered for the study, download the pdf brochure
Market Size Estimation
Both, top-down and bottom-up approaches have been used to estimate and validate the size of the overall GPS anti-jamming market and the market based on subsegments. The research methodology used to estimate the market size has been given below:
- Key players in the market have been identified through extensive secondary research.
- The industry’s supply chain and market size, in terms of value, have been determined through primary and secondary research processes.
- All percentage shares, splits, and breakdowns have been determined using secondary sources and verified through primary sources.

To know about the assumptions considered for the study, Request for Free Sample Report
Data Triangulation
After arriving at the overall market size—using the estimation processes explained above—the market has been split into several segments and subsegments. To complete the overall market engineering process and arrive at the exact statistics of each market segment and subsegment, data triangulation and market breakdown procedures have been employed, wherever applicable. The data has been triangulated by studying various factors and trends in both demand and supply sides of the GPS Anti-jamming market.
Report Objectives
- To describe and forecast the GPS anti-jamming market size, in terms of value, based on receiver type, anti-jamming technique, application, end user, and geography
- To forecast the GPS anti-jamming market size, in terms of volume, based on receiver type, end user, and geography
- To describe and forecast the market size, in terms of value, for various segments, by region—North America, Europe, Asia Pacific (APAC), and the Rest of the World (RoW), along with the respective countries
- To provide detailed information regarding drivers, restraints, opportunities, and challenges pertaining to the GPS anti-jamming market
- To strategically analyze the micromarkets1 with respect to the individual growth trends, prospects, and their contribution to the GPS anti-jamming market
- To strategically profile key players in the GPS anti-jamming market and comprehensively analyze their market share and core competencies2
- To provide a detailed overview of the GPS anti-jamming value chain
- To analyze competitive developments such as contracts, acquisitions, product launches and developments, collaborations, and partnerships, along with research & development (R&D) in the GPS anti-jamming market
- To analyze the impact of COVID-19 on the growth of the GPS anti-jamming market
Available Customizations
Along with the market data, MarketsandMarkets offers customizations according to a company’s specific needs. The following customization options are available for the report:
Company Information
- Detailed analysis and profiling of additional market players (up to 5)


Growth opportunities and latent adjacency in Anti-Jamming Market
Did anti-jamming solutions report cover the study across the constellations such as Beidou, Galileo, QZSS, and Glonass? If, yes, what percentage of anti-jamming market size for each of these?
Is this study included anti-spoofing too? If yes, please tell me the major players who provided both the solutions and market share for those?
We are interested only in the timing applications of the anti-jamming market, which is a small part of the report. Can we purchase the timing section only? Also we would like to know the future opportunities of the market.
At what extend, these anti-jamming solutions will help commercial or transportation users? Can you provide the market size estimation for next 5 years? Also, what are major key players dealing in anti-jamming market for commercial applications?
IS there is any price difference between the anti-jamming solutions provided to military and commercial applications? And please provide a detailed information related to players in each application?
I am working on a market research project in anti-jamming techniques for a large Defense company. Please can you outline the process for buying this report as a purchase order would need to be raised.
How the government expenditure on military solutions will impact the market size of anti-jamming solutions in various countries? What all type of anti-jamming solutions have you considered for military application?
What is the scope of the anti-jamming market? Have you included the market sizing for anti-jamming in African region?