Anti-Slip Additives Market by Type (Aluminium Oxide, Silica, Others (Polymer Grits/Beads, Pulverized Plastic, Crushed Glass)), Application (Construction Flooring, Marine Deck), and Region (APAC, Europe, North America) - Global Forecast to 2023


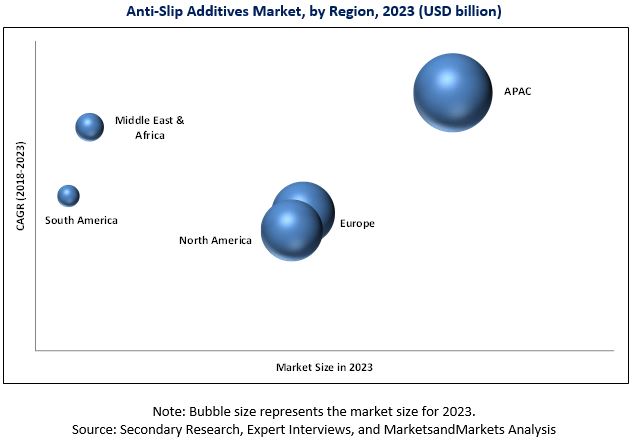
The anti-slip additives market is projected to reach USD 444.7 million by 2023, at a CAGR of 4.6%. In this report, 2017 is considered as the base year and the forecast period is 2018 to 2023. APAC is projected to be the fastest-growing market for anti-slip additives due to increasing construction activities, as well as the technologically-advanced and emerging countries (in terms of port network) in the region demanding innovative, highly efficient, renewable, and less toxic anti-slip additives.
Anti-Slip Additives Market Objectives of the Study:
- To define, describe, and analyze the global anti-slip additives market based on type, application, and region
- To forecast and analyze the market size (in terms of value and volume) in 5 regions, namely, APAC, Europe, North America, Central & South America, and the Middle East & Africa
- To forecast and analyze the market at country-level for each region
- To strategically analyze each submarket with respect to individual growth trends and their contribution to the global anti-slip additive market
- To analyze opportunities in the market for stakeholders by identifying high growth segments of the global anti-slip additives market
- To identify trends and factors driving or inhibiting the growth of the market and submarkets
- To analyze competitive developments, such as expansions and new product launches, in the global anti-slip additives market
- To strategically profile key market players and comprehensively analyze their growth strategies
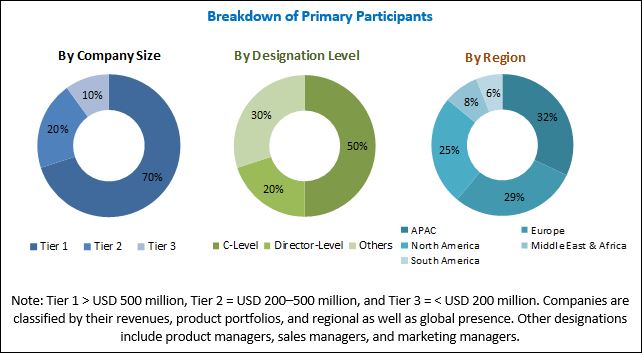
This technical, market-oriented, and commercial research study of the global anti-slip additives market involves extensive use of secondary sources, directories, and databases (such as Hoovers, Bloomberg BusinessWeek, and Factiva) to identify and collect information. The primary sources mainly include several industry experts from the core and related industries and preferred suppliers, manufacturers, distributors, service providers, and organizations related to all segments of the industry’s supply chain. After arriving at the overall market size, the total market has been split into several segments. The figure below illustrates the breakdown of the primary interviews based on company type, designation, and region conducted during the research study.
To know about the assumptions considered for the study, download the pdf brochure
Key Players in Anti-Slip Additives Market
Key manufacturers of anti-slip additives include BYK Chemie GmbH (Germany), PPG Industries, Inc. (US), Hempel A/S (Denmark), Rust-Oleum Corporation (US), Vexcon Chemicals (US), Saicos Colour GmbH (Germany), Exterior Performance Coating (US), Associated Chemicals (India), Axalta Coatings Ltd. (US), and Coo-Var (UK).
Target Audience for the Anti-Slip Additives Market Report
- Anti-slip Additives Manufacturers
- Anti-slip Additives Suppliers and Distributors
- Raw Material Suppliers
- Construction and Maritime Industry
- Government Bodies
Anti-Slip Additives Market Report Scope
This report categorizes the global anti-slip additives market based on type, application, and region.
Anti-slip Additives Market, By Type
- Aluminum Oxide
- Silica
- Others
Anti-slip Additive Market, By Application
- Construction Flooring
- Marine Deck
- Others
Anti-slip Additives Market, By Region
- APAC
- Europe
- North America
- Middle East & Africa
- South America
Anti-Slip Additives Market Report Available Customizations
With the given market data, MarketsandMarkets offers customizations according to a company’s specific needs. The following customization options are available for the report:
Regional Analysis
- Further breakdown of a region with respect to a particular country, type, or application
Country Information
- Additional country information (up to 3)
Company Information
- Detailed analysis and profiles of additional market players (up to 5)
The global anti-slip additives market is estimated to be USD 355.1 million in 2018 and is projected to reach USD 444.7 million by 2023, at a CAGR of 4.6% from 2018 to 2023. Increasing population and rapid urbanization are expected to drive the growth of the global anti slip additives market.
Based on type, the global anti-slip additives market has been segmented into aluminum oxide, silica, and others. The silica segment is projected to grow at the highest CAGR during the forecast period due to the growing demand for highly efficient, durable, and environment-friendly products.
Based on application, the global anti slip additive market has been segmented into construction flooring, marine deck, and others. The marine deck segment is projected to grow at the highest CAGR during the forecast period. This is due to the increasing size and load carrying capacity of vessels, which has led to rising trade volumes with focus on developing more durable and sturdier marine crafts. The rise in trade is leading to the need to ensure implementation of safety measures to hold the cargo and people onboard the ship. This is subsequently leading to the use of marine deck coatings to ensure safety and reducing hazards.
Based on region, the global anti-slip additives market has been segmented into APAC, Europe, North America, Middle East & Africa, and South America. APAC was the largest market for anti-slip additives in 2017 and is projected to lead the global anti-slip additive market during the forecast period. The APAC anti slip additives market is driven mainly by the presence of the world’s busiest ports in countries such as China, Singapore, and Hong Kong. Increasing trade activities and rising infrastructural developments in the shipping industry (in the form of growing network of ports) are primarily responsible for the high demand for anti-slip additives in the region. The dominance of APAC is also due to the relaxed freight tax norms by the governments of India and China. Moreover, increasing strategic expansion activities by manufacturing companies in the region are also driving the anti-slip additives market.
Key Players in Anti-Slip Additives Market Industry
The major factor restraining the growth of the global anti-slip additives market is the presence of stringent environmental regulations pertaining to toxic VOC emissions. Some of the key players operating in the global anti-slip additive market include BYK Chemie GmbH (Germany), PPG Industries, Inc. (US), Hempel A/S (Denmark), and Rust-Oleum Corporation (US).
Frequently Asked Questions (FAQ):
How big is the Anti-Slip Additive Market industry?
The global anti-slip additives market is estimated to be USD 355.1 million in 2018 and is projected to reach USD 444.7 million by 2023, at a CAGR of 4.6% from 2018 to 2023.
Who leading market players in Anti-Slip Additive industry?
BYK Chemie GmbH (Germany), PPG Industries, INC. (US), Hempel A/S (Denmark), Rust-Oleum Corporation (US), and Vexcon Chemicals (Japan) are some of the leading players in the global anti-slip additives market.
To speak to our analyst for a discussion on the above findings, click Speak to Analyst
 Exclusive indicates content/data unique to MarketsandMarkets and not available with any competitors.
Table of Contents
1 Introduction (Page No. - 13)
1.1 Objectives of the Study
1.2 Market Definition
1.3 Market Scope
1.3.1 Regional Segmentation
1.3.2 Years Considered for the Study
1.4 Currency
1.5 Unit Considered
1.6 Limitations
1.7 Stakeholders
2 Research Methodology (Page No. - 18)
2.1 Research Data
2.1.1 Secondary Data
2.1.1.1 Key Data From Secondary Sources
2.1.2 Primary Data
2.1.2.1 Key Data From Primary Sources
2.1.2.2 Key Industry Insights
2.1.2.3 Breakdown of Primary Interviews
2.2 Market Size Estimation
2.2.1 Bottom-Up Approach
2.2.2 Top-Down Approach
2.3 Data Triangulation
2.4 Assumptions
3 Executive Summary (Page No. - 28)
4 Premium Insights (Page No. - 32)
4.1 Significant Growth Opportunities in the Anti-slip Additives Market
4.2 Anti slip Additives Market, By Type, 2018–2023
4.3 APAC Anti-slip Additive Market Share, By Country and Type, 2017
4.4 Anti slip Additive Market, By Region
5 Market Overview (Page No. - 34)
5.1 Introduction
5.2 Market Dynamics
5.2.1 Drivers
5.2.1.1 Rise in Population and Rapid Urbanization
5.2.1.2 Rapid Industrialization
5.2.1.3 Increasing Demand for Environmentally Friendly Products
5.2.2 Restraints
5.2.2.1 Stringent Environment Regulations
5.2.3 Opportunities
5.2.3.1 the Rapidly Growing Construction Industry
5.3 Porter’s Five Forces Analysis
5.3.1 Threat of New Entrants
5.3.2 Threat of Substitutes
5.3.3 Bargaining Power of Suppliers
5.3.4 Bargaining Power of Buyers
5.3.5 Intensity of Competitive Rivalry
5.4 Industrial Growth & Outlook
5.4.1 GDP Forecast of Major Economies
5.4.2 Shipping Industry
6 Anti-slip Additive Market, By Type (Page No. - 44)
6.1 Introduction
6.2 Aluminum Oxide
6.3 Silica
6.4 Others
7 Anti-slip Additive Market, By Application (Page No. - 51)
7.1 Introduction
7.2 Construction Flooring
7.3 Marine Deck
7.4 Others
8 Anti-slip Additives Market, By Region (Page No. - 58)
8.1 Introduction
8.2 APAC
8.2.1 Aluminum Oxide Dominates Overall APAC Anti-slip Additives Market
8.2.2 Anti-slip Additive Market in Construction Flooring Application to Witness Highest CAGR
8.2.3 China Accounts for Major Share of APAC Anti slip Additives Market
8.2.3.1 China
8.2.3.2 Japan
8.2.3.3 India
8.2.3.4 South Korea
8.3 Europe
8.3.1 Aluminum Oxide Segment Accounts for Largest Share of European Anti-slip Additives Market
8.3.2 Construction Flooring Application Holds Largest Share of Overall European Anti-slip Additive Market
8.3.3 Germany Accounts for Major Share of European Anti slip Additives Market
8.3.3.1 Germany
8.3.3.2 UK
8.3.3.3 France
8.3.3.4 Italy
8.3.3.5 Spain
8.4 North America
8.4.1 Silica Anti-Slip Additives to Witness Highest Growth in North America Market
8.4.2 Construction Flooring to Be Fastest-Growing Segment in North America Anti-slip Additives Market
8.4.3 US Accounts for Maximum Share of North America Anti-slip Additive Market
8.4.3.1 US
8.4.3.2 Canada
8.4.3.3 Mexico
8.5 Middle East & Africa
8.5.1 Silica to Be Fastest-Growing Segment of Middle East & Africa Anti-slip Additive Market
8.5.2 Construction Flooring Dominates Middle East & Africa Anti slip Additive Market
8.5.3 Saudi Arabia is Largest Market for Anti-Slip Additives in Middle East & Africa
8.5.3.1 UAE
8.5.3.2 Saudi Arabia
8.5.3.3 South Africa
8.6 Central & South America
8.6.1 Silica Anti-Slip Additives to Be Fastest-Growing Segment of Central & South America Anti-slip Additives Market
8.6.2 Construction Flooring to Register Highest CAGR in Central & South America Anti-slip Additives Market
8.6.3 Brazil is the Major Consumer of Anti-Slip Additives in Central & South America
8.6.3.1 Brazil
8.6.3.2 Argentina
9 Competitive Landscape (Page No. - 97)
9.1 Overview
9.2 Market Ranking of Key Players
9.2.1 Market Ranking of Major Players
9.3 Competitive Situation and Trends
9.3.1 Expansion
9.3.2 New Product Launch
9.3.3 Partnership
9.3.4 Acquisition
10 Company Profiles (Page No. - 102)
10.1 BYK-Chemie GmbH
10.1.1 Business Overview
10.1.2 Products Offered
10.1.3 Recent Developments
10.1.4 SWOT Analysis
10.1.5 MnM View
10.2 PPG Industries, Inc.
10.2.1 Business Overview
10.2.2 Products Offered
10.2.3 SWOT Analysis
10.2.4 MnM View
10.3 Hempel A/S
10.3.1 Business Overview
10.3.2 Products Offered
10.3.3 Recent Developments
10.3.4 SWOT Analysis
10.3.5 MnM View
10.4 Rust-Oleum Corporation
10.4.1 Business Overview
10.4.2 Products Offered
10.4.3 Recent Developments
10.5 Vexcon Chemicals
10.5.1 Business Overview
10.5.2 Products Offered
10.5.3 Recent Developments
10.6 Saicos Color GmbH
10.6.1 Business Overview
10.6.2 Products Offered
10.6.3 Recent Developments
10.7 Exterior Performance Coatings, Inc
10.7.1 Business Overview
10.7.2 Products Offered
10.7.3 Recent Developments
10.8 Associated Chemicals
10.8.1 Business Overview
10.8.2 Products Offered
10.8.3 Recent Developments
10.9 Axalta Coating Systems Ltd.
10.9.1 Business Overview
10.9.2 Products Offered
10.9.3 Recent Developments
10.10 Coo-Var
10.10.1 Business Overview
10.10.2 Products Offered
10.10.3 Recent Developments
10.11 Other Companies
10.11.1 Fineotex Chemicals Limited (India)
10.11.2 Promain UK Limited (England)
10.11.3 Sika AG (Switzerland)
10.11.4 Perk Products & Chemical Company (US)
10.11.5 Byd Solutions Ltd. (UK)
10.11.6 Cyndan Chemicals (Australia)
10.11.7 Jotun South Africa (Pty) Ltd. (Cape Town)
10.11.8 Firwood Paints Ltd. (UK)
10.11.9 Eco Safety Products (US)
10.11.10 the Sherwin-Williams Company (US)
11 Appendix (Page No. - 120)
11.1 Insights From Industry Experts
11.2 Discussion Guide
11.3 Introducing RT: Real-Time Market Intelligence
11.4 Knowledge Store: Marketsandmarkets’ Subscription Portal
11.5 Available Customizations
11.6 Related Reports
List of Tables (87 Tables)
Table 1 Trends and Forecast of GDP Growth, 2017–2022 (USD Billion)
Table 2 Anti-slip Additives Market Size, By Type, 2016–2023 (USD Million)
Table 3 Anti-slip Additive Market Size, By Type, 2016–2023 (Ton)
Table 4 Aluminum Oxide Anti-slip Additives Market Size, By Region, 2016–2023 (USD Million)
Table 5 Aluminum Oxide Anti-slip Additive Market Size, By Region, 2016–2023 (Ton)
Table 6 Silica Anti slip Additive Market Size, By Region, 2016–2023 (USD Million)
Table 7 Synthetic Anti slip Additives Market Size, By Region, 2016–2023 (Ton)
Table 8 Others Anti-slip Additives Market Size, By Region, 2016–2023 (USD Million)
Table 9 Others Anti-slip Additive Market Size, By Region, 2016–2023 (Ton)
Table 10 By Market Size, By Application, 2016–2023 (USD Million)
Table 11 By Market Size, By Application, 2016–2023 (Ton)
Table 12 By Market Size in Construction Flooring Application, By Region, 2016–2023 (USD Million)
Table 13 By Market Size in Construction Flooring Application, By Region, 2016–2023 (Ton)
Table 14 By Market Size in Marine Deck Application, By Region, 2016–2023 (USD Million)
Table 15 By Market Size in Hydraulic Fluid Application, By Region, 2016–2023 (Ton)
Table 16 By Market Size in Other Applications, By Region, 2016–2023 (USD Million)
Table 17 By Market Size in Other Applications, By Region, 2016–2023 (Ton)
Table 18 By Market Size, By Region, 2016–2023 (USD Million)
Table 19 By Market Size, By Region, 2016–2023 (Ton)
Table 20 APAC: By Market Size, By Type, 2016–2023 (USD Million)
Table 21 APAC: By Market Size, By Type, 2016–2023 (Ton)
Table 22 APAC: By Market Size, By Application, 2016–2023 (USD Million)
Table 23 APAC: By Market Size, By Application, 2016–2023 (Ton)
Table 24 APAC: By Market Size, By Country, 2016–2023 (USD Million)
Table 25 APAC: By Market Size, By Country, 2016–2023 (Ton)
Table 26 China: By Market Size, By Application, 2016–2023 (USD Million)
Table 27 China: By Market Size, By Application, 2016–2023 (Ton)
Table 28 Japan: By Market Size, By Application, 2016–2023 (USD Million)
Table 29 Japan: By Market Size, By Application, 2016–2023 (Ton)
Table 30 India: By Market Size, By Application, 2016–2023 (USD Million)
Table 31 India: By Market Size, By Application, 2016–2023 (Ton)
Table 32 South Korea: By Market Size, By Application, 2016–2023 (USD Million)
Table 33 South Korea: By Market Size, By Application, 2016–2023 (Ton)
Table 34 Europe: By Market Size, By Type, 2016–2023 (USD Million)
Table 35 Europe: By Market Size, By Type, 2016–2023 (Ton)
Table 36 Europe: By Market Size, By Application, 2016–2023 (USD Million)
Table 37 Europe: By Market Size, By Application, 2016–2023 (Ton)
Table 38 Europe: By Market Size, By Country, 2016–2023 (USD Million)
Table 39 Europe: By Market Size, By Country, 2016–2023 (Ton)
Table 40 Germany: By Market Size, By Application, 2016–2023 (USD Million)
Table 41 Germany: By Market Size, By Application, 2016–2023 (Ton)
Table 42 UK: By Market Size, By Application, 2016–2023 (USD Million)
Table 43 UK: By Market Size, By Application, 2016–2023 (Ton)
Table 44 France: By Market Size, By Application, 2016–2023 (USD Million)
Table 45 France: By Market Size, By Application, 2016–2023 (Ton)
Table 46 Italy: By Market Size, By Application, 2016–2023 (USD Million)
Table 47 Italy: By Market Size, By Application, 2016–2023 (Ton)
Table 48 Spain: By Market Size, By Application, 2016–2023 (USD Million)
Table 49 Spain: By Market Size, By Application, 2016–2023 (Ton)
Table 50 North America: By Market Size, By Type, 2016–2023 (USD Million)
Table 51 North America: By Market Size, By Type, 2016–2023 (Ton)
Table 52 North America: By Market Size, By Application, 2016–2023 (USD Million)
Table 53 North America: By Market Size, By Application, 2016–2023 (Ton)
Table 54 North America: By Market Size, By Country, 2016–2023 (USD Million)
Table 55 North America: By Market Size, By Country, 2016–2023 (Ton)
Table 56 US: By Market Size, By Application, 2016–2023 (USD Million)
Table 57 US: By Market Size, By Application, 2016–2023 (Ton)
Table 58 Canada: By Market Size, By Application, 2016–2023 (USD Million)
Table 59 Canada: By Market Size, By Application, 2016–2023 (Ton)
Table 60 Mexico: By Market Size, By Application, 2016–2023 (USD Million)
Table 61 Mexico: By Market Size, By Application, 2016–2023 (Ton)
Table 62 Middle East & Africa: By Market Size, By Type, 2016–2023 (USD Million)
Table 63 Middle East & Africa: By Market Size, By Type, 2016–2023 (Ton)
Table 64 Middle East & Africa: By Market Size, By Application, 2016–2023 (USD Million)
Table 65 Middle East & Africa: By Market Size, By Application, 2016–2023 (Ton)
Table 66 Middle East & Africa: By Market Size, By Country, 2016–2023 (USD Million)
Table 67 Middle East & Africa: By Market Size, By Country, 2016–2023 (Ton)
Table 68 UAE: By Market Size, By Application, 2016–2023 (USD Million)
Table 69 UAE: By Market Size, By Application, 2016–2023 (Ton)
Table 70 Saudi Arabia: By Market Size, By Application, 2016–2023 (USD Million)
Table 71 Saudi Arabia: By Market Size, By Application, 2016–2023 (Ton)
Table 72 South Africa: By Market Size, By Application, 2016–2023 (USD Million)
Table 73 South Africa: By Market Size, By Application, 2016–2023 (Ton)
Table 74 Central & South America: By Market Size, By Type, 2016–2023 (USD Million)
Table 75 Central & South America: By Market Size, By Type, 2016–2023 (Ton)
Table 76 Central & South America: By Market Size, By Application, 2016–2023 (USD Million)
Table 77 Central & South America: By Market Size, By Application, 2016–2023 (Ton)
Table 78 Central & South America: By Market Size, By Country, 2016–2023 (USD Million)
Table 79 Central & South America: By Market Size, By Country, 2016–2023 (Ton)
Table 80 Brazil: By Market Size, By Application, 2016–2023 (USD Million)
Table 81 Brazil: By Market Size, By Application, 2016–2023 (Ton)
Table 82 Argentina: By Market Size, By Application, 2016–2023 (USD Million)
Table 83 Argentina: By Market Size, By Application, 2016–2023 (Ton)
Table 84 Expansion, 2016–2018
Table 85 New Product Launch, 2016–2018
Table 86 Partnership, 2016–2018
Table 87 Acquisition, 2016–2018
List of Figures (33 Figures)
Figure 1 Anti-slip Additives Market Segmentation
Figure 2 Anti-slip Additive Market: Research Design
Figure 3 Market Size Estimation: Bottom-Up Approach
Figure 4 Market Size Estimation: Top-Down Approach
Figure 5 Anti-slip Additives Market: Data Triangulation
Figure 6 Aluminum Oxide to Be the Dominating Type of Anti-Slip Additives
Figure 7 Construction Flooring to Be the Largest Application Segment of the Anti-slip Additives Market
Figure 8 APAC to Register the Highest CAGR in the Anti-slip Additives Market
Figure 9 Long-Term Growth Prospects for the Anti slip Additives Market Between 2018 and 2023
Figure 10 Aluminum Oxide to Be the Key Segment of the Anti slip Additive Market
Figure 11 Aluminum Oxide Accounted for the Largest Market Share
Figure 12 APAC to Be the Fastest-Growing Market
Figure 13 Overview of Factors Governing the Anti-slip Additive Market
Figure 14 Anti slip Additives Market: Porter’s Five Forces Analysis
Figure 15 Global Merchandise Export and Import Statistics, 2017
Figure 16 Aluminum Oxide to Dominate Overall Anti-slip Additives Market
Figure 17 Construction Flooring to Dominate Overall Anti slip Additives Market
Figure 18 APAC Countries Emerging as New Hotspot for the Anti-slip Additives Market
Figure 19 APAC Market Snapshot: China Dominates APAC Anti-slip Additive Market
Figure 20 Expansion Was Most Preferred Growth Strategy Adopted By Major Players Between 2016 and 2018
Figure 21 BYK-Chemie GmbH: Company Snapshot
Figure 22 BYK-Chemie GmbH: SWOT Analysis
Figure 23 PPG Industries, Inc.: Company Snapshot
Figure 24 PPG Industries, Inc.: SWOT Analysis
Figure 25 Hempel A/S: Company Snapshot
Figure 26 Hempel A/S: SWOT Analysis
Figure 27 Rust-Oleum Corporation: Company Snapshot
Figure 28 Vexcon Chemicals: Company Snapshot
Figure 29 Saicos Color GmbH: Company Snapshot
Figure 30 Exterior Performance Coatings, Inc: Company Snapshot
Figure 31 Associated Chemicals: Company Snapshot
Figure 32 Axalta Coating Systems Ltd.: Company Snapshot
Figure 33 Coo-Var: Company Snapshot


Growth opportunities and latent adjacency in Anti-Slip Additives Market