AR VR Software Market

AR VR Software Market by Technology Type (AR Software and VR Software), Software Type (Software Development Kit, Game Engine), Vertical (Media & Entertainment, Retail & eCommerce, Manufacturing, Healthcare) and Region - Global Forecast to 2028

Report Code: TC 8804 Oct, 2023, by marketsandmarkets.com

AR VR Software Market Share, Forecast & Growth Report

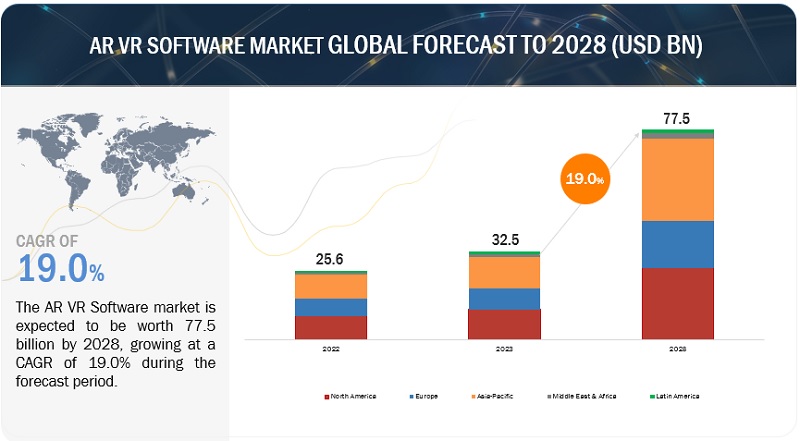
[244 Pages Report] The global AR VR Software Market size worth approximately $32.5 billion in 2023. It is expected to grow at an effective Compound Annual Growth Rate (CAGR) of 19.0% from 2023 to 2028. The revenue forecast for 2028 is anticipated to reach over $77.5 billion. The base year considered for estimation is 2022 and the historical data span ranges from 2023 to 2028.

AR VR Software, In the aviation and aerospace sectors, AR and VR technologies are instrumental for pilot training, aircraft maintenance, and cockpit design. These immersive technologies provide trainee pilots with true-to-life flight simulations, improving their skills and decision-making abilities. Additionally, maintenance procedures are streamlined as technicians can access augmented repair instructions and visualize complex systems in 3D, reducing downtime. Furthermore, AR and VR facilitate cockpit design by allowing engineers to test and refine layouts virtually, optimizing ergonomics and enhancing safety. Consequently, the development of specialized software solutions for these industries is driven by the practicality and efficiency that AR and VR bring to aviation and aerospace operations.
AR VR Software Market Overview

To know about the assumptions considered for the study, Request for Free Sample Report
AR VR Software Market

To know about the assumptions considered for the study, download the pdf brochure

AR VR Software Market Growth Dynamics

Driver:  Growing popularity of gaming

The gaming sector's enthusiasm for immersive experiences, its thirst for authenticity, and its welcoming stance towards innovation are propelling the acceptance of AR/VR software. Gamers, renowned for their early adoption of tech, actively pursue immersive gameplay and inventive features, rendering AR/VR software exceptionally appealing. Leading gaming companies are seamlessly integrating AR/VR software with their existing gaming ecosystems. Furthermore, multiplayer, and social gaming experiences, as well as heightened developer involvement, are flourishing within the AR/VR software realm. Gaming communities magnify the positive impact of AR/VR software, while esports amplify spectator engagement. Collectively, gamers play a pivotal role in expanding the influence of AR/VR software in the realm of entertainment and gaming.

Restraint: Diverse use cases of AR VR in multiple industries

AR/VR software serves as a driving force in various industries, including aviation, healthcare, and military training, by offering realistic simulations for safe skill development. It enables remote collaboration in fields like architecture and engineering, fosters therapy and rehabilitation in healthcare, enhances education through interactive learning experiences, and transforms marketing campaigns by engaging customers with virtual try-ons and product visualizations. In real estate, it facilitates virtual property tours, saving time for both buyers and sellers. Additionally, AR/VR software promotes tourism and cultural preservation by providing immersive virtual tours of historical and cultural sites, thereby driving innovation and growth in the AR/VR industry.

Opportunity: Enhancing remote work and collaboration through AR/VR software

The ascent of remote work and collaboration has propelled AR/VR software into a transformative role in redefining the way teams interact and collaborate. AR/VR-enabled virtual meetings transcend the limitations of traditional video conferencing, allowing colleagues to gather in lifelike virtual environments, fostering a stronger sense of presence and connection. Design collaboration takes on a new dimension, as teams can visualize and interact with 3D models in real time, enhancing creativity and productivity. Moreover, AR/VR facilitates immersive team-building experiences, enabling remote teams to engage in team-building activities and training exercises as if they were physically present, ultimately strengthening bonds and collaboration.

Challenge: Limited amount of content available for AR/VR

Content development is a pivotal challenge in the AR/VR ecosystem due to the relatively limited availability of diverse and compelling experiences. Attracting users and sustaining their interest hinges on having a rich array of content. Insufficient content diversity can deter users from adopting AR/VR technology, as they seek engaging applications and experiences that cater to their diverse preferences. This scarcity necessitates a concerted effort from developers to create innovative, high-quality content across various genres, from gaming and entertainment to education and training, to drive user adoption and establish AR/VR as a mainstream platform.

AR VR Software Market Ecosystem
AR VR Software Market

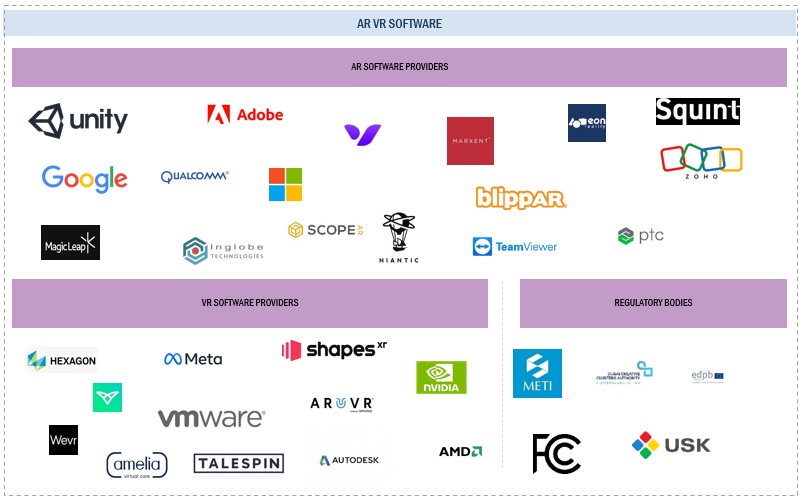
Prominent players in this market include well-established, financially stable AR and VR Software solutions, services providers, and regulatory bodies. These companies have been operating in the market for several years and possess a diversified product portfolio and state-of-the-art technologies. Prominent companies in this market include Microsoft (US), Google (US), and Unity Technologies (US) and so on.

The Media & Entertainment segment to hold the largest market size during the forecast period

Virtual cinemas revolutionize movie-watching by transporting viewers into virtual theaters. Within these immersive environments, users can enjoy films on a virtual big screen, complete with theater ambiance and seating, all from the comfort of their own space. This innovative cinematic experience not only adds novelty to movie consumption but also opens new possibilities for social interactions, allowing friends and family to watch movies together in a shared virtual space, regardless of physical distance. The growth of virtual cinemas propels the advancement of software solutions tailored to this unique form of cinematic entertainment, enriching the overall landscape of modern film experiences.

The VR Software segment is expected to register the second fastest growth rate during the forecast period.

In the real estate sector, VR has ushered in a transformative era by providing virtual property tours, immersive 3D property visualizations, and augmented property information. These innovations have significantly elevated the property marketing and sales landscape, offering prospective buyers an unparalleled opportunity to explore and evaluate properties from the comfort of their own spaces. This immersive experience not only saves time and resources but also enhances decision-making by allowing buyers to interact with properties as if they were physically present. As a result, the adoption of VR software in property marketing and sales has surged, becoming an integral tool for real estate professionals, and redefining the way properties are showcased and sold in the market.

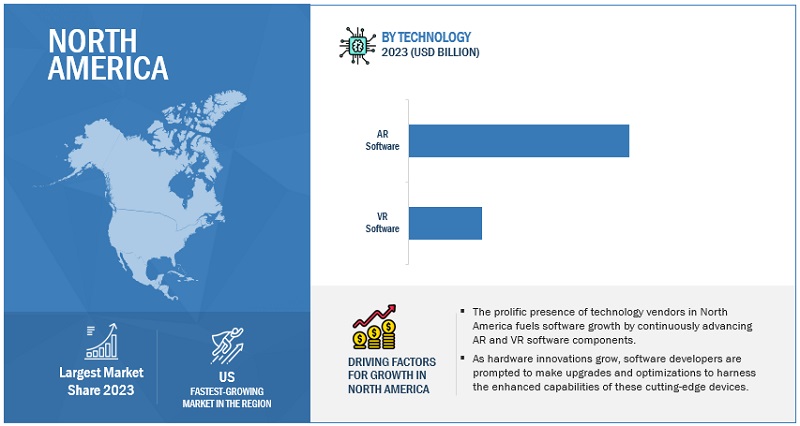
North America is expected to hold the second largest market size during the forecast period

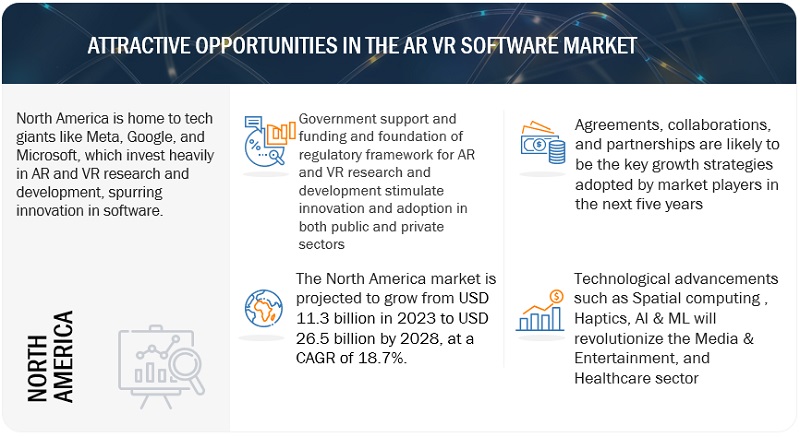
Prominent North American technology giants, such as Meta, Google, and Microsoft, allocate substantial resources to AR and VR research and development initiatives. These investments drive forward groundbreaking innovations in AR and VR software. By pushing the boundaries of what's possible in terms of hardware capabilities, user experiences, and immersive content, these industry leaders set the pace for the entire AR and VR ecosystem. Their contributions range from cutting-edge VR headsets and AR glasses to software development kits (SDKs) that empower developers worldwide to create the next generation of immersive applications and experiences. This commitment to advancing AR and VR technologies continues to shape the industry's trajectory, propelling it into new frontiers of possibility.
AR VR Software Market by Region

AR VR Software Companies:

The major companies in the AR VR Software market are include Microsoft (US), Google (US), Unity Technologies (US), Adobe (US), Autodesk (US), Meta (US), PTC (US), TeamViewer (Germany), NVIDIA Corporation (US), Advanced Micro Devices (US), Qualcomm (US), Zoho Corporation (India), Hexagon AB (Sweden), Magic Leap (US), VMware (US), Blippar (UK), Augment (France), ShapesXR (US), ARuVR (UK), Scope AR (US), Vectary (US), Eon Reality (US), Wevr (US), Talespin Reality Labs (US), Squint (US), Niantic (US), Marxent Labs (US), Inglobe Technologies (Italy), Ultraleap (US), Amelia (US). These players have adopted various growth strategies, such as partnerships, agreements and collaborations, new product launches and enhancements, and acquisitions to expand their AR VR Software market footprint.

Get online access to the report on the World's First Market Intelligence Cloud

  • Easy to Download Historical Data & Forecast Numbers
  • Company Analysis Dashboard for high growth potential opportunities
  • Research Analyst Access for customization & queries
  • Competitor Analysis with Interactive dashboard
  • Latest News, Updates & Trend analysis
Request Sample

Scope of the Report

Report Metrics

Details

Market size available for years

2017-2028

Base year considered

2022

Forecast period

2023–2028

Forecast units

Value (USD) Billion

Segments covered

Technology Type (AR Software and VR Software), Software Type, Vertical, and Region

Region covered

North America, Europe, Asia Pacific, Middle East & Africa, and Latin America.

Companies covered

Microsoft (US), Google (US), Unity Technologies (US), Adobe (US), Autodesk (US), Meta (US), PTC (US), TeamViewer (Germany), NVIDIA Corporation (US), Advanced Micro Devices (US), Qualcomm (US), Zoho Corporation (India), Hexagon AB (Sweden), Magic Leap (US), VMware (US), Blippar (UK), Augment (France), ShapesXR (US), ARuVR (UK), Scope AR (US), Vectary (US), Eon Reality (US), Wevr (US), Talespin Reality Labs (US), Squint (US), Niantic (US), Marxent Labs (US), Inglobe Technologies (Italy), Ultraleap (US), Amelia (US)

This research report categorizes the AR VR Software market to forecast revenues and analyze trends in each of the following submarkets:

Based on Technology Type:
  • AR Software
  • VR Software
Based on Software Type:
  • Software Development Kit
  • Game Engine
  • Modeling & Visualization Software
  • Content Management System
  • Training Simulation Software
  • Other Software (remote collaboration, geospatial mapping, and industrial platforms)
Based on Vertical:
  • Media & Entertainment
  • Retail & E-commerce
  • Training & Education
  • Travel & Hospitality
  • Aerospace & Defense
  • Real Estate
  • Manufacturing
  • Healthcare
  • Aerospace & Defense
  • Automotive
  • Other Verticals (IT & Telecom, Transportation & Logistics, and Energy & Utilities)
By Region:
  • North America
    • United States (US)
    • Canada
  • Europe
    • United Kingdom (UK)
    • Germany
    • France
    • Italy
    • Spain
    • Nordics
    • Rest of Europe
  • Asia Pacific
    • China
    • Japan
    • India
    • South Korea
    • Australia & New Zealand
    • Southeast Asia
    • Rest of Asia Pacific
  • Middle East & Africa
    • Middle East
    • Africa
  • Latin America
    • Brazil
    • Mexico
    • Rest of Latin America

Recent Developments

  • In February 2023, Samsung, Google, and Qualcomm collaborated to deliver a mixed-reality platform. This collaboration will enable the companies to deliver the next-gen technology through cutting-edge advanced hardware and software.
  • In November 2022, Microsoft and Microsoft partnered to integrate Microsoft 365, Teams, Intune, and Azure Active Directory into Meta Quest devices.
  • In March 2022, Autodesk acquired The Wild cloud-connected Metaverse and virtual reality platform technology firm.

Frequently Asked Questions (FAQ):

To speak to our analyst for a discussion on the above findings, click Speak to Analyst

TABLE OF CONTENTS
 
1 INTRODUCTION (Page No. - 26)
    1.1 STUDY OBJECTIVES 
    1.2 MARKET DEFINITION 
    1.3 STUDY SCOPE 
           1.3.1 MARKET SEGMENTATION
                    FIGURE 1 AR VR SOFTWARE MARKET SEGMENTATION
           1.3.2 REGIONS COVERED
           1.3.3 INCLUSIONS AND EXCLUSIONS
           1.3.4 YEARS CONSIDERED
    1.4 CURRENCY CONSIDERED 
           TABLE 1 USD EXCHANGE RATES, 2020–2022
    1.5 STAKEHOLDERS 
    1.6 RECESSION IMPACT 
 
2 RESEARCH METHODOLOGY (Page No. - 30)
    2.1 RESEARCH DATA 
           FIGURE 2 RESEARCH DESIGN
           2.1.1 SECONDARY DATA
                    2.1.1.1 Secondary sources
           2.1.2 PRIMARY DATA
                    2.1.2.1 Primary interviews with experts
                    2.1.2.2 Breakdown of primary profiles
                               FIGURE 3 BREAKDOWN OF PRIMARY INTERVIEWS: BY COMPANY TYPE, DESIGNATION, AND REGION
                    2.1.2.3 Primary sources
                    2.1.2.4 Key insights from industry experts
    2.2 MARKET SIZE ESTIMATION 
           FIGURE 4 MARKET SIZE ESTIMATION METHODOLOGY – APPROACH 1 (SUPPLY SIDE): REVENUE OF OFFERINGS IN AR VR SOFTWARE MARKET
           FIGURE 5 MARKET SIZE ESTIMATION METHODOLOGY – APPROACH 2 (DEMAND SIDE): MARKET
           2.2.1 BOTTOM-UP APPROACH
                    FIGURE 6 BOTTOM-UP APPROACH
                    FIGURE 7 MARKET SIZE ESTIMATION METHODOLOGY USING BOTTOM-UP APPROACH
           2.2.2 TOP-DOWN APPROACH
                    FIGURE 8 TOP-DOWN APPROACH
    2.3 DATA TRIANGULATION 
           FIGURE 9 DATA TRIANGULATION
    2.4 RISK ASSESSMENT 
           TABLE 2 RISK ANALYSIS
    2.5 RESEARCH ASSUMPTIONS 
           TABLE 3 RESEARCH ASSUMPTIONS
    2.6 RESEARCH LIMITATIONS 
    2.7 IMPLICATION OF RECESSION ON AR VR SOFTWARE MARKET 
 
3 EXECUTIVE SUMMARY (Page No. - 41)
    FIGURE 10 MARKET TO WITNESS SIGNIFICANT GROWTH DURING FORECAST PERIOD 
    FIGURE 11 MARKET: REGIONAL SNAPSHOT 
 
4 PREMIUM INSIGHTS (Page No. - 44)
    4.1 ATTRACTIVE OPPORTUNITIES FOR PLAYERS IN AR VR SOFTWARE MARKET 
           FIGURE 12 GOVERNMENT INITIATIVES AND STRONG REGULATORY FRAMEWORK TO DRIVE MARKET
    4.2 MARKET, BY TECHNOLOGY TYPE 
           FIGURE 13 AR SOFTWARE SEGMENT TO REGISTER HIGHER GROWTH RATE DURING FORECAST PERIOD
    4.3 MARKET, BY SOFTWARE TYPE 
           FIGURE 14 SOFTWARE DEVELOPMENT KIT SEGMENT ESTIMATED TO LEAD MARKET IN 2023
    4.4 MARKET, BY VERTICAL 
           FIGURE 15 MEDIA & ENTERTAINMENT SEGMENT TO LEAD MARKET DURING FORECAST PERIOD
    4.5 NORTH AMERICA: MARKET, BY TECHNOLOGY TYPE AND TOP THREE VERTICALS 
           FIGURE 16 AR SOFTWARE AND MEDIA & ENTERTAINMENT SEGMENTS ESTIMATED TO HOLD LARGEST MARKET SHARES IN 2023
 
5 MARKET OVERVIEW AND INDUSTRY TRENDS (Page No. - 47)
    5.1 INTRODUCTION 
    5.2 MARKET DYNAMICS 
           FIGURE 17 AR VR SOFTWARE MARKET: DRIVERS, RESTRAINTS, OPPORTUNITIES, AND CHALLENGES
           5.2.1 DRIVERS
                    5.2.1.1 Growing popularity of gaming
                    5.2.1.2 Diverse use cases of AR/VR across multiple industries
                    5.2.1.3 Advancements in real-time rendering engines
           5.2.2 RESTRAINTS
                    5.2.2.1 Diversity of AR/VR platforms and complex development landscape
                    5.2.2.2 High initial costs and limited hardware options
           5.2.3 OPPORTUNITIES
                    5.2.3.1 Increase in remote working and collaboration through AR/VR software
                    5.2.3.2 Increasing role of AR/VR software in healthcare transformation
           5.2.4 CHALLENGES
                    5.2.4.1 Requirement for optimized performance in AR/VR
                    5.2.4.2 Limited availability of content for AR/VR
    5.3 INDUSTRY TRENDS 
           5.3.1 BRIEF HISTORY OF AR/VR SOFTWARE
                    FIGURE 18 BRIEF HISTORY OF AR/VR SOFTWARE
                    5.3.1.1 1950–1970
                    5.3.1.2 1970–2000
                    5.3.1.3 2000–2010
                    5.3.1.4 2011–2023
           5.3.2 CASE STUDY ANALYSIS
                    5.3.2.1 Case study 1: Magna supercharges its quality control and training processes with AR
                    5.3.2.2 Case study 2: STERIS helps customers reduce critical mistakes with AR
                    5.3.2.3 Case study 3: Revolutionizing technical training in VR
                    5.3.2.4 Case study 4: Streamlining enterprise VR training development
           5.3.3 ECOSYSTEM ANALYSIS
                    FIGURE 19 AR VR SOFTWARE MARKET ECOSYSTEM MAPPING
                    TABLE 4 MARKET: ECOSYSTEM
                    5.3.3.1 AR software providers
                    5.3.3.2 VR software providers
           5.3.4 VALUE CHAIN ANALYSIS
                    FIGURE 20 MARKET: VALUE CHAIN ANALYSIS
           5.3.5 REGULATORY LANDSCAPE
                    5.3.5.1 REGULATORY BODIES, GOVERNMENT AGENCIES, AND OTHER ORGANIZATIONS
                               TABLE 5 NORTH AMERICA: REGULATORY BODIES, GOVERNMENT AGENCIES, AND OTHER ORGANIZATIONS
                               TABLE 6 EUROPE: REGULATORY BODIES, GOVERNMENT AGENCIES, AND OTHER ORGANIZATIONS
                               TABLE 7 ASIA PACIFIC: LIST OF REGULATORY BODIES, GOVERNMENT AGENCIES, AND OTHER ORGANIZATIONS
                               TABLE 8 REST OF THE WORLD: REGULATORY BODIES, GOVERNMENT AGENCIES, AND OTHER ORGANIZATIONS
                    5.3.5.2 North America
                               5.3.5.2.1 US
                               5.3.5.2.2 Canada
                    5.3.5.3 Europe
                               5.3.5.3.1 UK
                               5.3.5.3.2 Germany
                    5.3.5.4 Asia Pacific
                               5.3.5.4.1 China
                               5.3.5.4.2 India
                               5.3.5.4.3 Japan
                    5.3.5.5 Middle East & Africa
                               5.3.5.5.1 UAE
                               5.3.5.5.2 South Africa
                    5.3.5.6 Latin America
                               5.3.5.6.1 Brazil
           5.3.6 PRICING ANALYSIS
                    5.3.6.1 Average selling price trend of key players, by VR software
                               TABLE 9 AVERAGE SELLING PRICE OF KEY PLAYERS, BY VR SOFTWARE (USD)
                    5.3.6.2 Indicative pricing analysis of key players, by AR software
                               TABLE 10 INDICATIVE PRICING ANALYSIS, BY AR SOFTWARE (USD)
           5.3.7 TECHNOLOGY ANALYSIS
                    5.3.7.1 Key technologies
                               5.3.7.1.1 3D modeling and rendering
                               5.3.7.1.2 Simulations and physics engine
                               5.3.7.1.3 Augmented reality cloud
                    5.3.7.2 Complementary technologies
                               5.3.7.2.1 Artificial intelligence & machine learning (AI & ML)
                               5.3.7.2.2 5G connectivity
                               5.3.7.2.3 Haptics
                               5.3.7.2.4 Spatial computing
                    5.3.7.3 Adjacent technologies
                               5.3.7.3.1 Blockchain
                               5.3.7.3.2 Wearable technology
                               5.3.7.3.3 IoT
           5.3.8 PATENT ANALYSIS
                    5.3.8.1 Methodology
                    5.3.8.2 Types of patents
                               TABLE 11 PATENTS FILED, 2021–2023
                    5.3.8.3 Innovations and patent applications
                               FIGURE 21 NUMBER OF PATENTS GRANTED ANNUALLY, 2021–2023
                               5.3.8.3.1 Top applicants
                               FIGURE 22 TOP 10 PATENT APPLICANTS WITH HIGHEST NUMBER OF PATENT APPLICATIONS, 2021–2023
                               TABLE 12 PATENTS GRANTED IN AR VR SOFTWARE MARKET, 2021–2023
           5.3.9 KEY STAKEHOLDERS AND BUYING CRITERIA
                    5.3.9.1 Key stakeholders in buying process
                               FIGURE 23 INFLUENCE OF STAKEHOLDERS ON BUYING PROCESS FOR TOP 3 VERTICALS
                               TABLE 13 INFLUENCE OF STAKEHOLDERS ON BUYING PROCESS FOR TOP 3 VERTICALS (%)
                    5.3.9.2 Buying criteria
                               FIGURE 24 KEY BUYING CRITERIA FOR TOP 3 VERTICALS
                               TABLE 14 KEY BUYING CRITERIA FOR TOP 3 VERTICALS
           5.3.10 KEY CONFERENCES AND EVENTS, 2023–2024
                    TABLE 15 DETAILED LIST OF CONFERENCES AND EVENTS, 2023–2024
           5.3.11 PORTER’S FIVE FORCES ANALYSIS
                    TABLE 16 MARKET: PORTER’S FIVE FORCES ANALYSIS
                    5.3.11.1 Threat of new entrants
                    5.3.11.2 Threat of substitutes
                    5.3.11.3 Bargaining power of buyers
                    5.3.11.4 Bargaining power of suppliers
                    5.3.11.5 Intensity of competitive rivalry
           5.3.12 TRENDS AND DISRUPTIONS IMPACTING CUSTOMER BUSINESS
                    FIGURE 25 TRENDS AND DISRUPTIONS IMPACTING CUSTOMER BUSINESS
           5.3.13 BEST PRACTICES OF AR VR SOFTWARE MARKET
                    5.3.13.1 User-centered design
                    5.3.13.2 Cross-platform compatibility
                    5.3.13.3 Interactivity and immersion
                    5.3.13.4 Accessibility
                    5.3.13.5 Content creation
           5.3.14 CURRENT AND EMERGING BUSINESS MODELS
                    5.3.14.1 Subscription services model
                    5.3.14.2 Freemium
                    5.3.14.3 Pay-per-use or pay-per-session
                    5.3.14.4 Enterprise licensing
                    5.3.14.5 Content marketplace
           5.3.15 AR VR SOFTWARE TOOLS, FRAMEWORKS, AND TECHNIQUES
                    5.3.15.1 AR VR software tools
                               5.3.15.1.1 Content creation tools
                               5.3.15.1.2 Development platforms
                               5.3.15.1.3 Visualization and simulation software
                    5.3.15.2 AR VR software frameworks
                               5.3.15.2.1 OpenXR
                               5.3.15.2.2 WebXR
                    5.3.15.3 AR VR software techniques
                               5.3.15.3.1 3D modeling and texturing
                               5.3.15.3.2 User interface design
                               5.3.15.3.3 Simultaneous localization and mapping
                               5.3.15.3.4 Rendering
                               5.3.15.3.5 Tracking
                               5.3.15.3.6 Computer vision
           5.3.16 FUTURE LANDSCAPE OF AR VR SOFTWARE MARKET
                    5.3.16.1 AR VR software technology roadmap till 2030
                               5.3.16.1.1 Short-term roadmap (2023–2025)
                               5.3.16.1.2 Mid-term roadmap (2026–2028)
                               5.3.16.1.3 Long-term roadmap (2029–2030)
 
6 AR VR SOFTWARE MARKET, BY TECHNOLOGY TYPE (Page No. - 74)
    6.1 INTRODUCTION 
           FIGURE 26 AR VR SOFTWARE SEGMENT TO REGISTER HIGHER CAGR DURING FORECAST PERIOD
           6.1.1 TECHNOLOGY TYPE: MARKET DRIVERS
                    TABLE 17 MARKET, BY TECHNOLOGY TYPE, 2017–2022 (USD MILLION)
                    TABLE 18 MARKET, BY TECHNOLOGY TYPE, 2023–2028 (USD MILLION)
    6.2 AR SOFTWARE 
           6.2.1 ENHANCES REAL-WORLD EXPERIENCES BY ADDING LAYERS OF IMMERSION AND INTERACTION USING AR
                    TABLE 19 AR SOFTWARE: MARKET, BY REGION, 2017–2022 (USD MILLION)
                    TABLE 20 AR SOFTWARE: MARKET, BY REGION, 2023–2028 (USD MILLION)
           6.2.2 MARKER-BASED AR TECHNOLOGY
           6.2.3 MARKERLESS AR TECHNOLOGY
    6.3 VR SOFTWARE 
           6.3.1 CRAFTS HYPER-REALISTIC WORLDS FOR UNPARALLELED IMMERSIVE EXPLORATION AND INNOVATION
                    TABLE 21 VR SOFTWARE: MARKET, BY REGION, 2017–2022 (USD MILLION)
                    TABLE 22 VR SOFTWARE: MARKET, BY REGION, 2023–2028 (USD MILLION)
 
7 AR VR SOFTWARE MARKET, BY SOFTWARE TYPE (Page No. - 79)
    7.1 INTRODUCTION 
           FIGURE 27 TRAINING SIMULATION SOFTWARE SEGMENT TO REGISTER HIGHEST CAGR DURING FORECAST PERIOD
           7.1.1 SOFTWARE TYPE: MARKET DRIVERS
                    TABLE 23 MARKET, BY SOFTWARE TYPE, 2017–2022 (USD MILLION)
                    TABLE 24 MARKET, BY SOFTWARE TYPE, 2023–2028 (USD MILLION)
    7.2 SOFTWARE DEVELOPMENT KIT (SDK) 
           7.2.1 TOOLS AND KITS TO ENGINEER MORE AR/VR EXPERIENCES AND APPLICATIONS
                    TABLE 25 SOFTWARE DEVELOPMENT KIT: MARKET, BY REGION, 2017–2022 (USD MILLION)
                    TABLE 26 SOFTWARE DEVELOPMENT KIT: MARKET, BY REGION, 2023–2028 (USD MILLION)
    7.3 GAME ENGINE 
           7.3.1 BUILDS VIRTUAL WORLDS AND IMMERSIVE GAMING ADVENTURES
                    TABLE 27 GAME ENGINE: AR VR SOFTWARE MARKET, BY REGION, 2017–2022 (USD MILLION)
                    TABLE 28 GAME ENGINE: MARKET, BY REGION, 2023–2028 (USD MILLION)
    7.4 MODELING & VISUALIZATION SOFTWARE 
           7.4.1 HELPS DESIGN INTERACTIVE VISUAL EXPERIENCES WITH EXTREME PRECISION AND DETAIL
                    TABLE 29 MODELING & VISUALIZATION SOFTWARE: MARKET, BY REGION, 2017–2022 (USD MILLION)
                    TABLE 30 MODELING & VISUALIZATION SOFTWARE: MARKET, BY REGION, 2023–2028 (USD MILLION)
    7.5 CONTENT MANAGEMENT SYSTEM 
           7.5.1 MANAGES AR AND VR MULTIMEDIA CONTENT ACROSS MULTIPLE PLATFORMS
                    TABLE 31 CONTENT MANAGEMENT SYSTEM: MARKET, BY REGION, 2017–2022 (USD MILLION)
                    TABLE 32 CONTENT MANAGEMENT SYSTEM: MARKET, BY REGION, 2023–2028 (USD MILLION)
    7.6 TRAINING SIMULATION SOFTWARE 
           7.6.1 SIMULATES REALISTIC TRAINING MODULES TO SAVE TIME AND COST
                    TABLE 33 TRAINING SIMULATION SOFTWARE: MARKET, BY REGION, 2017–2022 (USD MILLION)
                    TABLE 34 TRAINING SIMULATION SOFTWARE: MARKET, BY REGION, 2023–2028 (USD MILLION)
    7.7 OTHER SOFTWARE 
           TABLE 35 OTHER SOFTWARE: MARKET, BY REGION, 2017–2022 (USD MILLION)
           TABLE 36 OTHER SOFTWARE: MARKET, BY REGION, 2023–2028 (USD MILLION)
 
8 AR VR SOFTWARE MARKET, BY VERTICAL (Page No. - 88)
    8.1 INTRODUCTION 
           FIGURE 28 TRAVEL & HOSPITALITY SEGMENT TO REGISTER HIGHEST CAGR DURING FORECAST PERIOD
           8.1.1 VERTICAL: MARKET DRIVERS
                    TABLE 37 MARKET, BY VERTICAL, 2017–2022 (USD MILLION)
                    TABLE 38 MARKET, BY VERTICAL, 2023–2028 (USD MILLION)
    8.2 MEDIA & ENTERTAINMENT 
           8.2.1 INCREASING POPULARITY OF AR/VR-BASED GAMING TO DRIVE MARKET
           8.2.2 USE CASES
                    8.2.2.1 Immersive gaming experiences
                    8.2.2.2 Enhanced sports viewing
                               TABLE 39 MEDIA & ENTERTAINMENT: MARKET, BY REGION, 2017–2022 (USD MILLION)
                               TABLE 40 MEDIA & ENTERTAINMENT: MARKET, BY REGION, 2023–2028 (USD MILLION)
    8.3 RETAIL & ECOMMERCE 
           8.3.1 RESHAPING VIRTUAL SHOPPING EXPERIENCES WITH AR AND VR
           8.3.2 USE CASE
                    8.3.2.1 Virtual try-on
                    8.3.2.2 Furniture and decor visualization
                               TABLE 41 RETAIL & ECOMMERCE: AR VR SOFTWARE MARKET, BY REGION, 2017–2022 (USD MILLION)
                               TABLE 42 RETAIL & ECOMMERCE: MARKET, BY REGION, 2023–2028 (USD MILLION)
    8.4 TRAINING & EDUCATION 
           8.4.1 ELEVATING EDUCATION THROUGH IMMERSIVE TRAINING EXPERIENCES
           8.4.2 USE CASES
                    8.4.2.1 Employee training
                    8.4.2.2 Historical reconstruction
                               TABLE 43 TRAINING & EDUCATION: MARKET, BY REGION, 2017–2022 (USD MILLION)
                               TABLE 44 TRAINING & EDUCATION: MARKET, BY REGION, 2023–2028 (USD MILLION)
    8.5 TRAVEL & HOSPITALITY 
           8.5.1 AR AND VR TECHNOLOGIES HELP TRAVELERS RESEARCH, PLAN, AND EXPERIENCE JOURNEYS
           8.5.2 USE CASE
                    8.5.2.1 Virtual destination tours
                    8.5.2.2 Language translation and navigation
                               TABLE 45 TRAVEL & HOSPITALITY: AR VR SOFTWARE MARKET, BY REGION, 2017–2022 (USD MILLION)
                               TABLE 46 TRAVEL & HOSPITALITY: MARKET, BY REGION, 2023–2028 (USD MILLION)
    8.6 REAL ESTATE 
           8.6.1 AR-BASED INSIGHTS AND PROPERTY TOURS
           8.6.2 USE CASE
                    8.6.2.1 Interactive 3D floor plans
                    8.6.2.2 Architectural visualization
                               TABLE 47 REAL ESTATE: MARKET, BY REGION, 2017–2022 (USD MILLION)
                               TABLE 48 REAL ESTATE: MARKET, BY REGION, 2023–2028 (USD MILLION)
    8.7 MANUFACTURING 
           8.7.1 AR AND VR ASSIST IN MANUFACTURING TO MAINTAIN RISK-FREE ENVIRONMENTS
           8.7.2 USE CASE
                    8.7.2.1 Design and prototyping
                    8.7.2.2 Quality control
                               TABLE 49 MANUFACTURING: AR VR SOFTWARE MARKET, BY REGION, 2017–2022 (USD MILLION)
                               TABLE 50 MANUFACTURING: MARKET, BY REGION, 2023–2028 (USD MILLION)
    8.8 HEALTHCARE 
           8.8.1 AR AND VR TECHNOLOGIES ENHANCE PATIENT CARE, MEDICAL TRAINING, AND THERAPEUTIC INTERVENTIONS
           8.8.2 USE CASE
                    8.8.2.1 Phobia and PTSD treatment
                    8.8.2.2 Surgical planning
                               TABLE 51 HEALTHCARE: MARKET, BY REGION, 2017–2022 (USD MILLION)
                               TABLE 52 HEALTHCARE: MARKET, BY REGION, 2023–2028 (USD MILLION)
    8.9 AEROSPACE & DEFENSE 
           8.9.1 IMPROVING SITUATIONAL AWARENESS AND PLANNING EFFECTIVE RESPONSE WITH AR AND VR-BASED SIMULATION
           8.9.2 USE CASE
                    8.9.2.1 Flight simulation and training
                    8.9.2.2 Military training simulation
                               TABLE 53 AEROSPACE & DEFENSE: AR VR SOFTWARE MARKET, BY REGION, 2017–2022 (USD MILLION)
                               TABLE 54 AEROSPACE & DEFENSE: MARKET, BY REGION, 2023–2028 (USD MILLION)
    8.10 AUTOMOTIVE 
           8.10.1 AR AND VR TECHNOLOGIES ENHANCE PROTOTYPING PROCESSES BY BUILDING MORE INTERACTIVE 3D MODELS
           8.10.2 USE CASE
                    8.10.2.1 Vehicle customization
                    8.10.2.2 Autonomous vehicle development
                               TABLE 55 AUTOMOTIVE: MARKET, BY REGION, 2017–2022 (USD MILLION)
                               TABLE 56 AUTOMOTIVE: MARKET, BY REGION, 2023–2028 (USD MILLION)
    8.11 OTHER VERTICALS 
           8.11.1 USE CASE
                    8.11.1.1 Remote technical support
                    8.11.1.2 Inventory management
                    8.11.1.3 Infrastructure design
                               TABLE 57 OTHER VERTICALS: MARKET, BY REGION, 2017–2022 (USD MILLION)
                               TABLE 58 OTHER VERTICALS: MARKET, BY REGION, 2023–2028 (USD MILLION)
 
9 AR VR SOFTWARE MARKET, BY REGION (Page No. - 105)
    9.1 INTRODUCTION 
           TABLE 59 MARKET, BY REGION, 2017–2022 (USD MILLION)
           TABLE 60 MARKET, BY REGION, 2023–2028 (USD MILLION)
    9.2 NORTH AMERICA 
           9.2.1 NORTH AMERICA: MARKET DRIVERS
           9.2.2 NORTH AMERICA: RECESSION IMPACT
                    FIGURE 29 NORTH AMERICA: MARKET SNAPSHOT
                    TABLE 61 NORTH AMERICA: AR VR SOFTWARE MARKET, BY COUNTRY, 2017–2022 (USD MILLION)
                    TABLE 62 NORTH AMERICA: MARKET, BY COUNTRY, 2023–2028 (USD MILLION)
                    TABLE 63 NORTH AMERICA: MARKET, BY TECHNOLOGY TYPE, 2017–2022 (USD MILLION)
                    TABLE 64 NORTH AMERICA: MARKET, BY TECHNOLOGY TYPE, 2023–2028 (USD MILLION)
                    TABLE 65 NORTH AMERICA: MARKET, BY SOFTWARE TYPE, 2017–2022 (USD MILLION)
                    TABLE 66 NORTH AMERICA: MARKET, BY SOFTWARE TYPE, 2023–2028 (USD MILLION)
                    TABLE 67 NORTH AMERICA: MARKET, BY VERTICAL, 2017–2022 (USD MILLION)
                    TABLE 68 NORTH AMERICA: MARKET, BY VERTICAL, 2023–2028 (USD MILLION)
           9.2.3 US
                    9.2.3.1 Extensive research in AR and VR to drive market
                               TABLE 69 US: AR VR SOFTWARE MARKET, BY TECHNOLOGY TYPE, 2017–2022 (USD MILLION)
                               TABLE 70 US: MARKET, BY TECHNOLOGY TYPE, 2023–2028 (USD MILLION)
                               TABLE 71 US: MARKET, BY SOFTWARE TYPE, 2017–2022 (USD MILLION)
                               TABLE 72 US: MARKET, BY SOFTWARE TYPE, 2023–2028 (USD MILLION)
                               TABLE 73 US: MARKET, BY VERTICAL, 2017–2022 (USD MILLION)
                               TABLE 74 US: MARKET, BY VERTICAL, 2023–2028 (USD MILLION)
           9.2.4 CANADA
                    9.2.4.1 Rising implementation of AR/VR software by enterprises to drive market
                               TABLE 75 CANADA: AR VR SOFTWARE MARKET, BY TECHNOLOGY TYPE, 2017–2022 (USD MILLION)
                               TABLE 76 CANADA: MARKET, BY TECHNOLOGY TYPE, 2023–2028 (USD MILLION)
                               TABLE 77 CANADA: MARKET, BY SOFTWARE TYPE, 2017–2022 (USD MILLION)
                               TABLE 78 CANADA MARKET, BY SOFTWARE TYPE, 2023–2028 (USD MILLION)
                               TABLE 79 CANADA: MARKET, BY VERTICAL, 2017–2022 (USD MILLION)
                               TABLE 80 CANADA: MARKET, BY VERTICAL, 2023–2028 (USD MILLION)
    9.3 EUROPE 
           9.3.1 EUROPE: MARKET DRIVERS
           9.3.2 EUROPE: RECESSION IMPACT
                    TABLE 81 EUROPE: AR VR SOFTWARE MARKET, BY COUNTRY, 2017–2022 (USD MILLION)
                    TABLE 82 EUROPE: MARKET, BY COUNTRY, 2023–2028 (USD MILLION)
                    TABLE 83 EUROPE: MARKET, BY TECHNOLOGY TYPE, 2017–2022 (USD MILLION)
                    TABLE 84 EUROPE: MARKET, BY TECHNOLOGY TYPE, 2023–2028 (USD MILLION)
                    TABLE 85 EUROPE: MARKET, BY SOFTWARE TYPE, 2017–2022 (USD MILLION)
                    TABLE 86 EUROPE: MARKET, BY SOFTWARE TYPE, 2023–2028 (USD MILLION)
                    TABLE 87 EUROPE: MARKET, BY VERTICAL, 2017–2022 (USD MILLION)
                    TABLE 88 EUROPE: MARKET, BY VERTICAL, 2023–2028 (USD MILLION)
           9.3.3 UK
                    9.3.3.1 Funding initiatives, grants, and tax incentives for tech companies to drive market
                               TABLE 89 UK: AR VR SOFTWARE MARKET, BY TECHNOLOGY TYPE, 2017–2022 (USD MILLION)
                               TABLE 90 UK: MARKET, BY TECHNOLOGY TYPE, 2023–2028 (USD MILLION)
                               TABLE 91 UK: MARKET, BY SOFTWARE TYPE, 2017–2022 (USD MILLION)
                               TABLE 92 UK: MARKET, BY SOFTWARE TYPE, 2023–2028 (USD MILLION)
                               TABLE 93 UK: MARKET, BY VERTICAL, 2017–2022 (USD MILLION)
                               TABLE 94 UK: MARKET, BY VERTICAL, 2023–2028 (USD MILLION)
           9.3.4 GERMANY
                    9.3.4.1 Focus on integrating AR and VR within industries and film making to drive market
           9.3.5 FRANCE
                    9.3.5.1 Favorable government policies and rising adoption of immersive technologies in automobile and fashion industries to drive market
           9.3.6 ITALY
                    9.3.6.1 Increasing demand for AR/VR-based tourism to drive market
           9.3.7 SPAIN
                    9.3.7.1 Increasing use of AR/VR in building interactive and engaging infrastructure to drive market
           9.3.8 NORDICS
                    9.3.8.1 Tech-savvy population and robust investment in technology companies to drive market
           9.3.9 REST OF EUROPE
    9.4 ASIA PACIFIC 
           9.4.1 ASIA PACIFIC: MARKET DRIVERS
           9.4.2 ASIA PACIFIC: RECESSION IMPACT
                    FIGURE 30 ASIA PACIFIC: AR VR SOFTWARE MARKET SNAPSHOT
                    TABLE 95 ASIA PACIFIC: MARKET, BY COUNTRY, 2017–2022 (USD MILLION)
                    TABLE 96 ASIA PACIFIC: MARKET, BY COUNTRY, 2023–2028 (USD MILLION)
                    TABLE 97 ASIA PACIFIC: MARKET, BY TECHNOLOGY TYPE, 2017–2022 (USD MILLION)
                    TABLE 98 ASIA PACIFIC: MARKET, BY TECHNOLOGY TYPE, 2023–2028 (USD MILLION)
                    TABLE 99 ASIA PACIFIC: MARKET, BY SOFTWARE TYPE, 2017–2022 (USD MILLION)
                    TABLE 100 ASIA PACIFIC: MARKET, BY SOFTWARE TYPE, 2023–2028 (USD MILLION)
                    TABLE 101 ASIA PACIFIC: MARKET, BY VERTICAL, 2017–2022 (USD MILLION)
                    TABLE 102 ASIA PACIFIC: MARKET, BY VERTICAL, 2023–2028 (USD MILLION)
           9.4.3 CHINA
                    9.4.3.1 Robust tech ecosystem to drive market
                               TABLE 103 CHINA: AR VR SOFTWARE MARKET, BY TECHNOLOGY TYPE, 2017–2022 (USD MILLION)
                               TABLE 104 CHINA: MARKET, BY TECHNOLOGY TYPE, 2023–2028 (USD MILLION)
                               TABLE 105 CHINA: MARKET, BY SOFTWARE TYPE, 2017–2022 (USD MILLION)
                               TABLE 106 CHINA: MARKET, BY SOFTWARE TYPE, 2023–2028 (USD MILLION)
                               TABLE 107 CHINA: MARKET, BY VERTICAL, 2017–2022 (USD MILLION)
                               TABLE 108 CHINA: MARKET, BY VERTICAL, 2023–2028 (USD MILLION)
           9.4.4 INDIA
                    9.4.4.1 Investments, partnerships, and government support to drive market
           9.4.5 JAPAN
                    9.4.5.1 Introduction of AR and VR-friendly policies and regulations to drive market
           9.4.6 AUSTRALIA & NEW ZEALAND
                    9.4.6.1 Increasing application of AR and VR in defense and farming to drive market
           9.4.7 SOUTH KOREA
                    9.4.7.1 Thriving gaming ecosystem to drive market
           9.4.8 SOUTHEAST ASIA
                    9.4.8.1 Increasing adoption of AR and VR in tourism to drive market
           9.4.9 REST OF ASIA PACIFIC
    9.5 MIDDLE EAST & AFRICA 
           9.5.1 MIDDLE EAST & AFRICA: MARKET DRIVERS
           9.5.2 MIDDLE EAST & AFRICA: RECESSION IMPACT
                               TABLE 109 MIDDLE EAST & AFRICA: AR VR SOFTWARE MARKET, BY REGION, 2017–2022 (USD MILLION)
                               TABLE 110 MIDDLE EAST & AFRICA: MARKET, BY REGION, 2023–2028 (USD MILLION)
                               TABLE 111 MIDDLE EAST & AFRICA: MARKET, BY TECHNOLOGY TYPE, 2017–2022 (USD MILLION)
                               TABLE 112 MIDDLE EAST & AFRICA: MARKET, BY TECHNOLOGY TYPE, 2023–2028 (USD MILLION)
                               TABLE 113 MIDDLE EAST & AFRICA: MARKET, BY SOFTWARE TYPE, 2017–2022 (USD MILLION)
                               TABLE 114 MIDDLE EAST & AFRICA: MARKET, BY SOFTWARE TYPE, 2023–2028 (USD MILLION)
                               TABLE 115 MIDDLE EAST & AFRICA: MARKET, BY VERTICAL, 2017–2022 (USD MILLION)
                               TABLE 116 MIDDLE EAST & AFRICA: MARKET, BY VERTICAL, 2023–2028 (USD MILLION)
           9.5.3 MIDDLE EAST
                    9.5.3.1 Growing adoption of AR VR technologies to enhance healthcare and tourism to drive market
                               TABLE 117 MIDDLE EAST: AR VR SOFTWARE MARKET, BY TECHNOLOGY TYPE, 2017–2022 (USD MILLION)
                               TABLE 118 MIDDLE EAST: MARKET, BY TECHNOLOGY TYPE, 2023–2028 (USD MILLION)
                               TABLE 119 MIDDLE EAST: MARKET, BY SOFTWARE TYPE, 2017–2022 (USD MILLION)
                               TABLE 120 MIDDLE EAST: MARKET, BY SOFTWARE TYPE, 2023–2028 (USD MILLION)
                               TABLE 121 MIDDLE EAST: MARKET, BY VERTICAL, 2017–2022 (USD MILLION)
                               TABLE 122 MIDDLE EAST: MARKET, BY VERTICAL, 2023–2028 (USD MILLION)
           9.5.4 AFRICA
                    9.5.4.1 Strong initiatives from governments and companies to drive market
    9.6 LATIN AMERICA 
           9.6.1 LATIN AMERICA: MARKET DRIVERS
           9.6.2 LATIN AMERICA: RECESSION IMPACT
                    TABLE 123 LATIN AMERICA: AR VR SOFTWARE MARKET, BY COUNTRY, 2017–2022 (USD MILLION)
                    TABLE 124 LATIN AMERICA: MARKET, BY COUNTRY, 2023–2028 (USD MILLION)
                    TABLE 125 LATIN AMERICA: MARKET, BY TECHNOLOGY TYPE, 2017–2022 (USD MILLION)
                    TABLE 126 LATIN AMERICA: MARKET, BY TECHNOLOGY TYPE, 2023–2028 (USD MILLION)
                    TABLE 127 LATIN AMERICA: MARKET, BY SOFTWARE TYPE, 2017–2022 (USD MILLION)
                    TABLE 128 LATIN AMERICA: MARKET, BY SOFTWARE TYPE, 2023–2028 (USD MILLION)
                    TABLE 129 LATIN AMERICA: MARKET, BY VERTICAL, 2017–2022 (USD MILLION)
                    TABLE 130 LATIN AMERICA: MARKET, BY VERTICAL, 2023–2028 (USD MILLION)
           9.6.3 BRAZIL
                    9.6.3.1 Increasing adoption of AR/VR in education and healthcare to drive market
                               TABLE 131 BRAZIL: AR VR SOFTWARE MARKET, BY TECHNOLOGY TYPE, 2017–2022 (USD MILLION)
                               TABLE 132 BRAZIL: MARKET, BY TECHNOLOGY TYPE, 2023–2028 (USD MILLION)
                               TABLE 133 BRAZIL: MARKET, BY SOFTWARE TYPE, 2017–2022 (USD MILLION)
                               TABLE 134 BRAZIL: MARKET, BY SOFTWARE TYPE, 2023–2028 (USD MILLION)
                               TABLE 135 BRAZIL: MARKET, BY VERTICAL, 2017–2022 (USD MILLION)
                               TABLE 136 BRAZIL: MARKET, BY VERTICAL, 2023–2028 (USD MILLION)
                               9.6.4 MEXICO
                    9.6.4.1 Government initiatives and adoption of AR/VR across diverse sectors to drive market
           9.6.5 REST OF LATIN AMERICA
 
10 COMPETITIVE LANDSCAPE (Page No. - 149)
     10.1 INTRODUCTION 
     10.2 STRATEGIES ADOPTED BY KEY PLAYERS 
               TABLE 137 OVERVIEW OF STRATEGIES ADOPTED BY KEY PLAYERS
     10.3 HISTORICAL REVENUE ANALYSIS 
               FIGURE 31 HISTORICAL REVENUE ANALYSIS OF KEY PLAYERS, 2020–2022 (USD MILLION)
     10.4 MARKET SHARE ANALYSIS OF KEY PLAYERS 
               TABLE 138 MARKET: DEGREE OF COMPETITION
     10.5 COMPANY EVALUATION MATRIX 
             10.5.1 STARS
             10.5.2 EMERGING LEADERS
             10.5.3 PERVASIVE PLAYERS
             10.5.4 PARTICIPANTS
                       FIGURE 32 MARKET: COMPANY EVALUATION MATRIX, 2023
             10.5.5 COMPANY FOOTPRINT
                       TABLE 139 COMPANY FOOTPRINT
                       TABLE 140 TECHNOLOGY FOOTPRINT
                       TABLE 141 SOFTWARE FOOTPRINT
                       TABLE 142 REGIONAL FOOTPRINT
     10.6 STARTUP/SME EVALUATION MATRIX 
             10.6.1 PROGRESSIVE COMPANIES
             10.6.2 RESPONSIVE COMPANIES
             10.6.3 DYNAMIC COMPANIES
             10.6.4 STARTING BLOCKS
                       FIGURE 33 AR VR SOFTWARE MARKET: STARTUP/SME EVALUATION MATRIX, 2023
             10.6.5 COMPETITIVE BENCHMARKING
                       TABLE 143 DETAILED LIST OF STARTUPS/SMES
                       TABLE 144 COMPETITIVE BENCHMARKING OF STARTUPS/SMES
                       TABLE 145 COMPETITIVE BENCHMARKING OF KEY PLAYERS
     10.7 COMPETITIVE SCENARIO AND TRENDS 
             10.7.1 PRODUCT LAUNCHES
                       TABLE 146 MARKET: PRODUCT LAUNCHES, JANUARY 2021–SEPTEMBER 2023
             10.7.2 DEALS
                       TABLE 147 MARKET: DEALS, JANUARY 2021–SEPTEMBER 2023
             10.7.3 OTHERS
                       TABLE 148 AR VR SOFTWARE MARKET: OTHERS
     10.8 AR VR PRODUCT BENCHMARKING 
             10.8.1 PROMINENT AR SOFTWARE SOLUTIONS
                       TABLE 149 COMPARATIVE ANALYSIS OF PROMINENT AR SOFTWARE
                       10.8.1.1 Unity AR Engine
                       10.8.1.2 Microsoft Mesh
                       10.8.1.3 ARCore
                       10.8.1.4 Frontline AR
                       10.8.1.5 Zoho Corporation Lens
             10.8.2 PROMINENT VR SOFTWARE SOLUTIONS
                       TABLE 150 COMPARATIVE ANALYSIS OF PROMINENT VR SOFTWARE
                       10.8.2.1 Unity VR tools
                       10.8.2.2 Oculus Platform SDK
                       10.8.2.3 NVIDIA Corporation Omniverse
                       10.8.2.4 myVR Software
                       10.8.2.5 Wevr Virtual Studio
     10.9 VALUATION AND FINANCIAL METRICS OF KEY AR VR SOFTWARE VENDORS 
               FIGURE 34 VALUATION AND FINANCIAL METRICS OF KEY AR VR SOFTWARE VENDORS
 
11 COMPANY PROFILES (Page No. - 167)
     11.1 KEY PLAYERS 
(Business Overview, Products/Solutions/Services offered, Recent Developments, MnM View)*
             11.1.1 META
                       TABLE 151 META: COMPANY OVERVIEW
                       FIGURE 35 META: COMPANY SNAPSHOT
                       TABLE 152 META: PRODUCTS/SOLUTIONS/SERVICES OFFERED
                       TABLE 153 META: DEALS
             11.1.2 MICROSOFT
                       TABLE 154 MICROSOFT: COMPANY OVERVIEW
                       FIGURE 36 MICROSOFT: COMPANY SNAPSHOT
                       TABLE 155 MICROSOFT: PRODUCTS/SOLUTIONS/SERVICES OFFERED
                       TABLE 156 MICROSOFT: DEALS
             11.1.3 GOOGLE
                       TABLE 157 GOOGLE: COMPANY OVERVIEW
                       FIGURE 37 GOOGLE: COMPANY SNAPSHOT
                       TABLE 158 GOOGLE: PRODUCTS/SOLUTIONS/SERVICES OFFERED
                       TABLE 159 GOOGLE: PRODUCT LAUNCHES
                       TABLE 160 GOOGLE: DEALS
             11.1.4 UNITY TECHNOLOGIES
                       TABLE 161 UNITY TECHNOLOGIES: COMPANY OVERVIEW
                       FIGURE 38 UNITY TECHNOLOGIES: COMPANY SNAPSHOT
                       TABLE 162 UNITY TECHNOLOGIES: PRODUCTS/SOLUTIONS/SERVICES OFFERED
                       TABLE 163 UNITY TECHNOLOGIES: DEALS
             11.1.5 QUALCOMM
                       TABLE 164 QUALCOMM: COMPANY OVERVIEW
                       FIGURE 39 QUALCOMM: COMPANY SNAPSHOT
                       TABLE 165 QUALCOMM: PRODUCTS/SOLUTIONS/SERVICES OFFERED
                       TABLE 166 QUALCOMM: DEALS
                       TABLE 167 QUALCOMM: OTHERS
             11.1.6 ADOBE
                       TABLE 168 ADOBE: COMPANY OVERVIEW
                       FIGURE 40 ADOBE: COMPANY SNAPSHOT
                       TABLE 169 ADOBE: PRODUCTS/SOLUTIONS/SERVICES OFFERED
                       TABLE 170 ADOBE: DEALS
             11.1.7 AUTODESK
                       TABLE 171 AUTODESK: COMPANY OVERVIEW
                       FIGURE 41 AUTODESK: COMPANY SNAPSHOT
                       TABLE 172 AUTODESK: PRODUCTS/SOLUTIONS/SERVICES OFFERED
                       TABLE 173 AUTODESK: DEALS
             11.1.8 PTC
                       TABLE 174 PTC: COMPANY OVERVIEW
                       FIGURE 42 PTC: COMPANY SNAPSHOT
                       TABLE 175 PTC: PRODUCTS/SOLUTIONS/SERVICES OFFERED
                       TABLE 176 PTC: PRODUCT LAUNCHES
                       TABLE 177 PTC: DEALS
             11.1.9 TEAMVIEWER
                       TABLE 178 TEAMVIEWER: COMPANY OVERVIEW
                       FIGURE 43 TEAMVIEWER: COMPANY SNAPSHOT
                       TABLE 179 TEAMVIEWER: PRODUCTS/SOLUTIONS/SERVICES OFFERED
                       TABLE 180 TEAMVIEWER: PRODUCT LAUNCHES
                       TABLE 181 TEAMVIEWER: DEALS
               11.1.10 NVIDIA CORPORATION
                                   TABLE 182 NVIDIA CORPORATION: COMPANY OVERVIEW
                                   FIGURE 44 NVIDIA CORPORATION: COMPANY SNAPSHOT
                                   TABLE 183 NVIDIA CORPORATION: PRODUCTS/SOLUTIONS/SERVICES OFFERED
                                   TABLE 184 NVIDIA CORPORATION: PRODUCT LAUNCHES
                                   TABLE 185 NVIDIA CORPORATION: DEALS
               11.1.11 ADVANCED MICRO DEVICES
                                   TABLE 186 ADVANCED MICRO DEVICES: COMPANY OVERVIEW
                                   FIGURE 45 ADVANCED MICRO DEVICES: COMPANY SNAPSHOT
                                   TABLE 187 ADVANCED MICRO DEVICES: PRODUCTS/SOLUTIONS/SERVICES OFFERED
                                   TABLE 188 ADVANCED MICRO DEVICES: DEALS
               11.1.12 ZOHO CORPORATION
               11.1.13 VMWARE
               11.1.14 HEXAGON AB
               11.1.15 MAGIC LEAP
     11.2 OTHER PLAYERS 
             11.2.1 TAQTILE
                       TABLE 189 TAQTILE: COMPANY OVERVIEW
                       TABLE 190 TAQTILE: PRODUCTS/SOLUTIONS/SERVICES OFFERED
                       TABLE 191 TAQTILE: PRODUCT LAUNCHES
                       TABLE 192 TAQTILE: DEALS
             11.2.2 BLIPPAR
             11.2.3 AUGMENT
             11.2.4 SHAPESXR
             11.2.5 ARUVR
             11.2.6 SCOPE AR
             11.2.7 VECTARY
             11.2.8 EON REALITY
             11.2.9 WEVR
             11.2.10 TALESPIN REALITY LABS
             11.2.11 SQUINT
             11.2.12 NIANTIC
             11.2.13 MARXENT LABS
             11.2.14 INGLOBE TECHNOLOGIES
             11.2.15 ULTRALEAP
             11.2.16 AMELIA VIRTUAL CARE
*Details on Business Overview, Products/Solutions/Services offered, Recent Developments, MnM View might not be captured in case of unlisted companies.
 
12 ADJACENT/RELATED MARKETS (Page No. - 223)
     12.1 INTRODUCTION 
     12.2 EXTENDED REALITY MARKET 
             12.2.1 MARKET DEFINITION
             12.2.2 MARKET OVERVIEW
             12.2.3 EXTENDED REALITY MARKET, BY TECHNOLOGY
                       TABLE 193 EXTENDED REALITY MARKET, BY TECHNOLOGY, 2019–2022 (USD MILLION)
                       TABLE 194 EXTENDED REALITY MARKET, BY TECHNOLOGY, 2023–2028 (USD MILLION)
             12.2.4 EXTENDED REALITY MARKET, BY VR TECHNOLOGY
                       TABLE 195 VR TECHNOLOGY: EXTENDED REALITY MARKET, BY TECHNOLOGY TYPE, 2019–2022 (USD MILLION)
                       TABLE 196 VR TECHNOLOGY: EXTENDED REALITY MARKET, BY TECHNOLOGY TYPE, 2023–2028 (USD MILLION)
             12.2.5 EXTENDED REALITY MARKET, BY OFFERING
                       TABLE 197 EXTENDED REALITY MARKET, BY OFFERING, 2019–2022 (USD MILLION)
                       TABLE 198 EXTENDED REALITY MARKET, BY OFFERING, 2023–2028 (USD MILLION)
                       TABLE 199 HARDWARE: EXTENDED REALITY MARKET, BY COMPONENT, 2019–2022 (USD MILLION)
                       TABLE 200 HARDWARE: EXTENDED REALITY MARKET, BY COMPONENT, 2023–2028 (USD MILLION)
                       TABLE 201 AR SOFTWARE: EXTENDED REALITY MARKET, BY APPLICATION, 2019–2022 (USD MILLION)
                       TABLE 202 AR SOFTWARE: EXTENDED REALITY MARKET, BY APPLICATION, 2023–2028 (USD MILLION)
                       TABLE 203 VR SOFTWARE: EXTENDED REALITY MARKET, BY APPLICATION, 2019–2022 (USD MILLION)
                       TABLE 204 VR SOFTWARE: EXTENDED REALITY MARKET, BY APPLICATION, 2023–2028 (USD MILLION)
                       TABLE 205 MR SOFTWARE: EXTENDED REALITY MARKET, BY APPLICATION, 2019–2022 (USD MILLION)
                       TABLE 206 MR SOFTWARE: EXTENDED REALITY MARKET, BY APPLICATION, 2023–2028 (USD MILLION)
             12.2.6 EXTENDED REALITY MARKET, DEVICE TYPE
                       TABLE 207 EXTENDED REALITY MARKET, BY DEVICE TYPE, 2019–2022 (USD MILLION)
                       TABLE 208 EXTENDED REALITY MARKET, BY DEVICE TYPE, 2023–2028 (USD MILLION)
             12.2.7 EXTENDED REALITY MARKET, BY REGION
                       TABLE 209 EXTENDED REALITY MARKET, BY REGION, 2019–2022 (USD MILLION)
                       TABLE 210 EXTENDED REALITY MARKET, BY REGION, 2023–2028 (USD MILLION)
     12.3 IMMERSIVE ANALYTICS MARKET 
             12.3.1 MARKET DEFINITION
             12.3.2 MARKET OVERVIEW
             12.3.3 IMMERSIVE ANALYTICS MARKET, BY OFFERING
                       TABLE 211 IMMERSIVE ANALYTICS MARKET, BY OFFERING, 2023–2028 (USD MILLION)
                       TABLE 212 IMMERSIVE ANALYTICS MARKET, BY HARDWARE, 2023–2028 (USD MILLION)
                       TABLE 213 AR/VR/MR HEADSETS: IMMERSIVE ANALYTICS MARKET, BY REGION, 2023–2028 (USD MILLION)
                       TABLE 214 DISPLAYS: IMMERSIVE ANALYTICS MARKET, BY REGION, 2023–2028 (USD MILLION)
                       TABLE 215 SENSORS & CONTROLLERS: IMMERSIVE ANALYTICS MARKET, BY REGION, 2023–2028 (USD MILLION)
                       TABLE 216 OTHER HARDWARE: IMMERSIVE ANALYTICS MARKET, BY REGION, 2023–2028 (USD MILLION)
                       TABLE 217 IMMERSIVE ANALYTICS MARKET, BY SERVICE, 2023–2028 (USD MILLION)
                       TABLE 218 PROFESSIONAL SERVICES: IMMERSIVE ANALYTICS MARKET, BY REGION, 2023–2028 (USD MILLION)
                       TABLE 219 MANAGED SERVICES: IMMERSIVE ANALYTICS MARKET, BY REGION, 2023–2028 (USD MILLION)
             12.3.4 IMMERSIVE ANALYTICS MARKET, BY END-USE INDUSTRY
                       TABLE 220 IMMERSIVE ANALYTICS MARKET, BY END-USE INDUSTRY, 2023–2028 (USD MILLION)
                       TABLE 221 MEDIA & ENTERTAINMENT: IMMERSIVE ANALYTICS MARKET, BY REGION, 2023–2028 (USD MILLION)
                       TABLE 222 HEALTHCARE: IMMERSIVE ANALYTICS MARKET, BY REGION, 2023–2028 (USD MILLION)
                       TABLE 223 AUTOMOTIVE & TRANSPORTATION: IMMERSIVE ANALYTICS MARKET, BY REGION, 2023–2028 (USD MILLION)
                       TABLE 224 CONSTRUCTION: IMMERSIVE ANALYTICS MARKET, BY REGION, 2023–2028 (USD MILLION)
                       TABLE 225 GOVERNMENT & DEFENSE: IMMERSIVE ANALYTICS MARKET, BY REGION, 2023–2028 (USD MILLION)
                       TABLE 226 OTHER END-USE INDUSTRIES: IMMERSIVE ANALYTICS MARKET, BY REGION, 2023–2028 (USD MILLION)
             12.3.5 IMMERSIVE ANALYTICS MARKET, BY REGION
                       TABLE 227 IMMERSIVE ANALYTICS MARKET, BY REGION, 2023–2028 (USD MILLION)
 
13 APPENDIX (Page No. - 238)
     13.1 DISCUSSION GUIDE 
     13.2 KNOWLEDGESTORE: MARKETSANDMARKETS’ SUBSCRIPTION PORTAL 
     13.3 CUSTOMIZATION OPTIONS 
     13.4 RELATED REPORTS 
     13.5 AUTHOR DETAILS 

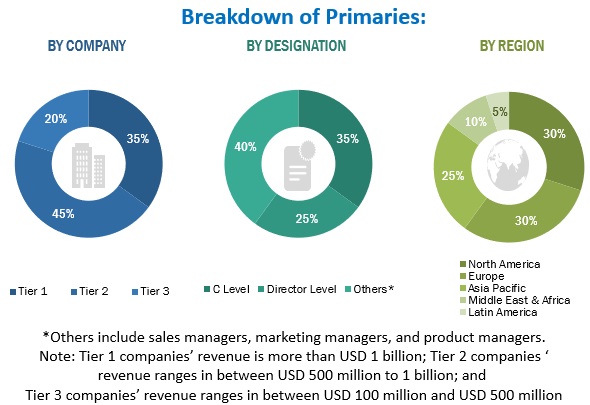
This research study involved the extensive use of secondary sources, directories, and databases, such as Dun & Bradstreet (D&B) Hoovers and Bloomberg BusinessWeek, to identify and collect information useful for a technical, market-oriented, and commercial study of the AR VR Software market. The primary sources have been mainly industry experts from the core and related industries and preferred suppliers, manufacturers, distributors, service providers, technology developers, alliances, and organizations related to all segments of the value chain of this market. In-depth interviews have been conducted with various primary respondents, including key industry participants, subject matter experts, C-level executives of key market players, and industry consultants to obtain and verify critical qualitative and quantitative information.

Secondary Research

The market for companies offering AR VR Software solutions and services to different verticals has been estimated and projected based on the secondary data made available through paid and unpaid sources, as well as by analyzing their product portfolios in the ecosystem of the AR VR Software market. It also involved rating company products based on their performance and quality. In the secondary research process, various sources such as the Immersive Technology Alliance (ITA), International Virtual Reality and Healthcare Association (IVHA), VR/AR Association (VRARA), Augmented Reality for Enterprise Alliance (AREA), have been referred to for identifying and collecting information for this study on the AR VR Software market. The secondary sources included annual reports, press releases and investor presentations of companies, white papers, journals, and certified publications and articles by recognized authors, directories, and databases. Secondary research has been mainly used to obtain key information about the supply chain of the market, the total pool of key players, market classification, segmentation according to industry trends to the bottommost level, regional markets, and key developments from both market- and technology-oriented perspectives that have been further validated by primary sources.

Primary Research

In the primary research process, various primary sources from both supply and demand sides were interviewed to obtain qualitative and quantitative information on the market. The primary sources from the supply side included various industry experts, including Chief Experience Officers (CXOs); Vice Presidents (VPs); directors from business development, marketing, and product development/innovation teams; related key executives from AR VR Software solution vendors, SIs, professional service providers, and industry associations; and key opinion leaders. Primary interviews were conducted to gather insights, such as market statistics, revenue data collected from solutions and services, market breakups, market size estimations, market forecasts, and data triangulation. Primary research also helped in understanding various trends related to technologies, applications, deployments, and regions. Stakeholders from the demand side, such as Chief Information Officers (CIOs), Chief Technology Officers (CTOs), Chief Strategy Officers (CSOs), and end users using AR VR Software solutions, were interviewed to understand the buyer’s perspective on suppliers, products, service providers, and their current usage of AR VR Software solutions which would impact the overall AR VR Software market.
AR VR Software Market Size, and Share

To know about the assumptions considered for the study, download the pdf brochure

Market Size Estimation

Multiple approaches were adopted to estimate and forecast the size of the AR VR Software market. The first approach involves estimating market size by summing up the revenue generated by companies through the sale of AR and VR Software offerings.

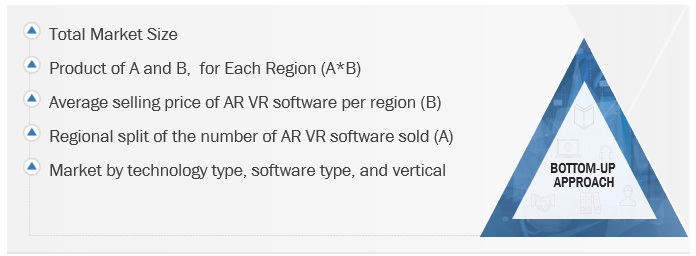
Both top-down and bottom-up approaches were used to estimate and validate the total size of the AR VR Software market. These methods were extensively used to estimate the size of various segments in the market. The research methodology used to estimate the market size includes the following:

  • Key players in the market have been identified through extensive secondary research.
  • In terms of value, the industry’s supply chain and market size have been determined through primary and secondary research processes.
  • All percentage shares, splits, and breakups have been determined using secondary sources and verified through primary sources.

AR VR Software Market Size: Bottom-Up Approach
AR VR Software Market Size, and Share

To know about the assumptions considered for the study, Request for Free Sample Report

AR VR Software Market Size: Top-Down Approach

AR VR Software Market Size, and Share

Data Triangulation

After arriving at the overall market size, the AR VR Software market was divided into several segments and subsegments. A data triangulation procedure was used to complete the overall market engineering process and arrive at the exact statistics for all segments and subsegments, wherever applicable. The data was triangulated by studying various factors and trends from the demand and supply sides. Along with data triangulation and market breakdown, the market size was validated by the top-down and bottom-up approaches.

Market Definition

AR and VR software refer to computer programs and applications designed to create interactive, immersive, and often sensory-rich digital experiences. AR software overlays digital information onto the real world, enhancing it with digital elements, while VR software completely immerses users in a computer-generated environment, typically through headsets or other devices. These software technologies find applications in gaming, education, training, simulations, entertainment, and various industries, transforming how users interact with digital content and their surroundings.

Key Stakeholders

  • AR VR Software providers
  • Government organizations, forums, alliances, and associations
  • Consulting service providers
  • Value-added resellers (VARs)
  • End users
  • System integrators
  • Research organizations
  • Consulting companies

Report Objectives

  • To determine and forecast the global AR VR Software market by technology (AR software, VR software), software type, vertical, and region from 2023 to 2038, and analyze the various macroeconomic and microeconomic factors affecting market growth.
  • To forecast the size of the market segments with respect to five main regions: North America, Europe, Asia Pacific, Latin America, and Middle East & Africa.
  • To provide detailed information about the major factors (drivers, restraints, opportunities, and challenges) influencing the growth of the market.
  • To analyze each submarket with respect to individual growth trends, prospects, and contributions to the overall market.
  • To analyze the opportunities in the market for stakeholders by identifying the high-growth segments of the AR VR Software market.
  • To profile the key market players; provide a comparative analysis based on business overviews, regional presence, product offerings, business strategies, and key financials; and illustrate the market's competitive landscape.
  • Track and analyze competitive developments in the market, such as mergers and acquisitions, product developments, partnerships and collaborations, and research and development (R&D) activities.

Available Customizations

With the given market data, MarketsandMarkets offers customizations as per the company’s specific needs. The following customization options are available for the report:

Country-wise information

  • Analysis for additional countries (up to five)

Company Information

  • Detailed analysis and profiling of additional market players (up to 5)
Custom Market Research Services

We will customize the research for you, in case the report listed above does not meet with your exact requirements. Our custom research will comprehensively cover the business information you require to help you arrive at strategic and profitable business decisions.

Request Customization
Report Code
TC 8804
Published ON
Oct, 2023
Choose License Type
BUY NOW
  • SHARE
X
Request Customization
Speak to Analyst
Speak to Analyst
OR FACE-TO-FACE MEETING
PERSONALIZE THIS RESEARCH
  • Triangulate with your Own Data
  • Get Data as per your Format and Definition
  • Gain a Deeper Dive on a Specific Application, Geography, Customer or Competitor
  • Any level of Personalization
REQUEST A FREE CUSTOMIZATION
LET US HELP YOU!
  • What are the Known and Unknown Adjacencies Impacting the AR VR Software Market
  • What will your New Revenue Sources be?
  • Who will be your Top Customer; what will make them switch?
  • Defend your Market Share or Win Competitors
  • Get a Scorecard for Target Partners
CUSTOMIZED WORKSHOP REQUEST
  • Call Us
  • +1-888-600-6441 (Corporate office hours)
  • +1-888-600-6441 (US/Can toll free)
  • +44-800-368-9399 (UK office hours)
CONNECT WITH US
ABOUT TRUST ONLINE
©2024 MarketsandMarkets Research Private Ltd. All rights reserved
DMCA.com Protection Status
Website Feedback