Autoinjectors Market by Therapy (Rheumatoid Arthritis, Multiple Sclerosis, Anaphylaxis, Cardiovascular Diseases, Diabetes), Type (Disposable, Reusable), Route of administration (Subcutaneous, Intramuscular), End User (Hospital) & Region - Global Forecasts to 2025
Updated on : February 20, 2023
The global autoinjectors market in terms of revenue was estimated to be worth $46.0 billion in 2020 and is poised to reach $104.9 billion by 2025, growing at a CAGR of 17.9% from 2020 to 2025. Market growth is largely driven by the growing prevalence of targeted therapies, the rising incidence of anaphylaxis, rising preference for self-administration of drugs, usability advantages, the increasing number of regulatory approvals, the availability of generic versions of autoinjectors, favorable reimbursements and government support, and technological advancements. The patent expiry of biologics is also expected to provide growth opportunities for players in the market.
On the other hand, the preference for alternative routes of drug delivery such as oral diabetic agents and nasal epinephrine sprays is expected to limit the adoption of autoinjector devices.
To know about the assumptions considered for the study, Request for Free Sample Report
Autoinjectors Market Dynamics
Drivers: Rising incidence of anaphylaxis
Anaphylaxis is a severe, potentially life-threatening allergic reaction to food, drugs, latex, and Hymenoptera stings. According to a NICE study, anaphylaxis-type reactions occur in ~1 in 1,000 of the general population. During general anesthesia, anaphylaxis occurs in 1 in 10,000–20,000 anesthetics. These patients may be denied general anesthesia in the future unless a safe combination of drugs can be identified. Studies on anaphylaxis epidemiology have reported an annual incidence rate of 1.5–50 per 100,000 person-years. However, most reports are from Western countries such as the US, the UK, and Australia. According to a study published in the European Journal of Allergy and Clinical Immunology in 2019, the incidence of anaphylaxis in children worldwide varied widely, ranging from 1 to 761 per 100,000 person-years for total anaphylaxis and 1 to 77 per 100,000 person-years for food-related anaphylaxis.
Epinephrine is the first line of treatment for anaphylaxis. Pharmaceutical companies are coming up with technologically advanced epinephrine autoinjectors (EAIs) for anaphylaxis. Technological advancements include innovative designs, portable devices, autoinjectors with two autoinjectable doses in one device, autoinjectors made with a 0.1-mg dose of epinephrine for infants, autoinjectors made with a 0.5- or 0.75-mg dose of epinephrine for larger adults, autoinjectors with better temperature stability and longer shelf life for epinephrine, impact and weather-resistant casing, and devices that inform patients that the dose was successfully delivered. Factors considered for the improvement of autoinjectors include removal force of safety cap, needle activation force, override force, ejection dosage, needle length, ejection time, dose setting & audible click detection. Such technological advancements are expected to boost the adoption of autoinjectors in the coming years significantly.
Restraints: Alternative drug delivery modes
Traditional injectables with vials and syringes are invasive and painful modes of drug delivery, owing to which patients and care providers are increasingly focusing on alternative routes such as oral, topical, and nasal routes. The oral route is the most preferred as it is easy to use, convenient, cost-effective, safe, and acceptable. Moreover, the introduction of needle-free drug delivery devices such as jet injectors also restricts the market growth. For example, Antares Pharma offers jet injectors to deliver growth hormone in the US, Europe, Asia, and Japan.
Needle-free devices also come with an added advantage-they do not induce needle anxiety, which is a significant deterrent to the greater adoption of injectable drug treatments. Non-compliance among children and adults is mostly attributed to the pain associated with daily injections and the requirements of long-term therapy. According to a study published in the Journal of Advanced Nursing in 2019, most children exhibited needle fear, while prevalence estimates for needle fear ranged from 20–50% in adolescents and 20–30% in young adults. Additionally, about 45% of RA patients reported needle-phobia. As patients suffering from diabetes, rheumatoid arthritis, and growth hormone deficiency, among others, require weekly injection therapy using autoinjectors, needle anxiety is a key restraint to market growth.
Opportunities: Need to limit patient visits and physical contact
The current COVID-19 pandemic has resulted in the implementation of a fresh set of protocols that aim to reduce patient visits to hospitals and clinics in non-emergency conditions to prevent both the transmission of the virus as much as make sure healthcare institutions are not overwhelmed. In this situation, the preference for home-use autoinjectors has risen among patients suffering from chronic illnesses and allergies. This also protects vulnerable high-risk populations from exposure to the virus during hospital visits.
Autoinjectors are being developed to support increased viscosity and concentrations of drugs to reduce administration frequency, thus increasing adherence to recommended drug protocols. These factors present an opportunity for the growth of the autoinjectors market in the current COVID-19 scenario.
Challenges: Development of autoinjectors for multiple drug viscosities
The biggest challenge faced by OEMs is developing single-design autoinjectors for multiple drugs and biologics with varying viscosities. Drugs with different viscosities require springs with different physical characteristics such as composition, length, and thickness to create a spring rate that provides enough power to push higher-viscosity drugs and biologics through the syringe to the needle. Currently, most pharma OEMs lack the knowledge to create autoinjectors capable of delivering multiple drugs and biologics with varying viscosities. However, players are working on overcoming this challenge. For instance, Ypsomed’s Ypsomate 2-step autoinjector has configuration capabilities for different fill volumes and viscosities.
Rheumatoid Arthritis segment accounted for the largest share of autoinjectors market in 2020.
The market, by therapy, is segmented into rheumatoid arthritis, multiple sclerosis, anaphylaxis, diabetes, multiple sclerosis, and other therapies (includes cardiovascular diseases, migraine treatment, anemia, and progesterone therapy). In 2019, rheumatoid arthritis accounted for the largest share of global market. The large share of this segment is mainly attributed to its high prevalence. The increasing incidence of RA fuels the demand for autoinjectors for this therapy segment. According to the CDC, an estimated 43.7 million adults (22.7% of the total population) in the US are affected annually by some form of arthritis, RA, gout, lupus, or fibromyalgia.
Disposable autoinjectors segment accounted for the largest share of autoinjectors market in 2020.
Based on type, the market is segmented into reusable and disposable autoinjectors. In 2019, the disposable autoinjectors segment accounted for the largest share of the global market. Disposable autoinjectors are the most-preferred autoinjectors due to their ease of use and the presence of a built-in glass syringe (eliminates the need of manually loading the glass syringe), which makes it more convenient for patients with reduced dexterity or visual impairments.
Subcutaneous segment is projected to witness fastest growth during the forecast period
Based on route of administration, the autoinjectors market is segmented intramuscular and subcutaneous. Patients use autoinjectors for intramuscular and subcutaneous administration of various drugs for the treatment of diseases such as rheumatoid arthritis, multiple sclerosis, anaphylaxis, diabetes, migraine, anemia, and cancer. The subcutaneous segment accounted for the largest share and it is expected to witness fastest growth during the forecast period. The large share of this segment can primarily be attributed to the growing number of product approvals by regulatory bodies for the treatment of chronic diseases.
Home care settings segment accounted for the largest share of the autoinjectors market in 2019
Based on end users, the market is segmented into home care settings, hospitals & clinics, and ambulatory care settings. The home care settings segment accounted for the largest share of the global market in 2019. The large share of this end-user segment can primarily be attributed to the rapid growth in the geriatric population across the globe and the growing need for cost-effective drug administration.
Asia Pacificis projected to witness highest CAGR during the forecast period of 2020–2025.
Geographically, the autoinjectors market is segmented into North America, Europe, the Asia Pacific, Latin America, and Middle East & Africa. Growth in the Asia Pacific market is majorly driven by the large diabetes population and increasing healthcare expenditure which has drawn a number of major autoinjector device manufacturers to this region. These companies are increasing their presence in the Asia Pacific market through several approaches, such as establishing sales offices and partnering with local pharmaceutical companies.
Some of the key players operating in the autoinjectors market include AbbVie Inc. (US), Mylan (US), Eli Lilly and Company (US), Ypsomed (Switzerland), Amgen (US), Becton, Dickinson and Company (US), GlaxoSmithKline plc (UK), Johnson & Johnson (US), Teva Pharmaceutical (Israel), Antares Pharma (US), Merck KGaA (Germany).
Autoinjectors Market Report Scope:
Report Metric |
Details |
Market Size Available for Years |
2018–2025 |
Base Year Considered |
2019 |
Forecast Period |
2020–2025 |
Forecast Unit |
Value (USD Billion) |
Segments Covered |
Therapy, Type, Route of Administration and End User |
Geographies Covered |
|
The research report categorizes the autoinjectors market into the following segments and sub-segments:
By Therapy
- Rheumatoid Arthritis
- Multiple Sclerosis
- Diabetes
- Anaphylaxis
- Other Therapies
By Type
- Disposable Autoinjectors
- Reusable Autoinjectors
By Route of Administration
- Subcutaneous
- Intramuscular
By End User
- Home Care Settings
- Hospitals & Clinics
- Ambulatory Care Settings
By Region
-
North America
- US
- Canada
-
Europe
- Germany
- UK
- France
- Italy
- Spain
- Rest of Europe
-
Asia-Pacific
- China
- Japan
- India
- Rest of Asia-Pacific
- Latin America
- Middle East and Africa
Recent Developments
- In August 2020, Antares Pharma (US) signed an agreement with Lunatus Global Medical Supplies (Dubai). In this agreement, Antares will supply packaged products to Lunatus and Lunatus will submit and obtain regulatory approval for XYOSTED in the UAE and Saudi Arabia as well as promote, market, and distribute XYOSTED in these two countries.
- In March 2020, SHL Medical (Switzerland) acquired Weibel CDS (Switzerland). This acquisition aimed at strengthening SHL Medical’s ability to provide more advanced drug delivery systems based on human-centered designs and functionality.
- In January 2020, Eli Lilly invested USD 470 million and created over 460 new jobs in Durham, NC. This expansion brought a new state-of-the-art pharmaceutical manufacturing facility to North Carolina’s research triangle park.
- In November 2019, Becton, Dickinson and Company (US) launched a disposable autoinjector namely BD Intevia 1ml Disposable Autoinjector. This activity will strengthen company’s autoinjector’s portfolio.
Frequently Asked Questions (FAQ):
Which are the top industry players in the global autoinjectors market?
Some of the top market players in the global autoinjectors market include AbbVie Inc. (US), Mylan (US), Eli Lilly and Company (US), Ypsomed (Switzerland), Amgen (US), Becton, Dickinson and Company (US), GlaxoSmithKline plc (UK), Johnson & Johnson (US), Teva Pharmaceutical (Israel), Antares Pharma (US), Merck KGaA (Germany), Meridian Medical Technologies, Inc. (US), Roche Diagnostics (Switzerland), Bespak (UK), Bayer (Germany), SHL Medical (Switzerland), Haselmeier (Switzerland), Owen Mumford (UK), Ravimed (Poland), Medeca Pharma AB (Sweden), Cambridge Consultants Ltd. (UK), Flex (US), SMC Ltd. (US), and Promius Pharma (US).
What are the top trends in the autoinjectors market?
Trends in the autoinjectors market:
- Advancements in autoinjector design
- Wearable autoinjectors
- Connected autoinjector devices
Opportunities in the autoinjectors market:
- Patent expiry of biologics to drive the demand for biosimilars
- Need to limit patient visits and physical contact
Which autoinjectors market, by therapy, have been included in this report?
The autoinjectors market, by products, is categorized into:
- Rheumatoid Arthritis
- Multiple Sclerosis
- Diabetes
- Anaphylaxis
- Other Therapies
Which geographical region is dominating in the autoinjectors market?
The autoinjectors market is segmented into five major regions: Europe, North America, the Asia Pacific, Latin America, and the Middle East & Africa. North America is the largest regional market for autoinjectors, followed by the Europe and Asia Pacific. Growth in the North American market is majorly driven by factors such as the rising incidence of anaphylaxis and the presence of favorable reimbursements. Moreover, the US and Canada are developed economies with high awareness and adoption rates for advanced devices such as autoinjectors, which is beneficial for market growth. Furthermore, other microeconomic indicators such as rising healthcare expenditures, high affordability rate, and the improving regulatory scenario are also major factors contributing to market growth.
Which is the leading therapy in the autoinjectors market?
The autoinjectors market, by therapy, is segmented into rheumatoid arthritis, multiple sclerosis, anaphylaxis, diabetes, multiple sclerosis, and other therapies (includes cardiovascular diseases, migraine treatment, anemia, and progesterone therapy). In 2019, rheumatoid arthritis accounted for the largest share of autoinjectors market. The large share of this segment is mainly attributed to its high prevalence. The increasing incidence of RA fuels the demand for autoinjectors for this therapy segment. According to the CDC, an estimated 43.7 million adults (22.7% of the total population) in the US are affected annually by some form of arthritis, RA, gout, lupus, or fibromyalgia.
Which is the leading type segment of the autoinjectors market?
Based on type, the autoinjectors market is segmented into reusable and disposable autoinjectors. In 2019, the disposable autoinjectors segment accounted for the largest share of the global autoinjectors market. Disposable autoinjectors are the most-preferred autoinjectors due to their ease of use and the presence of a built-in glass syringe (eliminates the need of manually loading the glass syringe), which makes it more convenient for patients with reduced dexterity or visual impairments.
Which is the leading route of administration segment of the autoinjectors market?
Based on route of administration, the autoinjectors market is segmented intramuscular and subcutaneous. Patients use autoinjectors for intramuscular and subcutaneous administration of various drugs for the treatment of diseases such as rheumatoid arthritis, multiple sclerosis, anaphylaxis, diabetes, migraine, anemia, and cancer. The subcutaneous segment accounted for the largest share and it is expected to witness fastest growth during the forecast period. The large share of this segment can primarily be attributed to the growing number of product approvals by regulatory bodies for the treatment of chronic diseases.
Which is the leading end user segment of the autoinjectors market?
Based on end users, the autoinjectors market is segmented into home care settings, hospitals & clinics, and ambulatory care settings. The home care settings segment accounted for the largest share of the autoinjectors market in 2019. The large share of this end-user segment can primarily be attributed to the rapid growth in the geriatric population across the globe and the growing need for cost-effective drug administration. .
To speak to our analyst for a discussion on the above findings, click Speak to Analyst
TABLE OF CONTENTS
1 INTRODUCTION (Page No. - 29)
1.1 OBJECTIVES OF THE STUDY
1.2 MARKET DEFINITION & SCOPE
1.3 MARKETS COVERED
FIGURE 1 AUTOINJECTORS MARKET SEGMENTATION
1.4 YEARS CONSIDERED FOR THE STUDY
1.5 CURRENCY
1.6 LIMITATIONS
1.7 STAKEHOLDERS
1.8 SUMMARY OF CHANGES
2 RESEARCH METHODOLOGY (Page No. - 33)
2.1 RESEARCH APPROACH
FIGURE 2 RESEARCH DESIGN
2.1.1 SECONDARY DATA
2.1.1.1 Key data from secondary sources
2.1.2 PRIMARY DATA
2.1.2.1 Key data from primary sources
2.1.2.2 Breakdown of primaries
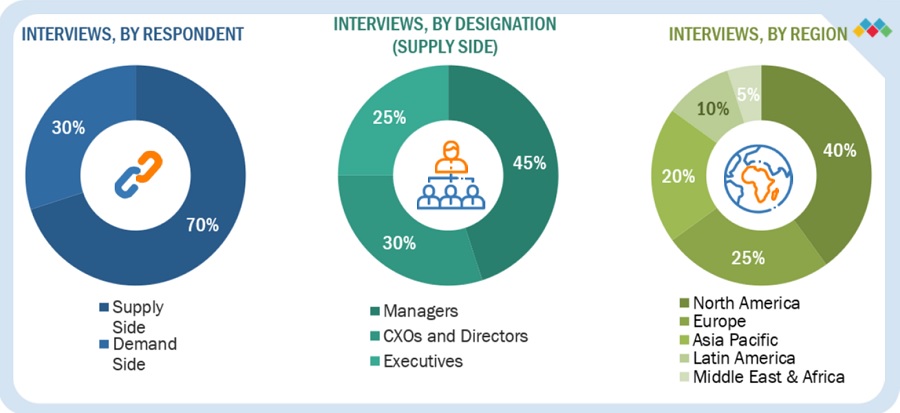
FIGURE 4 BREAKDOWN OF PRIMARY INTERVIEWS (SUPPLY SIDE): BY COMPANY TYPE, DESIGNATION, AND REGION
FIGURE 5 BREAKDOWN OF PRIMARY INTERVIEWS (DEMAND SIDE): BY END USER, DESIGNATION, AND REGION
2.2 MARKET SIZE ESTIMATION
FIGURE 6 MARKET SIZE ESTIMATION: REVENUE SHARE ANALYSIS (2019)
FIGURE 7 MARKET SIZE ESTIMATION: REVENUE SHARE ANALYSIS (2019)
FIGURE 8 SUPPLY-SIDE ANALYSIS: GLOBAL MARKET (2019)
FIGURE 9 CAGR PROJECTIONS: SUPPLY-SIDE ANALYSIS OF THE GLOBAL MARKET (2019)
FIGURE 10 CAGR PROJECTIONS FROM THE ANALYSIS OF DRIVERS, RESTRAINTS, OPPORTUNITIES, AND CHALLENGES OF THE GLOBAL MARKET (2020–2025)
2.3 MARKET BREAKDOWN & DATA TRIANGULATION
2.4 MARKET SHARE ESTIMATION
2.5 ASSUMPTIONS FOR THE STUDY
2.6 COVID-19 HEALTH ASSESSMENT
2.7 COVID-19 ECONOMIC ASSESSMENT
2.8 ASSESSMENT OF THE IMPACT OF COVID-19 ON THE ECONOMIC SCENARIO
FIGURE 12 CRITERIA IMPACTING THE GLOBAL ECONOMY
FIGURE 13 RECOVERY SCENARIO OF THE GLOBAL ECONOMY
3 EXECUTIVE SUMMARY (Page No. - 48)
FIGURE 14 AUTOINJECTORS MARKET, BY THERAPY, 2020 VS. 2025 (USD MILLION)
FIGURE 15 GLOBAL MARKET, BY TYPE, 2020 VS. 2025 (USD MILLION)
FIGURE 16 GLOBAL MARKET, BY ROUTE OF ADMINISTRATION, 2020 VS. 2025 (USD MILLION)
FIGURE 17 GLOBAL MARKET, BY END USER, 2020 VS. 2025 (USD MILLION)
FIGURE 18 GEOGRAPHICAL SNAPSHOT OF THE GLOBAL MARKET
4 PREMIUM INSIGHTS (Page No. - 52)
4.1 AUTOINJECTORS MARKET OVERVIEW
FIGURE 19 GROWING PREVALENCE OF TARGETED THERAPIES AND RISING PREFERENCE FOR SELF-ADMINISTRATION OF DRUGS TO DRIVE MARKET GROWTH
4.2 ASIA PACIFIC: MARKET, BY THERAPY AND COUNTRY (2020)
FIGURE 20 RHEUMATOID ARTHRITIS SEGMENT TO ACCOUNT FOR THE LARGEST SHARE OF THE APAC MARKET IN 2020
4.3 GLOBAL MARKET, BY REGION, 2020−2025
FIGURE 21 NORTH AMERICA WILL CONTINUE TO DOMINATE THE GLOBAL MARKET IN THE FORECAST PERIOD
4.4 GLOBAL MARKET: DEVELOPED VS. DEVELOPING MARKETS
FIGURE 22 DEVELOPING MARKETS TO REGISTER HIGHER GROWTH DURING THE FORECAST PERIOD
5 MARKET OVERVIEW (Page No. - 55)
5.1 INTRODUCTION
5.2 MARKET DYNAMICS
FIGURE 23 AUTOINJECTORS MARKET: DRIVERS, RESTRAINTS, OPPORTUNITIES, & CHALLENGES
5.2.1 DRIVERS
5.2.1.1 Growing prevalence of targeted therapies
FIGURE 24 CHINA: TOTAL DIABETIC POPULATION FROM 2010 TO 2045
5.2.1.2 Rising incidence of anaphylaxis
5.2.1.3 Increasing number of regulatory approvals
TABLE 1 RECENT APPROVALS OF AUTOINJECTOR DEVICES ACROSS THE GLOBE
5.2.1.4 Availability of generic versions of autoinjectors
5.2.1.5 Favorable reimbursements and government support
5.2.1.6 Ease of use increasing the preference for self-administration
5.2.2 RESTRAINTS
5.2.2.1 Alternative drug delivery modes
5.2.2.2 Research, development, and launch of oral diabetic agents and oral insulin
5.2.2.3 Development of nasal epinephrine sprays
5.2.3 OPPORTUNITIES
5.2.3.1 Patent expiry of biologics to drive the demand for biosimilars
TABLE 2 PATENT EXPIRY OF KEY BIOLOGICS
5.2.3.2 Need to limit patient visits and physical contact
5.2.4 CHALLENGES
5.2.4.1 Development of autoinjectors for multiple drug viscosities
5.2.4.2 Lack of proper training for using autoinjectors
5.3 COVID-19 IMPACT ON THE GLOBAL MARKET
5.4 AVERAGE SELLING PRICE TRENDS
TABLE 3 AVERAGE SELLING PRICE OF EPINEPHRINE AUTOINJECTORS, BY REGION, 2015 VS. 2020
5.5 VALUE CHAIN ANALYSIS
FIGURE 25 GLOBAL MARKET: VALUE CHAIN ANALYSIS (2019)
5.6 ECOSYSTEM ANALYSIS
FIGURE 26 ECOSYSTEM: GLOBAL MARKET (2019)
6 INDUSTRY INSIGHTS (Page No. - 65)
6.1 INTRODUCTION
6.2 INDUSTRY TRENDS
6.2.1 ADVANCEMENTS IN AUTOINJECTOR DESIGN
6.2.2 WEARABLE AUTOINJECTORS
6.2.3 CONNECTED AUTOINJECTOR DEVICES
7 AUTOINJECTORS MARKET, BY THERAPY (Page No. - 67)
7.1 INTRODUCTION
TABLE 4 GLOBAL MARKET, BY THERAPY, 2018–2025 (USD MILLION)
TABLE 5 GLOBAL MARKET, BY THERAPY, 2018–2025 (USD MILLION)
7.2 RHEUMATOID ARTHRITIS
7.2.1 INCREASING INCIDENCE OF RA HAS BOOSTED THE ADOPTION OF AUTOINJECTORS
TABLE 6 GLOBAL MARKET FOR RHEUMATOID ARTHRITIS, BY COUNTRY, 2018–2025 (USD MILLION)
7.3 DIABETES
7.3.1 LARGE PATIENT POPULATION TO STIMULATE THE DEMAND FOR AUTOINJECTORS DURING THE FORECAST PERIOD
FIGURE 27 DIABETIC POPULATION: TOP COUNTRIES/TERRITORIES (20–79 YEARS), 2019 VS. 2030 VS. 2045
TABLE 7 GLOBAL MARKET FOR DIABETES, BY COUNTRY, 2018–2025 (USD MILLION)
7.4 MULTIPLE SCLEROSIS
7.4.1 INFLUX OF GENERICS IS EXPECTED TO NEGATIVELY IMPACT MARKET GROWTH DURING THE FORECAST PERIOD
FIGURE 28 NUMBER OF PEOPLE WITH MS (PER 100,000) - WHO REGIONS
TABLE 8 GLOBAL MARKET FOR MULTIPLE SCLEROSIS, BY COUNTRY, 2018–2025 (USD MILLION)
7.5 ANAPHYLAXIS
7.5.1 INCREASING PREVALENCE OF FOOD ALLERGIES TO DRIVE THE UPTAKE OF AUTOINJECTORS
TABLE 9 GLOBAL MARKET FOR ANAPHYLAXIS, BY COUNTRY, 2018–2025 (USD MILLION)
7.6 OTHER THERAPIES
TABLE 10 GLOBAL MARKET FOR OTHER THERAPIES, BY COUNTRY, 2018–2025 (USD MILLION)
7.7 IMPACT OF COVID-19 ON THE THERAPEUTIC APPLICATIONS OF AUTOINJECTORS
8 AUTOINJECTORS MARKET, BY TYPE (Page No. - 76)
8.1 INTRODUCTION
TABLE 11 COMPARISON OF DISPOSABLE & REUSABLE AUTOINJECTORS
TABLE 12 GLOBAL MARKET, BY TYPE, 2018–2025 (USD MILLION)
TABLE 13 AUTOINJECTORS DEVICES MARKET, BY REGION, 2018 - 2025 (USD MILLION)
8.2 DISPOSABLE AUTOINJECTORS
8.2.1 DISPOSABLE AUTOINJECTORS ARE CONVENIENT FOR PATIENTS WITH REDUCED DEXTERITY OR VISUAL IMPAIRMENTS
TABLE 14 DISPOSABLE AUTOINJECTORS MARKET, BY COUNTRY, 2018–2025 (USD MILLION)
TABLE 15 DISPOSABLE AUTOINJECTORS DEVICES MARKET, BY REGION, 2018 - 2025 (USD MILLION)
TABLE 16 DISPOSABLE AUTOINJECTORS DEVICES MARKET, BY REGION, 2018 - 2025 (MILLION UNITS)
8.3 REUSABLE AUTOINJECTORS
8.3.1 REUSABLE AUTOINJECTORS ARE MORE ECONOMICAL AS COMPARED TO DISPOSABLE AUTOINJECTORS
TABLE 17 REUSABLE AUTOINJECTORS MARKET, BY COUNTRY, 2018–2025 (USD MILLION)
TABLE 18 REUSABLE AUTOINJECTORS DEVICES MARKET, BY REGION, 2018 - 2025 (USD MILLION)
TABLE 19 REUSABLE AUTOINJECTORS DEVICES MARKET, BY REGION, 2018 - 2025 (MILLION UNITS)
9 AUTOINJECTORS MARKET, BY ROUTE OF ADMINISTRATION (Page No. - 83)
9.1 INTRODUCTION
TABLE 20 AUTOINJECTORS MARKET, BY ROUTE OF ADMINISTRATION, 2018–2025 (USD MILLION)
9.2 SUBCUTANEOUS
9.2.1 GROWING NUMBER OF PRODUCT APPROVALS BY REGULATORY BODIES WILL SUPPORT THE GROWTH OF THIS MARKET SEGMENT
TABLE 21 SUBCUTANEOUS AUTOINJECTORS, BY COUNTRY, 2018–2025 (USD MILLION)
9.3 INTRAMUSCULAR
9.3.1 INTRAMUSCULAR ROUTE OF ADMINISTRATION ENABLES MEDICATION TO BE ABSORBED QUICKLY—A KEY FACTOR DRIVING MARKET GROWTH
TABLE 22 EXAMPLES OF INTRAMUSCULAR AUTOINJECTORS
TABLE 23 INTRAMUSCULAR AUTOINJECTORS MARKET, BY COUNTRY, 2018–2025 (USD MILLION)
10 AUTOINJECTORS MARKET, BY END USER (Page No. - 88)
10.1 INTRODUCTION
TABLE 24 GLOBAL MARKET, BY END USER, 2018–2025 (USD MILLION)
10.2 HOME CARE SETTINGS
10.2.1 HOME CARE THERAPIES ARE COST-EFFECTIVE COMPARED TO TREATMENTS IN HOSPITALS—A KEY FACTOR DRIVING MARKET GROWTH
TABLE 25 GLOBAL MARKET FOR HOME CARE SETTINGS, BY COUNTRY, 2018–2025 (USD MILLION)
10.3 HOSPITALS & CLINICS
10.3.1 HIGH USAGE OF AUTOINJECTORS IN EMERGENCY CASES IN HOSPITALS & CLINICS WILL DRIVE MARKET GROWTH
TABLE 26 GLOBAL MARKET FOR HOSPITALS & CLINICS, BY COUNTRY, 2018–2025 (USD MILLION)
10.4 AMBULATORY CARE SETTINGS
10.4.1 INCREASING NUMBER OF PATIENTS IN AMBULATORY CARE SETTINGS TO DRIVE THE DEMAND FOR AUTOINJECTORS
TABLE 27 GLOBAL MARKET FOR AMBULATORY CARE SETTINGS, BY COUNTRY, 2018–2025 (USD MILLION)
11 AUTOINJECTORS MARKET, BY REGION (Page No. - 93)
11.1 REGIONAL COVID-19 IMPACT: SUMMARY
11.2 INTRODUCTION
FIGURE 29 GLOBAL MARKET: GEOGRAPHIC GROWTH OPPORTUNITIES
TABLE 28 GLOBAL MARKET, BY REGION, 2018–2025 (USD MILLION)
11.3 NORTH AMERICA
FIGURE 30 NORTH AMERICA: AUTOINJECTORS MARKET SNAPSHOT
TABLE 29 NORTH AMERICA: MARKET, BY COUNTRY, 2018–2025 (USD MILLION)
TABLE 30 NORTH AMERICA: MARKET, BY THERAPY, 2018–2025 (USD MILLION)
TABLE 31 NORTH AMERICA: MARKET, BY TYPE, 2018–2025 (USD MILLION)
TABLE 32 NORTH AMERICA: MARKET, BY ROUTE OF ADMINISTRATION, 2018–2025 (USD MILLION)
TABLE 33 NORTH AMERICA: MARKET, BY END USER, 2018–2025 (USD MILLION)
11.3.1 US
11.3.1.1 The US is the largest market for autoinjectors in North America
TABLE 34 AUTOINJECTORS APPROVED BY THE FDA, 2017-2019
TABLE 35 US: AUTOINJECTORS MARKET, BY THERAPY, 2018–2025 (USD MILLION)
TABLE 36 US: MARKET, BY TYPE, 2018–2025 (USD MILLION)
TABLE 37 US: MARKET, BY ROUTE OF ADMINISTRATION, 2018–2025 (USD MILLION)
TABLE 38 US: MARKET, BY END USER, 2018–2025 (USD MILLION)
11.3.2 CANADA
11.3.2.1 Rising prevalence of chronic diseases to drive the market growth
TABLE 39 CANADA: AUTOINJECTORS MARKET, BY THERAPY, 2018–2025 (USD MILLION)
TABLE 40 CANADA: MARKET, BY TYPE, 2018–2025 (USD MILLION)
TABLE 41 CANADA: MARKET, BY ROUTE OF ADMINISTRATION, 2018–2025 (USD MILLION)
TABLE 42 CANADA: MARKET, BY END USER, 2018–2025 (USD MILLION)
11.4 EUROPE
FIGURE 31 EUROPE: AUTOINJECTORS MARKET SNAPSHOT
TABLE 43 EUROPE: MARKET, BY COUNTRY, 2018–2025 (USD MILLION)
TABLE 44 EUROPE: MARKET, BY THERAPY, 2018–2025 (USD MILLION)
TABLE 45 EUROPE: MARKET, BY TYPE, 2018–2025 (USD MILLION)
TABLE 46 EUROPE: MARKET, BY ROUTE OF ADMINISTRATION, 2018–2025 (USD MILLION)
TABLE 47 EUROPE: MARKET, BY END USER, 2018–2025 (USD MILLION)
11.4.1 GERMANY
11.4.1.1 Germany is the largest market for autoinjectors in Europe
TABLE 48 GERMANY: AUTOINJECTORS MARKET, BY THERAPY, 2018–2025 (USD MILLION)
TABLE 49 GERMANY: MARKET, BY TYPE, 2018–2025 (USD MILLION)
TABLE 50 GERMANY: MARKET, BY ROUTE OF ADMINISTRATION, 2018–2025 (USD MILLION)
TABLE 51 GERMANY: MARKET, BY END USER, 2018–2025 (USD MILLION)
11.4.2 UK
11.4.2.1 The UK has the highest rate of allergic conditions globally—a key factor expected to boost the market growth
TABLE 52 UK: AUTOINJECTORS MARKET, BY THERAPY, 2018–2025 (USD MILLION)
TABLE 53 UK: MARKET, BY TYPE, 2018–2025 (USD MILLION)
TABLE 54 UK: MARKET, BY ROUTE OF ADMINISTRATION, 2018–2025 (USD MILLION)
TABLE 55 UK: MARKET, BY END USER, 2018–2025 (USD MILLION)
11.4.3 FRANCE
11.4.3.1 Rising geriatric population to support market growth
TABLE 56 FRANCE: AUTOINJECTORS MARKET, BY THERAPY, 2018–2025 (USD MILLION)
TABLE 57 FRANCE: MARKET, BY TYPE, 2018–2025 (USD MILLION)
TABLE 58 FRANCE: MARKET, BY ROUTE OF ADMINISTRATION, 2018–2025 (USD MILLION)
TABLE 59 FRANCE: MARKET, BY END USER, 2018–2025 (USD MILLION)
11.4.4 ITALY
11.4.4.1 Improving economic conditions and rising per capita income to propel market growth
TABLE 60 ITALY: AUTOINJECTORS MARKET, BY THERAPY, 2018–2025 (USD MILLION)
TABLE 61 ITALY: MARKET, BY TYPE, 2018–2025 (USD MILLION)
TABLE 62 ITALY: MARKET, BY ROUTE OF ADMINISTRATION, 2018–2025 (USD MILLION)
TABLE 63 ITALY: MARKET, BY END USER, 2018–2025 (USD MILLION)
11.4.5 SPAIN
11.4.5.1 Favorable reimbursement scenario coupled with the rising prevalence of chronic diseases to support market growth
TABLE 64 SPAIN: AUTOINJECTORS MARKET, BY THERAPY, 2018–2025 (USD MILLION)
TABLE 65 SPAIN: MARKET, BY TYPE, 2018–2025 (USD MILLION)
TABLE 66 SPAIN: MARKET, BY ROUTE OF ADMINISTRATION, 2018–2025 (USD MILLION)
TABLE 67 SPAIN: MARKET, BY END USER, 2018–2025 (USD MILLION)
11.4.6 REST OF EUROPE
TABLE 68 ROE: AUTOINJECTORS MARKET, BY THERAPY, 2018–2025 (USD MILLION)
TABLE 69 ROE: MARKET, BY TYPE, 2018–2025 (USD MILLION)
TABLE 70 ROE: MARKET, BY ROUTE OF ADMINISTRATION, 2018–2025 (USD MILLION)
TABLE 71 ROE: MARKET, BY END USER, 2018–2025 (USD MILLION)
11.5 ASIA PACIFIC
FIGURE 32 ASIA PACIFIC: AUTOINJECTORS MARKET SNAPSHOT
TABLE 72 ASIA PACIFIC: MARKET, BY COUNTRY, 2018–2025 (USD MILLION)
TABLE 73 ASIA PACIFIC: MARKET, BY THERAPY, 2018–2025 (USD MILLION)
TABLE 74 ASIA PACIFIC: MARKET, BY TYPE, 2018–2025 (USD MILLION)
TABLE 75 ASIA PACIFIC: MARKET, BY ROUTE OF ADMINISTRATION, 2018–2025 (USD MILLION)
TABLE 76 ASIA PACIFIC: MARKET, BY END USER, 2018–2025 (USD MILLION)
11.5.1 JAPAN
11.5.1.1 High adoption of autoinjectors and approval of several injectable devices to boost the market growth
TABLE 77 JAPAN: AUTOINJECTORS MARKET, BY THERAPY, 2018–2025 (USD MILLION)
TABLE 78 JAPAN: MARKET, BY TYPE, 2018–2025 (USD MILLION)
TABLE 79 JAPAN: MARKET, BY ROUTE OF ADMINISTRATION, 2018–2025 (USD MILLION)
TABLE 80 JAPAN: MARKET, BY END USER, 2018–2025 (USD MILLION)
11.5.2 CHINA
11.5.2.1 Food allergies and anaphylaxis have become a major public health burden in China
TABLE 81 CHINA: AUTOINJECTORS MARKET, BY THERAPY, 2018–2025 (USD MILLION)
TABLE 82 CHINA: MARKET, BY TYPE, 2018–2025 (USD MILLION)
TABLE 83 CHINA: MARKET, BY ROUTE OF ADMINISTRATION, 2018–2025 (USD MILLION)
TABLE 84 CHINA: MARKET, BY END USER, 2018–2025 (USD MILLION)
11.5.3 INDIA
11.5.3.1 Increasing burden of chronic diseases such as diabetes and CVD is expected to drive the demand for autoinjectors in India
TABLE 85 INDIA: AUTOINJECTORS MARKET, BY THERAPY, 2018–2025 (USD MILLION)
TABLE 86 INDIA: MARKET, BY TYPE, 2018–2025 (USD MILLION)
TABLE 87 INDIA: MARKET, BY ROUTE OF ADMINISTRATION, 2018–2025 (USD MILLION)
TABLE 88 INDIA: MARKET, BY END USER, 2018–2025 (USD MILLION)
11.5.4 ROAPAC
TABLE 89 ROAPAC: AUTOINJECTORS MARKET, BY THERAPY, 2018–2025 (USD MILLION)
TABLE 90 ROAPAC: MARKET, BY TYPE, 2018–2025 (USD MILLION)
TABLE 91 ROAPAC: MARKET, BY ROUTE OF ADMINISTRATION, 2018–2025 (USD MILLION)
TABLE 92 ROAPAC: MARKET, BY END USER, 2018–2025 (USD MILLION)
11.6 LATIN AMERICA
11.6.1 RISING ELDERLY POPULATION IN COUNTRIES SUCH AS BRAZIL AND MEXICO TO SUPPORT MARKET GROWTH
TABLE 93 LATIN AMERICA: AUTOINJECTORS MARKET, BY THERAPY, 2018–2025 (USD MILLION)
TABLE 94 LATIN AMERICA: MARKET, BY TYPE, 2018–2025 (USD MILLION)
TABLE 95 LATIN AMERICA: MARKET, BY ROUTE OF ADMINISTRATION, 2018–2025 (USD MILLION)
TABLE 96 LATIN AMERICA: MARKET, BY END USER, 2018–2025 (USD MILLION)
11.7 MIDDLE EAST & AFRICA
11.7.1 IMPLEMENTATION OF FAVORABLE REFORMS IN AFRICA AS WELL AS MIDDLE EASTERN COUNTRIES TO DRIVE MARKET GROWTH
TABLE 97 MEA: AUTOINJECTORS MARKET, BY THERAPY, 2018–2025 (USD MILLION)
TABLE 98 MEA: MARKET, BY TYPE, 2018–2025 (USD MILLION)
TABLE 99 MEA: MARKET, BY ROUTE OF ADMINISTRATION, 2018–2025 (USD MILLION)
TABLE 100 MEA: MARKET, BY END USER, 2018–2025 (USD MILLION)
12 COMPANY EVALUATION MATRIX (Page No. - 134)
12.1 MARKET SHARE ANALYSIS
FIGURE 33 AUTOINJECTORS MARKET SHARE ANALYSIS, BY KEY PLAYER, 2019
12.2 VENDOR DIVE
12.2.1 STARS
12.2.2 EMERGING LEADERS
12.2.3 PERVASIVE PLAYERS
12.2.4 EMERGING COMPANIES
FIGURE 34 AUTOINJECTORS MARKET: COMPETITIVE LEADERSHIP MAPPING, 2019
12.3 COMPETITIVE LEADERSHIP MAPPING FOR SMALL & MEDIUM-SIZED ENTERPRISES (SMES)/STARTUPS
12.3.1 PROGRESSIVE COMPANIES
12.3.2 STARTING BLOCKS
12.3.3 RESPONSIVE COMPANIES
12.3.4 DYNAMIC COMPANIES
FIGURE 35 AUTOINJECTORS MARKET: COMPETITIVE LEADERSHIP MAPPING FOR START-UPS, 2019
13 COMPETITIVE LANDSCAPE (Page No. - 139)
13.1 INTRODUCTION
FIGURE 36 KEY DEVELOPMENTS IN THE AUTOINJECTORS MARKET
FIGURE 37 GROWTH STRATEGY MATRIX
13.2 PRODUCT PORTFOLIO MATRIX
13.2.1 THERAPY
13.3 AUTOINJECTORS MARKET: GEOGRAPHICAL ASSESSMENT
FIGURE 38 GEOGRAPHIC ASSESSMENT OF KEY PLAYERS IN THE AUTOINJECTORS MARKET (2019)
13.4 AUTOINJECTORS MARKET: R&D EXPENDITURE
FIGURE 39 R&D EXPENDITURE OF KEY PLAYERS IN THE AUTOINJECTORS MARKET (2019)
13.5 COMPETITIVE SITUATIONS AND TRENDS
13.5.1 PRODUCT LAUNCHES & APPROVALS
TABLE 101 PRODUCT LAUNCHES & APPROVALS (2018–2020)
13.5.2 PARTNERSHIPS, COLLABORATIONS, AND AGREEMENTS
TABLE 102 PARTNERSHIPS, COLLABORATIONS, AND AGREEMENTS (2018–2020)
13.5.3 ACQUISITIONS
TABLE 103 ACQUISITIONS (2020)
13.5.4 EXPANSIONS
TABLE 104 EXPANSIONS (2018–2020)
13.5.5 OTHER DEVELOPMENTS
TABLE 105 OTHER DEVELOPMENTS (2019–2020)
14 COMPANY PROFILES (Page No. - 146)
14.1 ABBVIE INC.
FIGURE 40 ABBVIE INC.: COMPANY SNAPSHOT (2019)
14.2 AMGEN
FIGURE 41 AMGEN: COMPANY SNAPSHOT (2019)
14.3 ELI LILLY AND COMPANY
FIGURE 42 ELI LILLY AND COMPANY: COMPANY SNAPSHOT (2019)
14.4 MYLAN
FIGURE 43 MYLAN: COMPANY SNAPSHOT (2019)
14.5 YPSOMED
FIGURE 44 YPSOMED: COMPANY SNAPSHOT (2019)
14.6 BECTON, DICKINSON AND COMPANY
FIGURE 45 BD: COMPANY SNAPSHOT (2019)
14.7 GLAXOSMITHKLINE PLC
FIGURE 46 GLAXOSMITHKLINE PLC: COMPANY SNAPSHOT (2019)
14.8 JOHNSON & JOHNSON (J&J)
FIGURE 47 JOHNSON & JOHNSON: COMPANY SNAPSHOT (2019)
14.9 TEVA PHARMACEUTICAL INDUSTRIES
FIGURE 48 TEVA PHARMACEUTICAL INDUSTRIES: COMPANY SNAPSHOT (2019)
14.10 ANTARES PHARMA, INC.
FIGURE 49 ANTARES PHARMA: COMPANY SNAPSHOT (2019)
14.11 MERCK KGAA
FIGURE 50 MERCK KGAA: COMPANY SNAPSHOT (2019)
14.12 MERIDIAN MEDICAL TECHNOLOGIES, INC. (A PFIZER COMPANY)
FIGURE 51 PFIZER: COMPANY SNAPSHOT (2019)
14.13 F. HOFFMANN-LA ROCHE
FIGURE 52 F. HOFFMANN-LA ROCHE LTD.: COMPANY SNAPSHOT (2019)
14.14 BESPAK
FIGURE 53 CONSORT MEDICAL PLC: COMPANY SNAPSHOT (2019)
14.15 BAYER AG
FIGURE 54 BAYER AG: COMPANY SNAPSHOT (2019)
14.16 BRISTOL-MYERS SQUIBB COMPANY
FIGURE 55 BRISTOL-MYERS SQUIBB COMPANY: COMPANY SNAPSHOT (2019)
14.17 SHL MEDICAL
14.18 HASELMEIER
14.19 OWEN MUMFORD
14.20 RAVIMED
14.21 MEDECA PHARMA AB
15 ADJACENT/RELATED MARKET – PHARMACEUTICAL DRUG DELIVERY MARKET (Page No. - 184)
15.1 INTRODUCTION
15.2 PHARMACEUTICAL DRUG DELIVERY MARKET
15.2.1 MARKET DEFINITION
15.2.2 INCLUSIONS & EXCLUSIONS
15.2.3 LIMITATIONS
15.2.4 MARKET OVERVIEW
15.3 PHARMACEUTICAL DRUG DELIVERY MARKET, BY REGION
TABLE 106 DRUG DELIVERY TECHNOLOGY MARKET, BY REGION, 2016–2019 (USD BILLION)
TABLE 107 DRUG DELIVERY TECHNOLOGY MARKET, BY REGION, 2020–2025 (USD BILLION)
15.4 PHARMACEUTICAL DRUG DELIVERY MARKET FOR ORAL DRUG DELIVERY TECHNOLOGY
TABLE 108 ORAL DRUG DELIVERY TECHNOLOGY MARKET, BY COUNTRY, 2016–2019 (USD BILLION)
TABLE 109 ORAL DRUG DELIVERY TECHNOLOGY MARKET, BY COUNTRY, 2020–2025 (USD BILLION)
TABLE 110 ORAL DRUG DELIVERY TECHNOLOGY MARKET, BY DOSAGE FORM, 2016–2019 (USD BILLION)
TABLE 111 ORAL DRUG DELIVERY TECHNOLOGY MARKET, BY DOSAGE FORM, 2020–2025 (USD BILLION)
TABLE 112 ORAL DRUG DELIVERY TECHNOLOGY MARKET FOR SOLID DRUGS, BY DOSAGE FORM, 2016–2019 (USD BILLION
TABLE 113 ORAL DRUG DELIVERY TECHNOLOGY MARKET FOR SOLID DRUGS, BY DOSAGE FORM, 2020–2025 (USD BILLION)
TABLE 114 ORAL DRUG DELIVERY TECHNOLOGY MARKET FOR SOLID DRUGS, BY REGION, 2016–2019 (USD BILLION)
TABLE 115 ORAL DRUG DELIVERY TECHNOLOGY MARKET FOR SOLID DRUGS, BY REGION, 2020–2025 (USD BILLION)
TABLE 116 TABLETS MARKET, BY REGION, 2016–2019 (USD BILLION)
TABLE 117 TABLETS MARKET, BY REGION, 2020–2025 (USD BILLION)
TABLE 118 CAPSULES MARKET, BY REGION, 2016–2019 (USD BILLION)
TABLE 119 CAPSULES MARKET, BY REGION, 2020–2025 (USD BILLION)
TABLE 120 POWDERS MARKET, BY REGION, 2016–2019 (USD BILLION)
TABLE 121 POWDERS MARKET, BY REGION, 2020–2025 (USD BILLION)
TABLE 122 PILLS MARKET, BY REGION, 2016–2019 (USD BILLION)
TABLE 123 PILLS MARKET, BY REGION, 2020–2025 (USD BILLION)
TABLE 124 ORAL DRUG DELIVERY TECHNOLOGY MARKET FOR LIQUID DRUGS, BY DOSAGE FORM, 2016–2019 (USD BILLION)
TABLE 125 ORAL DRUG DELIVERY TECHNOLOGY MARKET FOR LIQUID DRUGS, BY DOSAGE FORM, 2020–2025 (USD BILLION)
TABLE 126 ORAL DRUG DELIVERY TECHNOLOGY MARKET FOR LIQUID DRUGS, BY REGION, 2016–2019 (USD BILLION)
TABLE 127 ORAL DRUG DELIVERY TECHNOLOGY MARKET FOR LIQUID DRUGS, BY REGION, 2020–2025 (USD BILLION)
15.5 PHARMACEUTICAL DRUG DELIVERY MARKET, BY ROUTE OF ADMINISTRATION
TABLE 128 DRUG DELIVERY TECHNOLOGY MARKET, BY ROUTE OF ADMINISTRATION, 2016–2019 (USD BILLION)
TABLE 129 DRUG DELIVERY TECHNOLOGY MARKET, BY ROUTE OF ADMINISTRATION, 2020–2025 (USD BILLION)
15.6 PHARMACEUTICAL DRUG DELIVERY MARKET, BY FACILITY OF USE
TABLE 130 DRUG DELIVERY TECHNOLOGY MARKET, BY FACILITY OF USE, 2016–2019 (USD BILLION)
TABLE 131 DRUG DELIVERY TECHNOLOGY MARKET, BY FACILITY OF USE, 2020–2025 (USD BILLION)
TABLE 132 DRUG DELIVERY TECHNOLOGY MARKET FOR HOSPITALS, BY REGION, 2016–2019 (USD BILLION)
TABLE 133 DRUG DELIVERY TECHNOLOGY MARKET FOR HOSPITALS, BY REGION, 2020–2025 (USD BILLION)
15.6.1 AMBULATORY SURGERY CENTERS/CLINICS
15.6.1.1 increasing preference for ASCs has resulted in a significant rise in demand for drug delivery technologies
TABLE 134 DRUG DELIVERY TECHNOLOGY MARKET FOR AMBULATORY SURGERY CENTERS/CLINICS, BY REGION, 2016–2019 (USD BILLION)
TABLE 135 DRUG DELIVERY TECHNOLOGY MARKET FOR AMBULATORY SURGERY CENTERS/CLINICS, BY REGION, 2020–2025 (USD BILLION)
15.6.2 HOME CARE SETTINGS
15.6.2.1 Home care settings to register the highest growth rate during the forecast period
TABLE 136 DRUG DELIVERY TECHNOLOGY MARKET FOR HOME CARE SETTINGS, BY REGION, 2016–2019 (USD BILLION)
TABLE 137 DRUG DELIVERY TECHNOLOGY MARKET FOR HOME CARE SETTINGS, BY REGION, 2020–2025 (USD BILLION)
15.6.3 DIAGNOSTIC CENTERS
15.6.3.1 Rising prevalence of chronic diseases to support market growth
TABLE 138 DRUG DELIVERY TECHNOLOGY MARKET FOR DIAGNOSTIC CENTERS, BY REGION, 2016–2019 (USD BILLION)
TABLE 139 DRUG DELIVERY TECHNOLOGY MARKET FOR DIAGNOSTIC CENTERS, BY REGION, 2020–2025 (USD BILLION)
15.6.4 OTHER FACILITIES OF USE
TABLE 140 DRUG DELIVERY TECHNOLOGY MARKET FOR OTHER FACILITIES OF USE, BY REGION, 2016–2019 (USD BILLION)
TABLE 141 DRUG DELIVERY TECHNOLOGY MARKET FOR OTHER FACILITIES OF USE, BY REGION, 2020–2025 (USD BILLION)
15.7 PHARMACEUTICAL DRUG DELIVERY MARKET, BY APPLICATION
TABLE 142 DRUG DELIVERY TECHNOLOGY MARKET, BY APPLICATION, 2016–2019 (USD BILLION)
TABLE 143 DRUG DELIVERY TECHNOLOGY MARKET, BY APPLICATION, 2020–2025 (USD BILLION)
TABLE 144 DRUG DELIVERY TECHNOLOGY MARKET FOR INFECTIOUS DISEASES, BY REGION, 2016–2019 (USD BILLION)
TABLE 145 DRUG DELIVERY TECHNOLOGY MARKET FOR INFECTIOUS DISEASES, BY REGION, 2020–2025 (USD BILLION)
TABLE 146 DRUG DELIVERY TECHNOLOGY MARKET FOR CANCER, BY REGION, 2016–2019 (USD BILLION)
TABLE 147 DRUG DELIVERY TECHNOLOGY MARKET FOR CANCER, BY REGION, 2020–2025 (USD BILLION)
TABLE 148 DRUG DELIVERY TECHNOLOGY MARKET FOR CARDIOVASCULAR DISEASES, BY REGION, 2016–2019 (USD BILLION)
TABLE 149 DRUG DELIVERY TECHNOLOGY MARKET FOR CARDIOVASCULAR DISEASES, BY REGION, 2020–2025 (USD BILLION)
TABLE 150 DRUG DELIVERY TECHNOLOGY MARKET FOR DIABETES, BY REGION, 2016–2019 (USD BILLION)
TABLE 151 DRUG DELIVERY TECHNOLOGY MARKET FOR DIABETES, BY REGION, 2020–2025 (USD BILLION)
TABLE 152 DRUG DELIVERY TECHNOLOGY MARKET FOR RESPIRATORY DISEASES, BY REGION, 2016–2019 (USD BILLION)
TABLE 153 DRUG DELIVERY TECHNOLOGY MARKET FOR RESPIRATORY DISEASES, BY REGION, 2020–2025 (USD BILLION)
TABLE 154 DRUG DELIVERY TECHNOLOGY MARKET FOR CENTRAL NERVOUS SYSTEM DISORDERS, BY REGION, 2016–2019 (USD BILLION)
TABLE 155 DRUG DELIVERY TECHNOLOGY MARKET FOR CENTRAL NERVOUS SYSTEM DISORDERS, BY REGION, 2020–2025 (USD BILLION)
TABLE 156 DRUG DELIVERY TECHNOLOGY MARKET FOR AUTOIMMUNE DISEASES, BY REGION, 2016–2019 (USD BILLION)
TABLE 157 DRUG DELIVERY TECHNOLOGY MARKET FOR AUTOIMMUNE DISEASES, BY REGION, 2020–2025 (USD BILLION)
TABLE 158 DRUG DELIVERY TECHNOLOGY MARKET FOR OTHER APPLICATIONS, BY REGION, 2016–2019 (USD BILLION)
TABLE 159 DRUG DELIVERY TECHNOLOGY MARKET FOR OTHER APPLICATIONS, BY REGION, 2020–2025 (USD BILLION)
16 APPENDIX (Page No. - 206)
16.1 INSIGHTS FROM INDUSTRY EXPERTS
16.2 DISCUSSION GUIDE
16.3 KNOWLEDGE STORE: MARKETSANDMARKETS’ SUBSCRIPTION PORTAL
16.4 AVAILABLE CUSTOMIZATIONS
16.5 RELATED REPORTS
16.6 AUTHOR DETAILS
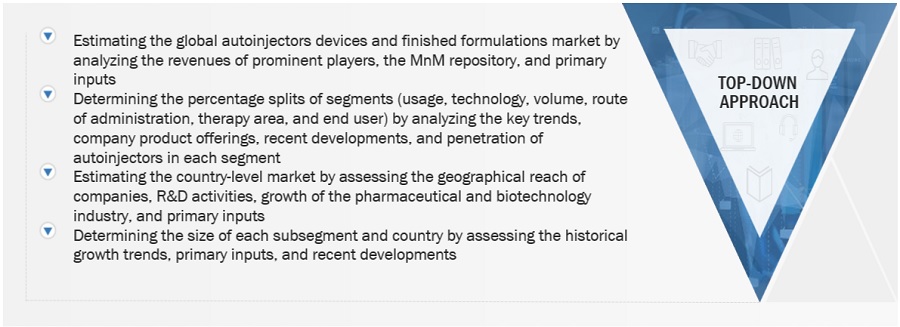
This study involved four major activities in estimating the current autoinjectors market size. Exhaustive research was conducted to collect information on the market as well as its peer and parent markets. The next step was to validate these findings, assumptions, and sizing with industry experts across the value chain through primary research. Both top-down and bottom-up approaches were employed to estimate the number of breast lesion localization procedures and the value market. After that, market breakdown and data triangulation procedures were used to estimate the market size of segments and subsegments.
Secondary Research
This research study involved the usage of widespread secondary sources; directories; databases such as Bloomberg Business, Factiva, and Dun & Bradstreet; white papers; annual reports; company house documents; investor presentations; and SEC filings of companies. Secondary research was used to identify and collect information useful for the extensive, technical, market-oriented, and commercial study of the market. It was also used to obtain important information about the key players, market classification and segmentation according to industry trends to the bottom-most level, and key developments related to market and technology perspectives.
Primary Research
The autoinjectors market comprises several stakeholders, such as raw material suppliers, manufacturers of autoinjectors devices, and regulatory organizations in the supply chain. Various primary sources from both the supply and demand sides of the market were interviewed to obtain qualitative and quantitative information. The primary interviewees from the demand side include professionals such as company vice presidents, company’s C-level executives, managers, product managers, department heads, professors, and research scientists. The primary sources from the supply side include key CEOs, VPs and managing directors, marketing heads/directors and sales directors, marketing managers, regional/area sales managers, export/import, heads/managers, and product managers/technology experts.
Market Size Estimation
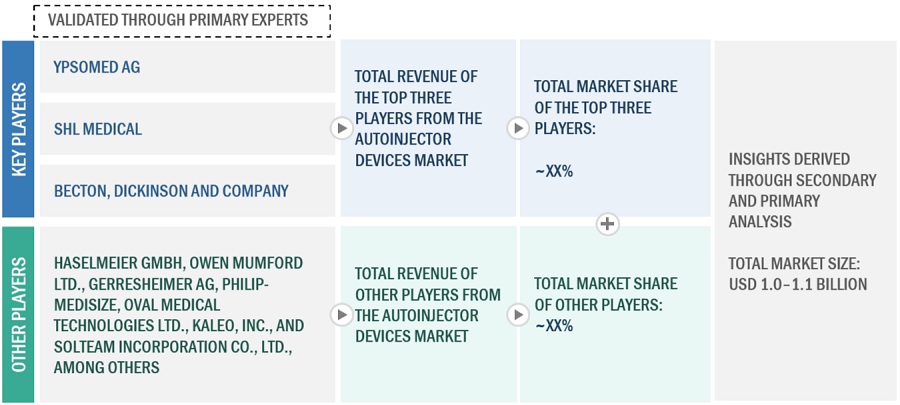
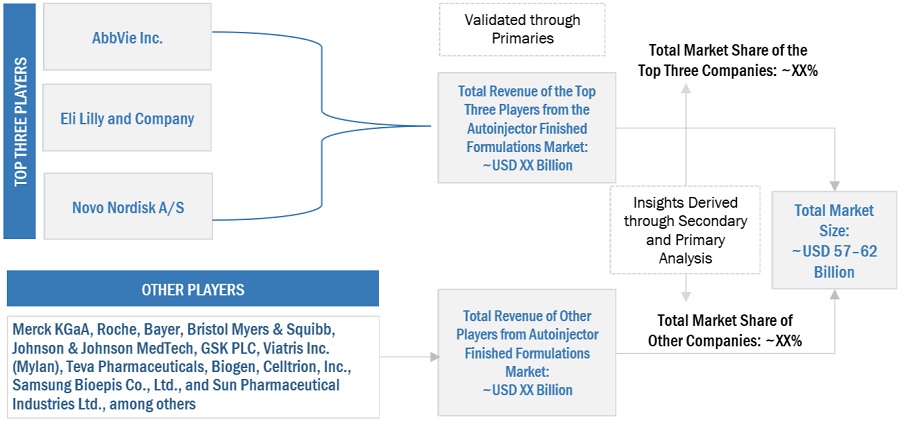
Both the top-down and bottom-up approaches were used to estimate and validate the total size of the autoinjectors market (value and volume). These approaches were also used extensively to estimate the size of various subsegments in the market. After arriving at the overall market size—using the market size estimation processes explained above—the market was split into several segments and subsegments. To complete the overall market engineering process and arrive at the exact statistics of each market segment and subsegment, data triangulation, and market breakdown procedures were employed, wherever applicable. The data was triangulated by studying various factors and trends from both the demand and supply sides of the autoinjectors industry.
To know about the assumptions considered for the study, download the pdf brochure
Data Triangulation
After arriving at the overall market size-using the market size estimation processes as explained above-the market was split into several segments and subsegments. In order to complete the overall market engineering process and arrive at the exact statistics of each market segment and subsegment, the data triangulation and market breakdown procedures were employed, wherever applicable. The data was triangulated by studying various factors and trends from both, the demand and supply sides.
Approach to calculate the revenue of different players in the autoinjectors market
The size of the global autoinjectors market was obtained from annual reports, SEC filings, online publications, and extensive primary interviews. A percentage split was applied to arrive at the size of market segments. Further splits were applied to arrive at the size for each sub-segment. Primary participants validated these percentage splits. The country-level market sizes obtained from the annual reports, SEC filings, online publications, and extensive primary interviews were added up to reach the total market size for regions. By adding up the market sizes for all the regions, the global autoinjectors market was derived.
Approach to derive the market size and estimate market growth
The market size and market growth were estimated through primary interviews on a regional and global level. All responses were collated, and a weighted average was taken to derive a probabilistic estimate of the market size and growth rate.
Objectives of the Study
- To define, describe, analyze, and forecast the autoinjectors market by therapy, type, route of administration, end user and region
- To provide detailed information about the major factors influencing the market growth (such as drivers, restraints, opportunities, and challenges)
- To strategically analyze micromarkets with respect to individual growth trends, prospects, and contributions to the overall autoinjectors market
- To analyze market opportunities for stakeholders and provide details of the competitive landscape for key players
- To forecast the size of market segments in North America, Europe, the Asia Pacific, Latin America, and the Middle East & Africa
- To profile key players and comprehensively analyze their market shares and core competencies in the autoinjectors market
- To track and analyze competitive developments such as partnerships, agreements, acquisitions, product launches, and expansions in the autoinjectors market
Available Customizations
With the given market data, MarketsandMarkets offers customizations as per the company’s specific needs. The following customization options are available for the report:
Product Analysis
- Product matrix, which gives a detailed comparison of the product portfolios of the top companies
Geographic Analysis
- Further breakdown of the RoAPAC market into South Korea, New Zealand, and other countries Further breakdown of the RoE market into Belgium, Russia, the Netherlands, Switzerland, and other countries
Growth opportunities and latent adjacency in Autoinjectors Market