Automatic Bending Machine Market by Type (Automatic and Semiautomatic), Technology (Electric, Hydraulic, Pneumatic, and Induction Based), Application (Tube/Pipe, Metal Sheet, Bar), Industry, and Region - Global Forecast to 2025-2036


The global automatic bending machine market was valued at USD 2.31 billion in 2025 and is estimated to reach USD 3.94 billion by 2036, at a CAGR of 4.6% between 2025 and 2036.
The global automatic bending machine market is driven by the growing demand for precision metal forming and increased automation in manufacturing and fabrication industries. Rising adoption in automotive, aerospace, construction, and electrical sectors to improve production efficiency and reduce labor costs is fueling market growth. Technological advancements in CNC systems, robotics integration, and digital controls are enhancing flexibility and accuracy. Manufacturers are focusing on innovation, energy efficiency, and global expansion to meet evolving industrial and customization requirements.

Automatic bending machines are precision equipment designed to bend metal sheets, pipes, or bars with high accuracy and consistency. They offer automated operation, improved productivity, and reduced manual effort, making them essential in automotive, aerospace, construction, and electrical industries. Featuring CNC control, programmable settings, and energy-efficient performance, these machines ensure uniform bending quality and faster production cycles.
Market by Type
Automatic
The automatic segment accounts for a significant share of the automatic bending machine market, driven by rising demand for high-precision, fully programmable manufacturing solutions. Automatic bending machines offer superior accuracy, repeatability, and speed, making them indispensable in industries such as automotive, aerospace, and metal fabrication. These machines integrate CNC control systems, servo motors, and advanced software interfaces that enable complex bending operations with minimal human intervention. Their adoption enhances production efficiency, reduces material waste, and ensures consistent product quality. Moreover, growing emphasis on automation and smart factory environments is further accelerating the deployment of automatic bending machines in large-scale production lines.
Semiautomatic
The semiautomatic segment continues to serve as an essential solution for small and medium-scale manufacturers seeking a balance between cost-effectiveness and operational control. These machines combine manual setup flexibility with partial automation, allowing operators to adjust bending parameters while maintaining accuracy and productivity. Semiautomatic bending machines are widely used in workshops, maintenance facilities, and fabrication units where product customization and lower production volumes are common. Their relatively lower capital investment and easier maintenance make them suitable for businesses transitioning toward automation or operating in cost-sensitive markets.
Market by Technology
Electric
Electric bending machines are increasingly gaining traction due to their energy efficiency, precision, and eco-friendly operation. They employ servo-electric drives that deliver high accuracy and repeatability, while eliminating the need for hydraulic fluids, thereby reducing maintenance requirements and environmental impact. Electric systems are particularly preferred in industries demanding quiet operation, low energy consumption, and high precision, such as electronics, medical devices, and automotive component manufacturing. Furthermore, the integration of digital control technologies and real-time monitoring features enhances process optimization, aligning electric bending machines with Industry 4.0 initiatives.
Hydraulic
Hydraulic bending machines remain widely adopted for heavy-duty applications where high force output and material thickness handling are critical. They are particularly suitable for sectors such as construction, shipbuilding, and heavy equipment manufacturing. Hydraulic systems offer superior bending power and durability, enabling them to handle thicker and tougher metals with consistency. Despite higher maintenance and energy consumption compared to electric variants, their robustness and cost-effectiveness for large-scale operations continue to sustain demand. Ongoing innovations in hydraulic control systems and energy-efficient pumps are further improving their performance and operational reliability.
Market by Geography
Geographically, the automatic bending machine market is experiencing strong growth across North America, Europe, Asia Pacific, and the Rest of the World (ROW). Asia Pacific leads the market, supported by rapid industrialization, booming automotive and construction sectors, and increasing investments in manufacturing automation. Europe follows closely, driven by the demand for precision metal forming in aerospace, electronics, and machinery production, alongside Industry 4.0 initiatives. North America exhibits steady growth owing to rising adoption of advanced CNC bending systems in metal fabrication and infrastructure projects. Meanwhile, the Middle East, Africa, and South America are emerging as promising markets, propelled by expanding industrial bases, infrastructure modernization, and growing emphasis on cost-efficient, high-precision manufacturing technologies across diverse end-use industries.
Market Dynamics
Driver: Growing adoption of safe and precise programmable bending machines
Programmable bending machines, primarily electrically powered, enable highly precise and repeatable bends with minimal manual effort or guesswork. These machines receive dimensional inputs for tubes, pipes, bars, and metal sheets directly from operators and automatically perform bending operations based on specified requirements. Depending on the application, parameters such as applied force, rotation gauge, and bending angle are calculated to ensure consistent multi-bend part production and superior quality. Many advanced models are equipped with position sensors and cameras to adjust the process dynamically when dimensional or force variations occur. As a result, automated and semi-automated bending machines offer enhanced safety, efficiency, and accuracy compared to traditional manual systems.
Restraint: High maintenance costs and dependence on skilled technicians to limit market growth
Computer numerically controlled (CNC) pipe and tube bending machines offer high flexibility and low setup times, making them ideal for precision manufacturing. However, their operation involves significant maintenance expenses due to complex components and automation systems. Additionally, these machines require highly skilled and trained operators to configure dimensions and manage bending tasks effectively. The scarcity of qualified technicians and the associated training requirements further increase operational costs. Consequently, the high maintenance burden and reliance on skilled personnel are expected to constrain the overall growth of the automatic bending machine market.
Opportunity: Rising integration of robots with bending machines to enhance automation and productivity
The growing emphasis on productivity, precision, and operational efficiency is driving the adoption of automated bending systems integrated with robotic technologies. Robot-assisted bending machines can automatically load and unload tubes, pipes, or metal sheets, significantly improving process accuracy and safety. This integration ensures consistent bending quality, reduces manual intervention, and enhances overall production throughput. Robots can be easily programmed to accommodate different workpiece dimensions, enabling seamless adjustments without process interruptions. By maintaining continuous operation and minimizing downtime, the integration of robots with bending machines enables manufacturers to achieve higher output, better quality control, and improved workplace safety.
Challenge: Dimensional inaccuracies caused by variations in speed, pressure, and material composition
Automated bending machines rely on operator-fed dimensional inputs to perform bending operations on metal sheets, bars, tubes, or pipes. However, inconsistencies in material composition, such as varying alloy mixtures even within components of identical dimensions, can lead to deformation during bending. Similarly, fluctuations in bending speed and pressure can cause distortions that affect product precision. Since automated systems apply uniform settings regardless of subtle input differences, they often fail to distinguish between good- and poor-quality outputs. These variations reduce dimensional accuracy and increase the risk of deformation, posing a significant challenge for maintaining consistent product quality in the automated bending machine market.
Future Outlook
Between 2025 and 2036, the automatic bending machine market is expected to grow steadily, driven by rising demand for precision metal forming and increased automation across manufacturing sectors. Expanding applications in automotive, aerospace, construction, and electrical industries will support adoption as manufacturers focus on productivity, accuracy, and cost efficiency. Advancements in CNC technology, robotics, and digital control systems will enhance flexibility and operational reliability. As industries emphasize customization, energy efficiency, and smart manufacturing, automatic bending machines will play a key role in modern production environments, enabling faster, safer, and more consistent fabrication processes worldwide.
Key Market Players
Top automatic bending machine companies TRUMPF (Germany), AMADA CO., LTD. (Japan), Bystronic Group (Switzerland)
Key Questions addressed in this report:
- What are the global trends in demand for the market?
- What are the upcoming technologies/product areas that will have a significant impact on the market in the future?
- What will be the revenue pockets for the market players in the next 11 years?
- What are the prime strategies followed by key players in the market?
 Exclusive indicates content/data unique to MarketsandMarkets and not available with any competitors.
Table of Contents
1 Introduction (Page No. - 18)
1.1 Study Objectives
1.2 Market Definition & Scope
1.3 Inclusion/Exclusion
1.4 Study Scope
1.4.1 Markets Covered
1.4.2 Geographic Scope
1.4.3 Years Considered
1.5 Currency
1.6 Limitations
1.7 Stakeholders
2 Research Methodology (Page No. - 22)
2.1 Introduction
2.1.1 Secondary and Primary Research
2.1.1.1 Key Industry Insights
2.1.2 Secondary Data
2.1.2.1 List of Major Secondary Sources
2.1.2.2 Key Data From Secondary Sources
2.1.3 Primary Data
2.1.3.1 Breakdown of Primaries
2.1.3.2 Key Data From Primary Sources
2.2 Market Size Estimation
2.2.1 Bottom-Up Approach
2.2.1.1 Approach for Arriving at Market Size Using Bottom-Up Analysis
2.2.2 Top-Down Approach
2.2.2.1 Approach for Arriving at Market Size Using Bottom-Up Analysis
2.3 Market Breakdown and Data Triangulation
2.4 Research Assumptions
3 Executive Summary (Page No. - 31)
4 Premium Insights (Page No. - 36)
4.1 Automatic Bending Machine Market
4.2 Market, By Type (2019–2024)
4.3 Automatic Bending Machine Market, By Application (2019 and 2024)
4.4 Market, By Technology (2019 and 2024)
4.5 Automatic Bending Machine Market, By Industry (2019 and 2024)
4.6 Market, By Region (2019–2024)
5 Market Overview (Page No. - 39)
5.1 Introduction
5.2 Market Dynamics
5.2.1 Drivers
5.2.1.1 Availability of Safe Programmable Bending Machines With High Precision
5.2.2 Restraints
5.2.2.1 High Maintenance Cost and Requirement of Qualified Operators and Maintenance Technicians
5.2.3 Opportunities
5.2.3.1 Integration of Robots With Bending Machines
5.2.4 Challenges
5.2.4.1 Deformation of Metallic Parts Owing to Variations in Speed and Pressure
6 Market, By Type (Page No. - 42)
6.1 Introduction
6.2 Automatic
6.2.1 Automatic Bending Machines Expect to Dominate Market During Forecast Period
6.3 Semiautomatic
6.3.1 Automotive Industry to Witness Highest Demand for Hydraulic Semiautomatic Bending Machines
7 Market, By Technology (Page No. - 50)
7.1 Introduction
7.2 Electric
7.2.1 Electric Automatic Bending Machines Consume Lowest Energy Than That of Other Technologies
7.3 Hydraulic
7.3.1 Automotive Industry to Witness Highest Demand for Hydraulic Automatic Bending Machines
7.4 Pneumatic
7.4.1 Automatic Type Pneumatic Bending Machines to Continue to Hold Larger Market Share Than That of Semiautomatic Type Pneumatic Bending Machines
7.5 Induction Based
7.5.1 Shipbuilding Industry to Exhibit Highest Demand for Induction Technology-Based Automatic Bending Machines
8 Market, By Application (Page No. - 64)
8.1 Introduction
8.2 Tube/Pipe
8.2.1 Tube/Pipe Bending Application to Dominate Automatic Bending Market During Forecast Period
8.3 Metal Sheet
8.3.1 Metal Sheet Bending Application to Lead Market for Automotive Industry During Forecast Period
8.4 Bar
8.4.1 Use of Reinforcement Bar Bending Machines for Making Safer and Stronger Structures in Consturction Industry
9 Market, By Industry (Page No. - 71)
9.1 Introduction
9.2 Automotive
9.2.1 Automotive Industry to Witness Highest CAGR in Market During Forecast Period
9.3 Shipbuilding
9.3.1 Shipbuilding Industry to Account for Largest Market Share in APAC During Forecast Period
9.4 Aerospace & Defense
9.4.1 Electric Bending Machines are Most Preferred in Aerospace & Defense Industry
9.5 Construction and Mining
9.5.1 Construction and Mining Industry to Witness Highest Growth Rate in Market in APAC
9.6 Others
10 Geographic Analysis (Page No. - 88)
10.1 Introduction
10.2 North America
10.2.1 US
10.2.1.1 US to Continue to Account for Largest Share of North American Market for Automatic Bending Machines
10.2.2 Canada
10.2.2.1 Canada to Continue to Account for Second-Largest Share of North American Automatic Bending Machines in Coming Years
10.2.3 Mexico
10.2.3.1 Mexico to Witness Highest CAGR in North American Market for Automatic Bending Machines
10.3 Europe
10.3.1 UK
10.3.1.1 UK to Witness Largest Size of Electric Bending Machine Market During Forecast Period
10.3.2 France
10.3.2.1 Aerospace & Defense Industry to Witness Highest CAGR in Market in France
10.3.3 Germany
10.3.3.1 Innovative Automotive Industry in Germany to Drive Demand for Automatic Bending Machines
10.3.4 Rest of Europe
10.4 Asia Pacific (APAC)
10.4.1 China
10.4.1.1 China to Account for Largest Size of Market in APAC
10.4.2 Japan
10.4.2.1 Strong Automotive Industry to Drive Japanese Market for Automatic Bending Machines
10.4.3 India
10.4.3.1 India is Expected to Witness Highest CAGR in Market
10.4.4 Rest of APAC
10.5 Rest of The World (RoW)
10.5.1 Middle East and Africa
10.5.2 South America
11 Competitive Landscape (Page No. - 114)
11.1 Overview
11.2 Ranking Analysis of Market Players
11.3 Competitive Leadership Mapping
11.3.1 Visionary Leaders
11.3.2 Innovators
11.3.3 Dynamic Differentiators
11.3.4 Emerging Companies
11.4 Competitive Scenario
11.4.1 Product Launches
11.4.2 Expansions
11.4.3 Agreements
12 Company Profiles (Page No. - 119)
12.1 Key Players
(Business Overview, Products Offered, Recent Developments, SWOT Analysis, and MnM View)*
12.1.1 Trumpf
12.1.2 Amada
12.1.3 Haco
12.1.4 Bystronic
12.1.5 Prima Industrie
12.1.6 Danobatgroup
12.1.7 Wafios
12.1.8 BLM
12.1.9 Transfluid
12.1.10 Amob
* Business Overview, Products Offered, Recent Developments, SWOT Analysis, and MnM View Might Not Be Captured in Case of Unlisted Companies.
12.1.11 Right to Win
12.2 Other Key Players
12.2.1 Shuz Tung Machinery Industrial
12.2.2 Euromac
12.2.3 Soco Machinery
12.2.4 Universal Tool & Engineering
12.2.5 Kersten
12.2.6 Knuth Machine Tools
12.2.7 Dural Machinery
12.2.8 Unison
12.2.9 Horn Machine Tools
12.2.10 Winton Machine Company
13 Appendix (Page No. - 143)
13.1 Insights of Industry Experts
13.2 Discussion Guide
13.3 Knowledge Store: Marketsandmarkets’ Subscription Portal
13.4 Available Customizations
13.5 Related Reports
13.6 Author Details
List of Tables (167 Tables)
Table 1 Automatic Bending Machine Market in South America, By Industry, 2015–2024 (USD Million)
Table 2 Market for Automatic Type, By Technology, 2015–2024 (USD Million)
Table 3 Market for Automatic Type, By Industry, 2015–2024 (USD Million)
Table 4 Market for Automatic Type, By Application, 2015–2024 (USD Million)
Table 5 Market for Automatic Type, By Region, 2015–2024 (USD Million)
Table 6 Market for Automatic Type in North America, By Country, 2015–2024 (USD Million)
Table 7 Automatic Bending Machine Market for Automatic Type in Europe, By Country, 2015–2024 (USD Million)
Table 8 Market for Automatic Type in APAC, By Country, 2015–2024 (USD Million)
Table 9 Market for Automatic Type in RoW, By Region, 2015–2024 (USD Million)
Table 10 Market for Semiautomatic Type, By Technology, 2015–2024 (USD Thousand)
Table 11 Market for Semiautomatic Type, By Industry, 2015–2024 (USD Million)
Table 12 Market for Semiautomatic Type, By Application, 2015–2024 (USD Million)
Table 13 Automatic Bending Machine Market for Semiautomatic Type, By Region, 2015–2024 (USD Million)
Table 14 Market for Semiautomatic Type in North America, By Country, 2015–2024 (USD Million)
Table 15 Market for Semiautomatic Type in Europe, By Country, 2015–2024 (USD Million)
Table 16 Market for Semiautomatic Type in APAC, By Country, 2015–2024 (USD Million)
Table 17 Market for Semiautomatic Type in RoW, By Region, 2015–2024 (USD Million)
Table 18 Market, By Technology, 2015–2024 (USD Million)
Table 19 Electric Automatic Bending Machine Market, By Type, 2015–2024 (USD Million)
Table 20 Electric Market, By Industry, 2015–2024 (USD Million)
Table 21 Electric Market, By Application, 2015–2024 (USD Million)
Table 22 Electric Market, By Region, 2015–2024 (USD Million)
Table 23 Electric Market in North America, By Country, 2015–2024 (USD Million)
Table 24 Electric Market, By Country, 2015–2024 (USD Million)
Table 25 Electric Market in APAC, By Country, 2015–2024 (USD Million)
Table 26 Electric Market in RoW, By Region, 2015–2024 (USD Million)
Table 27 Hydraulic Bending Machine Market, By Type, 2015–2024 (USD Million)
Table 28 Hydraulic Market, By Industry, 2015–2024 (USD Million)
Table 29 Hydraulic Market, By Application, 2015–2024 (USD Million)
Table 30 Hydraulic Market, By Region, 2015–2024 (USD Million)
Table 31 Hydraulic Market in North America, By Country, 2015–2024 (USD Million)
Table 32 Hydraulic Bending Machine Market in Europe, By Country, 2015–2024 (USD Million)
Table 33 Hydraulic Bending Machine Market in APAC, By Country, 2015–2024 (USD Million)
Table 34 Hydraulic Bending Machine Market in RoW, By Region, 2015–2024 (USD Million)
Table 35 Pnuematic Bending Machine Market, By Type, 2015–2024 (USD Million)
Table 36 Pneumatic Market, By Industry, 2015–2024 (USD Million)
Table 37 Pneumatic Market, By Application, 2015–2024 (USD Million)
Table 38 Pneumatic Market, By Region, 2015–2024 (USD Million)
Table 39 Pneumatic Bending Machine Market in North America, By Country, 2015–2024 (USD Million)
Table 40 Pneumatic Bending Machine Market in Europe, By Country, 2015–2024 (USD Million)
Table 41 Pneumatic Bending Machine Market in APAC, By Country, 2015–2024 (USD Million)
Table 42 Pneumatic Bending Machine Market in RoW, By Region, 2015–2024 (USD Million)
Table 43 Induction-Based Bending Machine Market, By Type, 2015–2024 (USD Million)
Table 44 Induction-Based Market, By Industry, 2015–2024 (USD Million)
Table 45 Induction-Based Market, By Application, 2015–2024 (USD Million)
Table 46 Induction-Based Market, By Region, 2015–2024 (USD Million)
Table 47 Induction-Based Bending Machine Market in North America, By Country, 2015–2024 (USD Million)
Table 48 Induction-Based Bending Machine Market in Europe, By Country, 2015–2024 (USD Million)
Table 49 Induction-Based Bending Machine Market in APAC, By Country, 2015–2024 (USD Million)
Table 50 Induction-Based Bending Machine Market in RoW, By Region, 2015–2024 (USD Million)
Table 51 Market, By Application, 2015–2024 (USD Million)
Table 52 Market for Tube/Pipe Application, By Industry, 2015–2024 (USD Million)
Table 53 Market for Tube/Pipe Application, By Type, 2015–2024 (USD Million)
Table 54 Market for Tube/Pipe Application, By Technology, 2015–2024 (USD Million)
Table 55 Market for Tube/Pipe Application, By Region, 2015–2024 (USD Million)
Table 56 Market for Metal Sheet Application, By Industry, 2015–2024 (USD Million)
Table 57 Market for Metal Sheet Application, By Type, 2015–2024 (USD Million)
Table 58 Market for Metal Sheet Application, By Technology, 2015–2024 (USD Million)
Table 59 Market for Metal Sheet Application, By Region, 2015–2024 (USD Million)
Table 60 Market for Bar Application, By Industry, 2015–2024 (USD Million)
Table 61 Market for Bar Application, By Type, 2015–2024 (USD Million)
Table 62 Market for Bar Application, By Technology, 2015–2024 (USD Million)
Table 63 Market for Bar Application, By Region, 2015–2024 (USD Million)
Table 64 Market, By Industry, 2015–2024 (USD Million)
Table 65 Market for Automotive Industry, By Type, 2015–2024 (USD Million)
Table 66 Market for Automotive Industry, By Application, 2015–2024 (USD Million)
Table 67 Market for Automotive Industry, By Technology, 2015–2024 (USD Million)
Table 68 Automatic Bending Machine Market for Automotive Industry, By Region, 2015–2024 (USD Million)
Table 69 Market in North America for Automotive Industry, By Country, 2015–2024 (USD Million)
Table 70 Market in Europe for Automotive Industry, By Country, 2015–2024 (USD Million)
Table 71 Market in APAC for Automotive Industry, By Country, 2015–2024 (USD Million)
Table 72 Market in RoW for Automotive Industry, By Region, 2015–2024 (USD Million)
Table 73 Market for Shipbuilding Industry, By Type, 2015–2024 (USD Million)
Table 74 Market for Shipbuilding Industry, By Application, 2015–2024 (USD Million)
Table 75 Market for Shipbuilding Industry, By Technology, 2015–2024 (USD Million)
Table 76 Market for Shipbuilding Industry, By Region, 2015–2024 (USD Million)
Table 77 Market in North America for Shipbuilding Industry, By Country, 2015–2024 (USD Million)
Table 78 Market in Europe for Shipbuilding Industry, By Country, 2015–2024 (USD Million)
Table 79 Market in APAC for Shipbuilding Industry, By Country, 2015–2024 (USD Million)
Table 80 Market in RoW for Shipbuilding Industry, By Country, 2015–2024 (USD Million)
Table 81 Market for Aerospace & Defense Industry, By Type, 2015–2024 (USD Million)
Table 82 Market for Aerospace & Defense Industry, By Application, 2015–2024 (USD Million)
Table 83 Market for Aerospace & Defense Industry, By Technology, 2015–2024 (USD Million)
Table 84 Market for Aerospace & Defense Industry, By Region, 2015–2024 (USD Million)
Table 85 Market in North America for Aerospace & Defense Industry, By Country, 2015–2024 (USD Million)
Table 86 Market in Europe for Aerospace & Defense Industry, By Country, 2015–2024 (USD Million)
Table 87 Market in APAC for Aerospace & Defense Industry, By Country, 2015–2024 (USD Million)
Table 88 Market in RoW for Aerospace & Defense Industry, By Region, 2015–2024 (USD Million)
Table 89 Market for Construction and Mining Industry, By Type, 2015–2024 (USD Million)
Table 90 Market for Construction and Mining Industry, By Application, 2015–2024 (USD Million)
Table 91 Market for Construction and Mining Industry, By Technology, 2015–2024 (USD Million)
Table 92 Market for Construction and Mining Industry, By Region, 2015–2024 (USD Million)
Table 93 Market in North America for Construction and Mining Industry, By Country, 2015–2024 (USD Million)
Table 94 Market in Europe for Construction and Mining Industry, By Country, 2015–2024 (USD Million)
Table 95 Market in APAC for Construction and Mining Industry, By Country, 2015–2024 (USD Million)
Table 96 Market in RoW for Construction and Mining Industry, By Region, 2015–2024 (USD Million)
Table 97 Market for Other Industries, By Type, 2015–2024 (USD Million)
Table 98 Market for Other Industries, By Application, 2015–2024 (USD Million)
Table 99 Market for Other Industries, By Technology, 2015–2024 (USD Million)
Table 100 Market for Other Industries, By Region, 2015–2024 (USD Million)
Table 101 Market in North America for Other Industries, By Country, 2015–2024 (USD Million)
Table 102 Market in Europe for Other Industries, By Country, 2015–2024 (USD Million)
Table 103 Market in APAC for Other Industries, By Country, 2015–2024 (USD Million)
Table 104 Market in RoW Other Industries, By Region, 2015–2024 (USD Million)
Table 105 Market, By Region, 2015–2024 (USD Million)
Table 106 Market in North America, By Type, 2015–2024 (USD Million)
Table 107 Market in North America, By Technology, 2015–2024 (USD Million)
Table 108 Market in North America, By Industry, 2015–2024 (USD Million)
Table 109 Market in North America, By Country, 2015–2024 (USD Million)
Table 110 Market in North America, By Application, 2015–2024 (USD Million)
Table 111 Market in US, By Type, 2015–2024 (USD Million)
Table 112 Market in US, By Technology, 2015–2024 (USD Million)
Table 113 Market in US, By Industry, 2015–2024 (USD Million)
Table 114 Market in Canada, By Type, 2015–2024 (USD Million)
Table 115 Market in Canada, By Technology, 2015–2024 (USD Million)
Table 116 Market in Canada, By Industry, 2015–2024 (USD Million)
Table 117 Market in Mexico, By Type, 2015–2024 (USD Million)
Table 118 Market in Mexico, By Technology, 2015–2024 (USD Million)
Table 119 Market in Mexico, By Industry, 2015–2024 (USD Million)
Table 120 Market in Europe, By Type, 2015–2024 (USD Million)
Table 121 Market in Europe, By Technology, 2015–2024 (USD Million)
Table 122 Market in Europe, By Industry, 2015–2024 (USD Million)
Table 123 Market in Europe, By Country, 2015–2024 (USD Million)
Table 124 Market in Europe, By Application, 2015–2024 (USD Million)
Table 125 Market in UK, By Type, 2015–2024 (USD Million)
Table 126 Market in UK, By Technology, 2015–2024 (USD Million)
Table 127 Market in UK, By Industry, 2015–2024 (USD Million)
Table 128 Market in France, By Type, 2015–2024 (USD Million)
Table 129 Market in France, By Technology, 2015–2024 (USD Million)
Table 130 Market in France, By Industry, 2015–2024 (USD Million)
Table 131 Market in Germany, By Type, 2015–2024 (USD Million)
Table 132 Market in Germany, By Technology, 2015–2024 (USD Million)
Table 133 Market in Germany, By Industry, 2015–2024 (USD Million)
Table 134 Market in Rest of Europe, By Type, 2015–2024 (USD Million)
Table 135 Market in Rest of Europe, By Technology, 2015–2024 (USD Million)
Table 136 Market in Rest of Europe, By Industry, 2015–2024 (USD Million)
Table 137 Market in APAC, By Type, 2015–2024 (USD Million)
Table 138 Market in APAC, By Technology, 2015–2024 (USD Million)
Table 139 Market in APAC, By Industry, 2015–2024 (USD Million)
Table 140 Market in APAC, By Country, 2015–2024 (USD Million)
Table 141 Market in APAC, By Application, 2015–2024 (USD Million)
Table 142 Market in China, By Type, 2015–2024 (USD Million)
Table 143 Market in China, By Technology, 2015–2024 (USD Million)
Table 144 Market in China, By Industry, 2015–2024 (USD Million)
Table 145 Market in Japan, By Type, 2015–2024 (USD Million)
Table 146 Market in Japan, By Technology, 2015–2024 (USD Million)
Table 147 Market in Japan, By Industry, 2015–2024 (USD Million)
Table 148 Market in India, By Type, 2015–2024 (USD Million)
Table 149 Market in India, By Technology, 2015–2024 (USD Million)
Table 150 Automatic Bending Machine Market in India, By Industry, 2015–2024 (USD Million)
Table 151 Market in Rest of APAC, By Type, 2015–2024 (USD Million)
Table 152 Market in Rest of APAC, By Technology, 2015–2024 (USD Million)
Table 153 Market in Rest of APAC, By Industry, 2015–2024 (USD Million)
Table 154 Market in RoW, By Type, 2015–2024 (USD Million)
Table 155 Market in RoW, By Technology, 2015–2024 (USD Million)
Table 156 Market in RoW, By Industry, 2015–2024 (USD Million)
Table 157 Market in RoW, By Region, 2015–2024 (USD Million)
Table 158 Market in RoW, By Application, 2015–2024 (USD Million)
Table 159 Market in Middle East and Africa, By Type, 2015–2024 (USD Million)
Table 160 Market in Middle East and Africa, By Technology, 2015–2024 (USD Million)
Table 161 Automatic Bending Machine Market in Middle East and Africa, By Industry, 2015–2024 (USD Million)
Table 162 Market in South America, By Type, 2015–2024 (USD Million)
Table 163 Market in South America, By Technology, 2015–2024 (USD Million)
Table 164 Market in South America, By Industry, 2015–2024 (USD Million)
Table 165 Product Launches, 2018–2019
Table 166 Expansions, 2018–2019
Table 167 Agreements, 2019
List of Figures (32 Figures)
Figure 1 Automatic Bending Machine Market Segmentation
Figure 2 Automated Bending Machine Market: Research Design
Figure 3 Market Size Estimation Methodology: Bottom-Up Approach
Figure 4 Market Size Estimation Methodology: Top-Down Approach
Figure 5 Market Breakdown and Data Triangulation
Figure 6 Assumption for Research Study
Figure 7 Automatic Bending Machine Market Segmentation
Figure 8 Global Market, 2015 to 2024 (USD Million)
Figure 9 Market for Automatic Type Bending Machines to Grow at Higher CAGR During Forecast Period
Figure 10 Tube/Pipe Bending Application to Lead Market During Forecast Period
Figure 11 Electric Automatic Bending Machines Woud Capture Largest Market Share During Forecast Period
Figure 12 Automotive Industry to Account for Largest Share of Market From 2019 to 2024
Figure 13 APAC to Witness Highest CAGR in Global Market During Forecast Period
Figure 14 Attractive Growth Opportunities for Players in Market
Figure 15 Automatic Bending Machines to Exhibit Higher Growth Rate Than That of Semiautomatic Bending Machines During Forecast Period
Figure 16 Tube/Pipe Application to Hold Largest Market Share in 2024
Figure 17 Electric Automatic Bending Machines to Account for Largest Market Size During Forecast Period
Figure 18 Automotive Industry to Hold Largest Share of Market in 2024
Figure 19 APAC to Witness Highest CAGR in Market During Forecast Period
Figure 20 Market Dynamics
Figure 21 Market, By Type
Figure 22 Market, By Technology
Figure 23 Automatic Bending Machine Market, By Application
Figure 24 Market, By Industry
Figure 25 North America: Automatic Bending Machine Snapshot
Figure 26 APAC: Market Snapshot
Figure 27 Top 3 Market Players, 2018
Figure 28 Market (Global) Competitive Leadership Mapping, 2018
Figure 29 Trumpf: Company Snapshot
Figure 30 Amada: Company Snapshot
Figure 31 Bystronic: Company Snapshot
Figure 32 Prima Industrie: Company Snapshot
The study involved four major activities in estimating the current market size for the automatic bending machine market. Exhaustive secondary research has been done to collect information on the market and the peer market. Validate these findings, assumptions, and sizing with industry experts across the value chain through primary research has been the next step. Both top-down and bottom-up approaches have been employed to estimate the total market size. After that, market breakdown and data triangulation procedures have been carried out to estimate the market size of segments and subsegments.
Secondary Research
In the secondary research process, various secondary sources, such as Factiva and Avention, have been referred to for identifying and collecting information for this study. These secondary sources included annual reports, press releases, and investor presentations of companies, white papers, certified publications, articles by recognized authors, trade directories, and databases.
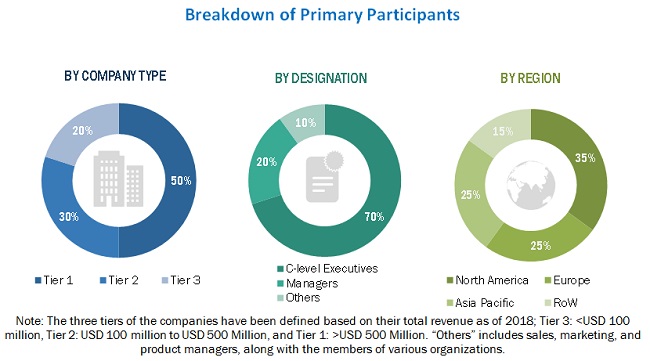
Primary Research
Extensive primary research has been conducted after gaining knowledge about the automatic bending machine market scenario through secondary research. Several primary interviews have been conducted with market experts from both demand and supply sides across four major regions—North America, Europe, APAC, and RoW. Approximately 30% and 70% of primary interviews have been conducted with parties from the demand and supply sides, respectively. This primary data has been collected through questionnaires, e-mails, and telephonic interviews.
The following figure shows the breakdown of primaries based on company type, designation, and region.
To know about the assumptions considered for the study, download the pdf brochure
Market Size Estimation
Both top-down and bottom-up approaches have been used to estimate and validate the size of the global automatic bending machine market and other dependent submarkets. Key players in the market have been identified through secondary research, and their ranking in the respective regions has been determined through primary and secondary research. This entire research methodology involves the study of financial reports of top players and interviews with industry experts (such as CEOs, VPs, directors, and marketing executives) for key insights (both quantitative and qualitative) on the market. All percentage share split and breakdowns have been determined using secondary sources and verified through primary sources. All the possible parameters that affect the markets covered in this research study have been accounted for, viewed in detail, verified through primary research, and analyzed to obtain the final quantitative and qualitative data. This data has been consolidated and supplemented with detailed inputs and analysis from MarketsandMarkets and presented in this report.
Data Triangulation
After arriving at the overall market size from the estimation process explained above, the total market has been split into several segments and subsegments. To complete the overall market engineering process and arrive at the exact statistics for all the segments, the market breakdown and data triangulation procedures have been employed, wherever applicable. The data has been triangulated by studying various factors and trends from both the demand and supply sides. The market has also been validated using both top-down and bottom-up approaches.
Study Objectives Are as Follows:
- To define, describe, and forecast the automatic bending machine, in terms of value, based on type, technology, application, and industry
- To forecast the market size, in terms of value, for segments concerning four main regions—North America, Europe, Asia Pacific (APAC), and Rest of the World (RoW)
- To provide detailed information regarding major factors, namely, drivers, restraints, opportunities, and challenges influencing the growth of the market
- To provide an overall view of the global market through illustrative segmentation, analyses, and market size estimations of crucial geographic segments
- To analyze the competitive intelligence of players based on company profiles and their strategies to sustain their position and grow in this market
- To strategically analyze micromarkets1 with respect to individual growth trends, prospects, and contribution to the total market
- To strategically profile key players and comprehensively analyze their market ranking and core competencies2, along with detailing the competitive landscape for market leaders
Available Customizations:
With the given market data, MarketsandMarkets offers customizations according to the company’s specific needs. The following customization options are available for the report.
Company Information
- Detailed analysis and profiling of additional market players (up to 5)


Growth opportunities and latent adjacency in Automatic Bending Machine Market