Automatic Checkweigher Market by Type (Standalone Systems, Combination Systems), Technology (Strain Gauge, EMFR), Industry (Food & Beverages, Pharmaceuticals, Consumer Products, Cosmetics, & Personal Care), and Region - Global Forecast to 2024-2033


The global automatic checkweigher market was valued at USD 440.4 million in 2024 and is estimated to reach USD 770.2 million by 2033, at a CAGR of 5.9% between 2025 and 2033.
The automatic checkweigher market is witnessing strong growth driven by the rising demand for efficient, accurate, and high-speed weighing solutions across food & beverages, pharmaceuticals, and logistics industries. Increasing consumer focus on product quality and compliance with stringent regulatory standards is encouraging manufacturers to adopt automated weighing systems. Additionally, the need to reduce operational costs, minimize human error, and enhance production line efficiency is fueling adoption. Technological advancements such as integration with IoT, AI, and real-time data analytics are further accelerating market expansion globally.

An automatic checkweigher is an advanced weighing system designed to measure the weight of products on a production line in real time, ensuring they meet predefined weight specifications. It automatically identifies underweight or overweight items and can trigger rejection mechanisms to maintain quality and compliance. Widely used in food & beverages, pharmaceuticals, and logistics, automatic checkweighers enhance production efficiency, reduce human error, and support regulatory adherence, while often integrating with technologies like IoT and data analytics for smarter operations.
Market by Type
Standalone systems
Standalone automatic checkweigher systems currently hold the largest market share due to their simplicity, reliability, and ease of implementation. These systems operate independently, requiring minimal integration with existing production lines, making them ideal for manufacturers seeking efficient, cost-effective weighing solutions. Widely used across food & beverages, pharmaceuticals, and logistics, standalone systems offer accurate, real-time weight monitoring and quick detection of underweight or overweight products. Their proven performance, low maintenance requirements, and ability to ensure regulatory compliance make them the preferred choice for businesses looking to optimize production efficiency and maintain consistent product quality.
Combination systems
Combination automatic checkweigher systems are projected to grow at a high rate due to increasing demand for integrated solutions that combine weighing with other inspection functions, such as metal detection or x-ray inspection. These systems provide end-to-end quality control on a single platform, enhancing production line efficiency and reducing manual intervention. Rising consumer focus on safety and regulatory compliance, especially in food, pharmaceutical, and logistics sectors, is accelerating adoption. As manufacturers seek more sophisticated, multifunctional solutions to optimize operations, combination systems are expected to capture a growing share of the market globally.
Market by Technology
Strain gauge
Strain gauge-based checkweighers continue to hold the largest market share due to their proven accuracy, reliability, and versatility. These systems measure weight by detecting tiny deformations in load cells, ensuring precise measurements even at high speeds. Their durability, ease of maintenance, and compatibility with various production environments make them ideal for food & beverage, pharmaceutical, and logistics applications. Manufacturers prefer strain gauge technology for its ability to deliver consistent, real-time weight monitoring, helping maintain product quality, reduce waste, and meet stringent regulatory standards, securing its dominant position in the market.
EMFR
Electromagnetic Force Restoration (EMFR) technology in automatic checkweighers is expected to grow at a high rate due to its high precision, fast response, and suitability for high-speed production lines. EMFR-based systems use electromagnetic forces to balance the load and detect weight variations accurately, making them ideal for industries requiring rapid and precise measurements, such as pharmaceuticals and high-volume food processing. With increasing demand for advanced weighing solutions capable of supporting stringent quality standards and minimizing product giveaway, EMFR technology is gaining traction as a preferred choice for manufacturers seeking next-generation, high-performance checkweighing systems.
Market by Geography
Geographically, the automatic checkweigher market is witnessing strong growth across Asia Pacific, North America, Europe, and the Rest of the World (RoW). Asia Pacific is the largest and fastest-growing region, fueled by rapid industrialization, expansion of food & beverage and pharmaceutical sectors, rising e-commerce and logistics activities, and government initiatives supporting automation. North America is driven by high investments in smart manufacturing, advanced automation technologies, and strict regulatory compliance for quality and safety. Europe’s growth is supported by stringent food safety regulations, quality assurance programs, and demand for efficient production processes. Meanwhile, RoW is emerging as a promising market, with expanding industrial infrastructure, logistics development, and increasing adoption of automated weighing solutions.
Market Dynamics
Driver: Rising demand for accurate and high-speed weighing solutions
The automatic checkweigher market is significantly driven by the increasing demand for accurate and high-speed weighing solutions across various industries. Manufacturers are seeking systems that can measure products in real time without slowing down production, ensuring compliance with strict quality standards. High-speed checkweighers help reduce human errors, minimize product giveaway, and maintain consistent weight accuracy even in fast-moving production lines. Industries such as food & beverages, pharmaceuticals, and logistics are rapidly adopting these solutions to enhance operational efficiency, improve productivity, and meet growing consumer expectations for quality and safety.
Restraint: Complexity in integrating with existing production lines
One of the key restraints for the automatic checkweigher market is the complexity involved in integrating these systems with existing production lines. Many manufacturing facilities operate on legacy equipment, making the installation of automated checkweighers challenging. Customization, layout modifications, and compatibility with existing conveyors and software systems often require significant investment and time. This complexity can delay adoption, particularly for small and medium-sized enterprises. Additionally, improper integration can affect production efficiency, lead to errors, or cause downtime, which restrains widespread implementation despite the growing demand for automation.
Opportunity: Increasing demand in e-commerce and logistics for precise weighing
The rise of e-commerce and expanding logistics networks present a major opportunity for the automatic checkweigher market. Accurate weighing is critical for determining shipping costs, reducing errors, and ensuring compliance with courier and regulatory standards. Automated checkweighers enable faster processing of packages, reduce human intervention, and improve operational efficiency in warehouses and distribution centers. With e-commerce growth accelerating globally, businesses are increasingly investing in precision weighing systems to enhance fulfillment accuracy, reduce returns due to incorrect weights, and optimize supply chain operations, driving significant market potential in this segment.
Challenge: Managing product variety and packaging differences
A major challenge in the automatic checkweigher market is managing diverse product types and packaging formats. Different shapes, sizes, and materials can affect weighing accuracy, requiring advanced sensors and adaptable systems. High-speed production lines processing multiple SKUs need frequent adjustments or reconfigurations, which can lead to downtime or errors if not managed properly. Additionally, fragile or irregularly shaped items may be difficult to handle without damage. Manufacturers must invest in flexible and sophisticated checkweighers capable of accommodating varied products while maintaining precision, making this a critical operational and technological challenge.
Future Outlook
From 2025 to 2033, the automatic checkweigher market is poised for substantial growth as manufacturers focus on enhancing production efficiency and product quality. Technological advancements, including AI-driven analytics, IoT connectivity, and machine learning, will enable checkweighers to provide real-time insights, predictive maintenance, and automated rejection of non-compliant products. Expanding e-commerce, logistics, and pharmaceutical industries will fuel demand for precise weighing solutions, while increasing regulatory standards worldwide will drive adoption. Over the next decade, automatic checkweighers are expected to become integral to smart manufacturing ecosystems, optimizing processes, reducing operational costs, and ensuring consistent product compliance.
Key Market Players
Top automatic checkweigher companies METTLER TOLEDO (Switzerland), Anritsu (Japan), ISHIDA CO.,LTD. (Japan).
Key Questions addressed in this report:
- What are the global trends in demand for the market?
- What are the upcoming technologies/product areas that will have a significant impact on the market in the future?
- What will be the revenue pockets for the market players in the next 6 years?
- What are the prime strategies followed by key players in the market?
 Exclusive indicates content/data unique to MarketsandMarkets and not available with any competitors.
Table of Contents
1 Introduction (Page No. - 17)
1.1 Study Objectives
1.2 Market Definition and Scope
1.2.1 Inclusions and Exclusions
1.3 Study Scope
1.3.1 Markets Covered
1.3.2 Years Considered
1.4 Currency
1.5 Limitations
1.6 Stakeholders
2 Research Methodology (Page No. - 21)
2.1 Research Data
2.1.1 Secondary Data
2.1.1.1 Key Data From Secondary Sources
2.1.2 Primary Data
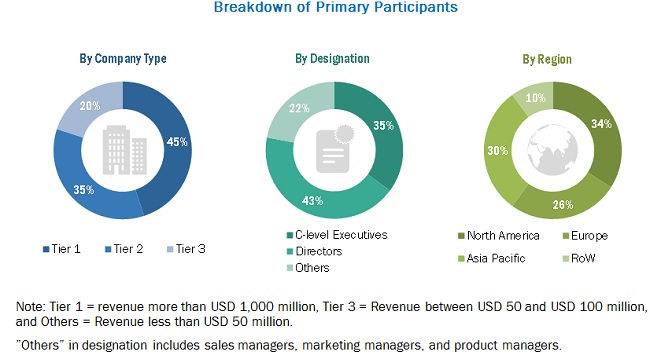
2.1.2.1 Breakdown of Primary Interviews
2.1.2.2 Key Data From Primary Sources
2.1.2.3 Key Industry Insights
2.1.3 Secondary and Primary Research
2.2 Market Size Estimation
2.2.1 Bottom-Up Approach
2.2.1.1 Approach for Capturing Market Size By Bottom-Up Analysis (Demand Side)
2.2.2 Top-Down Approach
2.2.2.1 Approach for Capturing Market Share By Top-Down Analysis (Supply Side)
2.3 Market Breakdown and Data Triangulation
2.4 Research Assumptions
3 Executive Summary (Page No. - 31)
4 Premium Insights (Page No. - 35)
4.1 Lucrative Opportunities in Automatic Checkweigher Market
4.2 Market, By Type
4.3 Market, By Technology
4.4 Market in Asia Pacific, By Industry and Country
4.5 Market, By Industry
4.6 Market, By Region
5 Market Overview (Page No. - 38)
5.1 Introduction
5.2 Market Dynamics
5.2.1 Drivers
5.2.1.1 Growing Awareness Among Manufacturers About Deployment Benefits of Automatic Checkweighers
5.2.1.2 Tightening Regulatory Norms Pertaining to Packaging of Goods
5.2.2 Restraints
5.2.2.1 High Ownership Cost of Dynamic Checkweighers
5.2.3 Opportunities
5.2.3.1 Increasing Demand for Combination Inspection Systems
5.2.3.2 Growing Need for Automation in Food Processing Industry
5.2.4 Challenges
5.2.4.1 Adverse Impact of Harsh Environmental Conditions on Weighing Accuracy and Efficiency of Automatic Checkweighers
5.3 Factors Impacting Price of Automatic Checkweighers
5.4 Automatic Checkweighing for Primary and Secondary Packaging
6 Automatic Checkweigher Market, By Type (Page No. - 44)
6.1 Introduction
6.2 Standalone Systems
6.2.1 Automatic Checkweighers are Deployed to Ensure Compliance With Regulations and Achieve Increased Productivity
6.3 Combination Systems
6.3.1 Market for Checkweighing Combination Systems are Likely to Grow at Higher CAGR During Forecast Period
7 Automatic Checkweigher Market, By Technology (Page No. - 52)
7.1 Introduction
7.2 Strain Gauge
7.2.1 Strain Gauge Technology-Based Automatic Checkweighers to Continue to Account for Larger Market Size During Forecast Period
7.3 EMFR
7.3.1 EMFR Technology to Register Higher CAGR in Market From 2019 to 2024
8 Automatic Checkweigher Market, By Industry (Page No. - 61)
8.1 Introduction
8.2 Food & Beverages
8.2.1 Strict Government Regulations and Quality Concerns Propel Demand for Automatic Checkweighers in Food & Beverages Industry
8.3 Pharmaceuticals
8.3.1 Adoption of Weight Inspection Checkweighing Systems to Avoid Costly Fines Propels Growth of Market for Pharmaceuticals Industry
8.4 Consumer Products, Cosmetics, and Personal Care
8.4.1 Increasing Adoption of Automatic Checkweighers By Manufacturers to Maintain Tight Production Tolerances for Delivering High Product Quality and Profits
8.5 Others
9 Geographic Analysis (Page No. - 78)
9.1 Introduction
9.2 North America
9.2.1 US
9.2.1.1 Presence of Various Pharmaceutical Manufacturers Supports Market Growth in US
9.2.2 Rest of North America
9.2.2.1 Food Industry is Major Market for Automatic Checkweighers in Rest of North America
9.3 Europe
9.3.1 Germany
9.3.1.1 Germany Accounted for Significant Share of European Market in 2018
9.3.2 UK
9.3.2.1 Food & Beverages Industry Contributes Maximum to Market Growth in UK
9.3.3 France
9.3.3.1 Food Processing Sector Boosts Market Growth in France
9.3.4 Italy
9.3.4.1 Huge Industry Base and Its Rising Inclination Toward Process Automation Propel Market for Automatic Checkweighers in Italy
9.3.5 Rest of Europe
9.4 APAC
9.4.1 China
9.4.1.1 China Expected to Lead Market in Asia Pacific
9.4.2 Japan
9.4.2.1 Food and Pharmaceuticals Industries in Japan Continue to Increase Demand for Automatic Checkweighers
9.4.3 India
9.4.3.1 Market Growth in India is Driven By Growing Packaging Industry
9.4.4 Rest of Asia Pacific
9.5 Rest of the World
9.5.1 South America
9.5.1.1 South America to Lead Market in RoW in Terms of Size
9.5.2 Middle East & Africa
10 Competitive Landscape (Page No. - 115)
10.1 Overview
10.2 Ranking Analysis: Automatic Checkweigher Market
10.3 Competitive Leadership Mapping, 2018
10.3.1 Visionary Leaders
10.3.2 Dynamic Differentiators
10.3.3 Innovators
10.3.4 Emerging Companies
10.4 Strength of Product Portfolio
10.5 Business Strategy Excellence
10.6 Competitive Scenario
10.6.1 Product Launches
10.6.2 Expansions
11 Company Profiles (Page No. - 122)
(Business Overview, Products Offered, Recent Developments, SWOT Analysis, and MnM View)*
11.1 Key Players
11.1.1 Mettler Toledo
11.1.2 Anritsu Corporation
11.1.3 Bizerba
11.1.4 Ishida Co., Ltd.
11.1.5 A&D Company, Limited
11.1.6 Yamato Scale
11.1.7 Wipotec-OCS
11.1.8 Thermo Fisher Scientific Inc.
11.1.9 Robert Bosch GmbH (Bosch Packaging Technology)
11.1.10 Minebea Intec
11.2 Right to Win
11.3 Other Key Players
11.3.1 Hardy Process Solutions
11.3.2 Precia Molen
11.3.3 Cardinal Scale
11.3.4 ACG Worldwide
11.3.5 Loma Systems
11.3.6 Dibal SA
11.3.7 Espera-Werke GmbH
11.3.8 Shanghai Bhii Instrument Co., Ltd.
11.3.9 Spee-Dee Packaging Machinery, Inc.
11.3.10 Rice Lake Weighing Systems
*Details on Business Overview, Products Offered, Recent Developments, SWOT Analysis, and MnM View might not be captured in case of unlisted companies.
12 Appendix (Page No. - 147)
12.1 Insights of Industry Experts
12.2 Discussion Guide
12.3 Knowledge Store: Marketsandmarkets’ Subscription Portal
12.4 Available Customizations
12.5 Related Reports
12.6 Author Details
List of Tables (127 Tables)
Table 1 Automatic Checkweigher Market, By Type, 2016–2024 (USD Million)
Table 2 Market for Standalone Systems, By Region, 2016–2024 (USD Million)
Table 3 Market for Standalone Systems, By Industry, 2016–2024 (USD Million)
Table 4 Market for Standalone Systems in North America, By Industry, 2016–2024 (USD Million)
Table 5 Market for Standalone Systems in Europe, By Industry, 2016–2024 (USD Million)
Table 6 Market for Standalone Systems in APAC, By Industry, 2016–2024 (USD Million)
Table 7 Market for Standalone Systems in RoW, By Industry, 2016–2024 (USD Thousand)
Table 8 Market for Combination Systems, By Region, 2016–2024 (USD Thousand)
Table 9 Market for Combination Systems, By Industry, 2016–2024 (USD Thousand)
Table 10 Market for Combination Systems in North America, By Industry, 2016–2024 (USD Thousand)
Table 11 Market for Combination Systems in Europe, By Industry, 2016–2024 (USD Thousand)
Table 12 Market for Combination Systems in APAC, By Industry, 2016–2024 (USD Thousand)
Table 13 Market for Combination Systems in RoW, By Industry, 2016–2024 (USD Thousand)
Table 14 Market, By Technology, 2016–2024 (USD Million)
Table 15 Market for Strain Gauge Technology, By Region, 2016–2024 (USD Million)
Table 16 Market for Strain Gauge Technology, By Industry, 2016–2024 (USD Million)
Table 17 Strain Gauge Automatic Checkweigher Market in North America, By Industry, 2016–2024 (USD Million)
Table 18 Strain Gauge Market in Europe, By Industry, 2016–2024 (USD Million)
Table 19 Strain Gauge Market in APAC, By Industry, 2016–2024 (USD Million)
Table 20 Strain Gauge Market in RoW, By Industry, 2016–2024 (USD Thousand)
Table 21 Market for EMFR Technology, By Region, 2016–2024 (USD Million)
Table 22 Market for EMFR Technology, By Industry, 2016–2024 (USD Million)
Table 23 EMFR Market in North America, By Industry, 2016–2024 (USD Thousand)
Table 24 EMFR Market in Europe, By Industry, 2016–2024 (USD Thousand)
Table 25 EMFR Market in APAC, By Industry, 2016–2024 (USD Thousand)
Table 26 EMFR Market in RoW, By Industry, 2016–2024 (USD Thousand)
Table 27 Market, By Industry, 2016–2024 (USD Million)
Table 28 Market for Food & Beverages Industry, By Region, 2016–2024 (USD Million)
Table 29 Market for Food & Beverages Industry, By Type, 2016–2024 (USD Million)
Table 30 Market for Food & Beverages Industry, By Technology, 2016–2024 (USD Million)
Table 31 Market in North America for Food & Beverages Industry, By Technology, 2016–2024 (USD Million)
Table 32 Market in Europe for Food & Beverages Industry, By Technology, 2016–2024 (USD Million)
Table 33 Market in APAC for Food & Beverages Industry, By Technology, 2016–2024 (USD Million)
Table 34 Market in RoW for Food & Beverages Industry, By Technology, 2016–2024 (USD Thousand)
Table 35 Market in North America for Food & Beverages Industry, By Type, 2016–2024 (USD Million)
Table 36 Market in Europe for Food & Beverages Industry, By Type, 2016–2024 (USD Million)
Table 37 Market in APAC Food & Beverages Industry, By Type, 2016–2024 (USD Million)
Table 38 Market in RoW Food & Beverages Industry, By Type, 2016–2024 (USD Thousand)
Table 39 Market for Pharmaceuticals Industry, By Region, 2016–2024 (USD Million)
Table 40 Market for Pharmaceuticals Industry, By Type, 2016–2024 (USD Million)
Table 41 Market for Pharmaceuticals Industry, By Technology, 2016–2024 (USD Million)
Table 42 Market in North America for Pharmaceuticals Industry, By Technology, 2016–2024 (USD Million)
Table 43 Market in Europe for Pharmaceuticals Industry, By Technology, 2016–2024 (USD Million)
Table 44 Market in APAC for Pharmaceuticals Industry, By Technology, 2016–2024 (USD Million)
Table 45 Market in RoW for Pharmaceuticals Industry, By Technology, 2016–2024 (USD Thousand)
Table 46 Market in North America for Pharmaceuticals Industry, By Type, 2016–2024 (USD Million)
Table 47 Market in Europe for Pharmaceuticals Industry, By Type, 2016–2024 (USD Million)
Table 48 Market in APAC for Pharmaceuticals Industry, By Type, 2016–2024 (USD Million)
Table 49 Market in RoW for Pharmaceuticals Industry, By Type, 2016–2024 (USD Thousand)
Table 50 Market for Consumer Products, Cosmetics, and Personal Care Industry, By Region, 2016–2024 (USD Million)
Table 51 Market for Consumer Products, Cosmetics, and Personal Care Industry, By Type, 2016–2024 (USD Million)
Table 52 Market for Consumer Products, Cosmetics, and Personal Care Industry, By Technology, 2016–2024 (USD Million)
Table 53 Market in North America for Consumer Products, Cosmetics, and Personal Care Industry, By Technology, 2016–2024 (USD Thousand)
Table 54 Market in Europe for Consumer Products, Cosmetics, and Personal Care Industry, By Technology, 2016–2024 (USD Million)
Table 55 Market in APAC for Consumer Products, Cosmetics, and Personal Care Industry, By Technology, 2016–2024 (USD Thousand)
Table 56 Market in RoW for Consumer Products, Cosmetics, and Personal Care Industry, By Technology, 2016–2024 (USD Thousand)
Table 57 Market in North America for Consumer Products, Cosmetics, and Personal Care Industry, By Type, 2016–2024 (USD Thousand)
Table 58 Market in Europe for Consumer Products, Cosmetics, and Personal Care Industry, By Type, 2016–2024 (USD Thousand)
Table 59 Market in APAC for Consumer Products, Cosmetics, and Personal Care Industry, By Type, 2016–2024 (USD Thousand)
Table 60 Market in RoW for Consumer Products, Cosmetics, and Personal Care Industry, By Type, 2016–2024 (USD Thousand)
Table 61 Market for Other Industries, By Region, 2016–2024 (USD Thousand)
Table 62 Market for Other Industries, By Type, 2016–2024 (USD Thousand)
Table 63 Market for Other Industries, By Technology, 2016–2024 (USD Thousand)
Table 64 Market in North America for Other Industries, By Technology, 2016–2024 (USD Thousand)
Table 65 Market in Europe for Other Industries, By Technology, 2016–2024 (USD Thousand)
Table 66 Market in APAC for Other Industries, By Technology, 2016–2024 (USD Thousand)
Table 67 Market in North America for Other Industries, By Type, 2016–2024 (USD Thousand)
Table 68 Market in Europe for Other Industries, By Type, 2016–2024 (USD Thousand)
Table 69 Market in APAC for Other Industries, By Type, 2016–2024 (USD Thousand)
Table 70 Market, By Region, 2016–2024 (USD Million)
Table 71 Market in North America, By Type, 2016–2024 (USD Million)
Table 72 Market in North America, By Technology, 2016–2024 (USD Million)
Table 73 Market in North America, By Industry, 2016–2024 (USD Million)
Table 74 Market in North America, By Country, 2016–2024 (USD Million)
Table 75 Market in US, By Type, 2016–2024 (USD Million)
Table 76 Market in US, By Technology, 2016–2024 (USD Million)
Table 77 Market in US, By Industry, 2016–2024 (USD Million)
Table 78 Market in Rest of North America, By Type, 2016–2024 (USD Million)
Table 79 Market in Rest of North America, By Technology, 2016–2024 (USD Million)
Table 80 Market in Rest of North America, By Industry, 2016–2024 (USD Thousand)
Table 81 Market in Europe, By Country, 2016–2024 (USD Million)
Table 82 Market in Europe, By Type, 2016–2024 (USD Million)
Table 83 Market in Europe, By Technology, 2016–2024 (USD Million)
Table 84 Market in Europe, By Industry, 2016–2024 (USD Million)
Table 85 Market in Germany, By Type, 2016–2024 (USD Million)
Table 86 Market in Germany, By Technology, 2016–2024 (USD Million)
Table 87 Market in Germany, By Industry, 2016–2024 (USD Thousand)
Table 88 Market in UK, By Type, 2016–2024 (USD Million)
Table 89 Market in UK, By Technology, 2016–2024 (USD Million)
Table 90 Market in UK, By Industry, 2016–2024 (USD Thousand)
Table 91 Market in France, By Type, 2016–2024 (USD Million)
Table 92 Market in France, By Technology, 2016–2024 (USD Million)
Table 93 Market in France, By Industry, 2016–2024 (USD Thousand)
Table 94 Market in Italy, By Type, 2016–2024 (USD Million)
Table 95 Market in Italy, By Technology, 2016–2024 (USD Million)
Table 96 Market in Italy, By Industry, 2016–2024 (USD Thousand)
Table 97 Market in Rest of Europe, By Type, 2016–2024 (USD Million)
Table 98 Market in Rest of Europe, By Technology, 2016–2024 (USD Million)
Table 99 Market in Rest of Europe, By Industry, 2016–2024 (USD Thousand)
Table 100 Market in Asia Pacific, By Country, 2016–2024 (USD Million)
Table 101 Market in Asia Pacific, By Type, 2016–2024 (USD Million)
Table 102 Market in Asia Pacific, By Technology, 2016–2024 (USD Million)
Table 103 Market in Asia Pacific, By Industry, 2016–2024 (USD Million)
Table 104 Market in China, By Type, 2016–2024 (USD Million)
Table 105 Market in China, By Technology, 2016–2024 (USD Million)
Table 106 Market in China, By Industry, 2016–2024 (USD Thousand)
Table 107 Market in Japan, By Type, 2016–2024 (USD Million)
Table 108 Market in Japan, By Technology, 2016–2024 (USD Million)
Table 109 Market in Japan, By Industry, 2016–2024 (USD Thousand)
Table 110 Market in India, By Type, 2016–2024 (USD Thousand)
Table 111 Market in India, By Technology, 2016–2024 (USD Thousand)
Table 112 Market in India, By Industry, 2016–2024 (USD Thousand)
Table 113 Market in Rest of APAC, By Type, 2016–2024 (USD Million)
Table 114 Market in Rest of APAC, By Technology, 2016–2024 (USD Million)
Table 115 Market in Rest of APAC, By Industry, 2016–2024 (USD Thousand)
Table 116 Market in RoW, By Region, 2016–2024 (USD Million)
Table 117 Market in RoW, By Type, 2016–2024 (USD Million)
Table 118 Market in RoW, By Technology, 2016–2024 (USD Million)
Table 119 Market in RoW, By Industry, 2016–2024 (USD Thousand)
Table 120 Market in South America, By Type, 2016–2024 (USD Thousand)
Table 121 Market in South America, By Technology, 2016–2024 (USD Thousand)
Table 122 Market in South America, By Industry, 2016–2024 (USD Thousand)
Table 123 Market in Middle East & Africa, By Type, 2016–2024 (USD Thousand)
Table 124 Market in Middle East & Africa, By Technology, 2016–2024 (USD Thousand)
Table 125 Market in Middle East & Africa, By Industry, 2016–2024 (USD Thousand)
Table 126 Product Launches, 2019
Table 127 Expansions, 2019
List of Figures (45 Figures)
Figure 1 Automatic Checkweigher Market Segmentation
Figure 2 Market: Research Design
Figure 3 Market Size Estimation Methodology: Approach 1 (Supply Side): Revenue Generated From Products/Solutions/Services Offered in Market
Figure 4 Market Size Estimation Methodology: Approach 2 (Supply Side): Illustrative Example of Company in Market
Figure 5 Market Size Estimation Methodology: Bottom-Up Approach
Figure 6 Market Size Estimation Methodology: Top-Down Approach
Figure 7 Data Triangulation
Figure 8 Research Study Assumptions
Figure 9 Market Segmentation
Figure 10 Market for EMFR Technology-Based Automatic Checkweighers to Grow at Higher CAGR During 2019–2024
Figure 11 Food & Beverages Industry to Account for Largest Size of Global Market in 2024
Figure 12 Market for Combination Systems to Grow at Higher CAGR During 2019–2024
Figure 13 Asia Pacific is Expected to Witness Highest CAGR in Market From 2019 to 2024
Figure 14 Attractive Opportunities in Automatic Checkweigher From 2019 to 2024
Figure 15 Standalone Systems to Capture Larger Share of Market in 2019 as Well as in 2024
Figure 16 Strain Gauge Technology-Based Automatic Checkweighers to Account for Larger Market Share in 2024
Figure 17 Food & Beverages Industry and China to Hold Largest Share of Market in Asia Pacific, By Industry and Country, Respectively, in 2019
Figure 18 Food & Beverages Industry to Command Automatic Checkweigher By Capturing Largest Size in 2019
Figure 19 Asia Pacific to Register Highest CAGR in Overall Market During Forecast Period
Figure 20 Market: Drivers, Restraints, Opportunities, and Challenges
Figure 21 Market Drivers and Their Impact
Figure 22 Market Restraint and Its Impact
Figure 23 Market Opportunities and Their Impact
Figure 24 Market Challenge and Its Impact
Figure 25 Standalone Automatic Checkweighers to Account for Larger Market Size From 2019 to 2024
Figure 26 Market for EMFR Technology-Based Automatic Checkweighers to Grow at Higher CAGR During 2019–2024
Figure 27 Food & Beverages Industry to Account for Largest Size of Market From 2019 to 2024
Figure 28 Strain Gauge Technology-Based Market in RoW for Other Industries, 2016–2024 (USD Thousand)
Figure 29 China to Register Highest CAGR in Overall Market From 2019 to 2024
Figure 30 North America: Market Snapshot
Figure 31 US to Continue to Account for Largest Size of North American Automatic Checkweigher Market During Forecast Period
Figure 32 Europe: Market Snapshot
Figure 33 Rest of Europe to Account for Largest Size of European Market During Forecast Period
Figure 34 APAC: Market Snapshot
Figure 35 China to Command Automatic Checkweigher Market in APAC During Forecast Period
Figure 36 RoW: Market Snapshot
Figure 37 South America to Capture Larger Size of Market in RoW During Forecast Period
Figure 38 Key Players Adopted Product Launches and Expansions as Key Growth Strategies During 2018–2019
Figure 39 Ranking of Top 3 Players in Market (2018)
Figure 40 Market (Global) Competitive Leadership Mapping, 2018
Figure 41 Mettler Toledo: Company Snapshot
Figure 42 Anritsu Corporation: Company Snapshot
Figure 43 A&D Company, Limited: Company Snapshot
Figure 44 Thermo Fisher Scientific Inc.: Company Snapshot
Figure 45 Robert Bosch GmbH: Company Snapshot
The study involved 4 major activities to estimate the current market size for the automatic checkweigher market. Exhaustive secondary research has been conducted to collect the information on the current market, the peer market, and the parent market. Validation of these findings, assumptions, and sizing with industry experts across the value chain through primary research has been the next step. Both top-down and bottom-up approaches have been employed to estimate the complete market size. After that, the market breakdown and data triangulation approaches have been used to estimate the market size of segments and subsegments.
Secondary Research
In the secondary research process, various secondary sources have been referred to for identifying and collecting information important for this study. These secondary sources include annual reports, press releases, and investor presentations of companies; white papers, certified publications, and articles from recognized authors; directories and databases; and SEC filings; among others.
Primary Research
In the primary research process, various primary sources from both the supply and demand sides have been interviewed to obtain the qualitative and quantitative information relevant to this report. The primary sources from the supply side include industry experts such as CEOs, vice presidents, marketing directors, technology and innovation directors, product users, and related executives from major companies and organizations operating in the automatic checkweigher market. Following is the breakdown of primary respondents—
To know about the assumptions considered for the study, download the pdf brochure
Market Size Estimation
Both top-down and bottom-up approaches have been used to estimate and validate the size of the automatic checkweigher market, as well as that of the other dependent submarkets. Key players in the market have been identified through secondary research, and their market shares in the respective regions have been determined through primary and secondary research. This entire research methodology includes the following:
- The study of annual and financial reports of top players, as well as interviews with experts for key insights
- All percentage shares, splits, and breakdowns have been determined using secondary sources and verified through primary sources
- All the possible parameters that affect the markets covered in this research study have been accounted for, viewed in detail, verified through the primary research
Data Triangulation
After arriving at the overall market size from the market size estimation process explained above, the total market has been split into several segments and subsegments. To complete the overall market engineering process and arrive at the exact statistics for all segments and subsegments, the market breakdown and data triangulation procedures have been employed, wherever applicable. The data has been triangulated by studying various factors and trends from both the demand and supply sides. Along with this, the market has been validated using both top-down and bottom-up approaches.
Report Objectives
- To describe and forecast the global automatic checkweigher market by type, technology, industry, and geography in terms of value
- To describe and forecast the market size for various segments by region—North America, Europe, Asia Pacific (APAC), and Rest of the World (RoW), in terms of value
- To describe factors impacting the price of automatic checkweighers and utilization of automatic checkweighers during primary and secondary packaging
- To provide detailed information regarding drivers, restraints, opportunities, and challenges pertaining to the market
- To strategically analyze micro markets with respect to individual growth trends, prospects, and contribution to the total market
- To strategically profile key players and comprehensively analyze their market ranking in terms of revenue and core competencies
- To understand the competitive landscape and identify major growth strategies adopted by players across key regions
- To analyze the competitive developments such as product launches and expansions in the market
Available Customizations:
With the given market data, MarketsandMarkets offers customizations according to the companies’ specific needs. The following customization options are available for the report:
Company Information:
- Detailed analysis and profiling of additional market players (up to 5)


Growth opportunities and latent adjacency in Automatic Checkweigher Market