Inspection Machines Market

Inspection Machines Market by Product (Vision Inspection, Leak Detection, X-ray Inspection, Checkweigher, Metal Detector, Software), Type (Manual, Automatic), Packaging Type (Vials, Syringes, Blister), End User (Pharma, Biotech) - Global Forecast to 2027

Report Code: PH 4491 Jan, 2023, by marketsandmarkets.com

The global inspection machines market in terms of revenue was estimated to be worth $721 million in 2022 and is poised to reach $905 million by 2027, growing at a CAGR of 4.7% from 2022 to 2027. The new research study consists of an industry trend analysis of the market. The new research study consists of industry trends, pricing analysis, patent analysis, conference and webinar materials, key stakeholders, and buying behaviour in the market. The increasing adoption of automated inspection systems in the pharmaceutical and biotechnology industries, growth in the number of product recalls, an increasing number of inspection checkpoints throughout the production line, and technological advancements in inspection systems support the growth of the market. The growing demand for used and refurbished inspection systems is expected to restrain this market's growth to a certain extent. Also, the complexities of introducing inspection machines in a production line may hamper the market's growth to a certain extent.

Global Inspection Machines Market Trends

Inspection Machines Market

To know about the assumptions considered for the study, Request for Free Sample Report

Inspection Machines Market Dynamics

Driver: The increasing number of inspection checkpoints throughout the production line

Considering the implementation of stringent regulatory mandates, coupled with the growth in production capacity and increasing cases of product recalls and product counterfeiting, manufacturers of healthcare products are investing more in their production and packaging lines to ensure effective quality control and assurance. In this regard, pharmaceutical and biotechnology companies and medical device manufacturers are adopting various inspection machines, such as checkweighers, leak detection systems, and vision inspection systems, at various levels of production and packaging operations. These machines are installed at the filling, sealing, labeling, weighing, and packaging levels of the production line to ensure the safety and accuracy of the products dispatched to consumers. Inspection machines are also used to inspect several package types, including bottles, blisters, syringes, pouches, stick packs, and cartridges. With the presence of inspection checkpoints at various production and packaging levels, the demand for inspection machines is expected to increase in major end-use industries.

Restraint: Growing demand for refurbished equipment due to the high cost of inspection machines

Production management aims to maximize profit by increasing salable output while reducing the cost related to product recalls or re-inspection due to compromised safety or quality. Compliance with regulations is also imperative as the smallest defect in the production or packaging may contaminate the product and ultimately reduce consumer safety. Thus, several manufacturers are adopting the use of inspection systems throughout their production pipeline. However, as highlighted by the European Federation of Pharmaceutical Industries and Associations (EFPIA), the cost and time frame for this implementation are the biggest concerns in the packaging industry. The inspection of individual products requires significant capital investments from pharmaceutical companies, medical device contract manufacturers, and packaging manufacturers. While larger drug developers may have the resources to deal with the financial demands of inspection, small and medium-sized companies face significant challenges in this regard. New entrants must bear huge production costs and very low margins. This is because new facilities cannot quickly attain economies of scale. Simultaneously, they need to maintain the prices according to the prevailing market trend to sustain competition. Many pharmaceutical companies are concerned about the cost implications of introducing new technologies and processes. Currently, machine vision systems can cost between USD 5,000 and USD 20,000. Moreover, a skilled workforce is required to effectively inspect the defects in the packaging and the leak detection for each product and perform similar tasks. Thus, the high costs involved restrict the implementation of inspection machines among pharmaceutical & biopharmaceutical companies and medical device manufacturers (especially among smaller organizations and in regions that lack stringent regulations).

Various types of used and refurbished inspection machines, including vision inspection machines, leak detection systems, metal detectors, and X-ray inspection machines, are available in the market at a lower price than new equipment. As a result, several small and medium-sized pharmaceutical & biotechnology companies and medical device manufacturers are increasingly opting for used and refurbished inspection machines to overcome budget constraints. This trend is expected to affect the volume sales of new equipment and, in turn, affect the profit margins of companies manufacturing and offering new equipment in the market.

Opportunity: Technological advancement

The inspection machines market is witnessing robust growth due to the growing stringency of regulatory authorities concerning the safety and quality of products being manufactured and the need to avoid financial losses due to product recalls or packaging issues. The increasing focus on effective production and packaging process and curbing re-inspection or manual inspection are also factors leading to a growing number of players operating in the market to develop cost-effective automated systems.

The major players operating in the market are making significant investments in R&D activities to expand their product portfolio and strengthen their market share. The integration of pharmaceutical, food, and medical product systems, with inspection systems such as weighing machines, metal detectors, and X-ray inspection systems, are some of the technological developments in the inspection machines industry. Several combinations of checkweighers, metal detectors, and machine inspection systems with leak detection systems help improve the packaging of products and help avoid the recall of medical devices, food products, and pharmaceutical products throughout the supply chain.

Related to current technology, sensor improvements and CPU processing speeds have increased significantly in the last five years. Moreover, an overall increase in the camera dynamic range and resolution, real-time detection of moving objects, use of color information, analysis of point clouds, cloud computing of machine vision, and computational cameras are some of the major technological developments that are expected to take place in vision inspection systems soon. Smart camera-based vision inspection systems are well-suited for healthcare applications and are popular due to their lower cost, ease of integration into manufacturing processes, and ease of operation. Considering this, industry players are now moving towards providing an embedded smart camera-based system in their offerings. With the advent of integrated inspection machine systems, manufacturers can now provide advanced vision and leak detection systems to the pharmaceutical, medical devices, and food industries. Such developments signify the rising focus of industry players on investing in advanced inspection machine technologies, which is expected to create significant opportunities for the growth of this market

Challenge: Complexities in integrating inspection machines

Inspections are a tool to prevent failures of equipment, quality defects and process deviations. The integration of inspection machines in the production and packaging segment is difficult and challenging, considering the requirements of various end-user and considering the complexity of machines.

The vision inspection systems segment accounts for the largest share of the inspection machines industry, by product, in 2021

On the basis of product, the inspection machines market is divided into leak detection systems, X-ray inspection systems, combination systems, checkweighers, metal detectors, software, and other inspection systems. During the forecast period (2022-2027), the combination systems segment accounted for the highest growth in the market. Due to various advantages of combination systems over other inspections systems, the market growth in the segment is expected.

The fully automated machines segment of the inspection machines industry is expected to grow at the highest CAGR during the forecast period (2022-2027).

On the basis of type, the inspection machines market is segmented into fully automated machines, semi-automated machines, and manual machines. The fully automated machines segment is expected to witness the highest growth during the forecast period. The growing demand for quality requirements as part of the zero-error strategy, increasing need to reduce particles and cosmetic defects, and technological advancements in this segment will continue to drive market growth.

In 2021, the ampoules & vials segment is expected to account for the largest share of the inspection machines industry. The rising adoption of inspection systems in biopharmaceutical and pharmaceutical industry is driving the growth in the market in the segment.

On the basis of end user, the inspection machines market is divided into pharmaceutical & biotechnology companies, medical device manufacturers, food processing & packaging companies, and other end-users (nutraceuticals and cosmetic companies). During the forecast period (2022-2027), Pharmaceutical & biotechnology companies end-user segment is expected to grow at the highest CAGR in the market. Factor such as quality checks and quality assurance in the pharmaceutical industry, growth is being driven  in the segment.

North America is expected to account for the largest share of the inspection machines industry.

In 2021, the largest share of the inspection machines market is accounted by North, followed by Europe, the Asia Pacific, Latin America, and the Middle East & Africa. Factors such as emerging markets, and various opportunities for several players present in the region are driving the market.

Inspection Machines Market by Region

To know about the assumptions considered for the study, download the pdf brochure

The prominent players in this market are Robert Bosch GmbH (Germany), Körber AG (Germany), METTLER-TOLEDO International Inc. (US), ACG Group (India), Cognex Corporation (US), OMRON Corporation (Japan), Teledyne Technologies Incorporated (US), Brevetti CEA SpA (Italy).

Scope of the Inspection Machines Industry:

Report Metric

Details

Market Revenue in 2022

$721 million

Projected Revenue by 2027

$905 million

Revenue Rate

Poised to Grow at a CAGR of 4.7%

Market Driver

The increasing number of inspection checkpoints throughout the production line

Market Opportunity

Technological advancement

The study categorizes the Inspection Machines Market to forecast revenue and analyze trends in each of the following submarkets:

By Product

  • Vision Inspection Systems
  • Leak Detection Systems
  • X-ray Inspection Systems
  • Combination Systems
  • Checkweighers
  • Metal Detectors
  • Software
  • Other Inspection Systems

By Type

  • Fully automated Inspection Machines
  • Semi-automated Inspection Machines
  • Manual Inspection Machines

By packaging type

  • Ampoules & Vials
  • Syringes
  • Blister Packaging
  • Bottles
  • Other Packaging Types

By End User

  • Pharmaceutical & Biotechnology Companies
  • Medical Device Manufacturers
  • Food Processing & Packaging Companies
  • Other End Users

By Region

  • North America
    • US
    • Canada
  • Europe
    • Germany
    • UK
    • France
    • Italy
    • Spain
    • Switzerland
    • Rest of Europe
  • Asia Pacific
    • China
    • India
    • Japan
    • South Korea
    • Rest of APAC
  • Latin America
    • Brazil
    • Mexico
    • Rest of Latin America
  • Middle East & Africa

Recent Developments of Inspection Machines Industry

  • In 2022, METTLER TOLEDO International Inc. launched combination checkweighing and serialization system for pharma and cosmetics producers.
  • In 2022, OPTEL acquires pharma track & trace unit of Körber. The acquisition, would allow OPTEL to leverage the unit’s expertise in pharmaceutical and agrochemical track & trace technologies, provide the company with a second foothold in the European marketplace and contribute to its diversification plans.
  • In 2021, Cognex Corporation Launched the In-Sight 3D-L4000 Vision System.
  • In 2021, Antares Product Inspection Global Centre of Excellence for X-ray in Hertfordshire, UK increases the UK manufacturing footprint for x-ray inspection technologies by more than 80%.
  • In 2020, Antares partnered with IMA; a company engaged in the design & production of machines for process automation and packaging of pharmaceutical & cosmetic products.
  • In 2020, Thermo Scientific Sentinel 1000 Selectscan Metal Detector system features two technologies intended to help food and personal care manufacturers achieve a higher level of safety and quality.

Frequently Asked Questions (FAQ):

To speak to our analyst for a discussion on the above findings, click Speak to Analyst

TABLE OF CONTENTS
 
1 INTRODUCTION (Page No. - 35)
    1.1 STUDY OBJECTIVES 
    1.2 MARKET DEFINITION 
           1.2.1 INCLUSIONS AND EXCLUSIONS
    1.3 STUDY SCOPE 
          FIGURE 1 INSPECTION MACHINES MARKET SEGMENTATION
    1.4 YEARS CONSIDERED 
    1.5 CURRENCY CONSIDERED 
    1.6 LIMITATIONS 
    1.7 STAKEHOLDERS 
    1.8 SUMMARY OF CHANGES 
           1.8.1 RECESSION IMPACT
 
2 RESEARCH METHODOLOGY (Page No. - 39)
    2.1 RESEARCH APPROACH 
          FIGURE 2 RESEARCH DESIGN
           2.1.1 SECONDARY RESEARCH
                    2.1.1.1 Key data from secondary sources
           2.1.2 PRIMARY RESEARCH
                    2.1.2.1 Primary sources
                    2.1.2.2 Key data from primary sources
                    2.1.2.3 Breakdown of primaries
                                FIGURE 3 BREAKDOWN OF PRIMARY INTERVIEWS: BY COMPANY TYPE, DESIGNATION, AND REGION
    2.2 MARKET SIZE ESTIMATION 
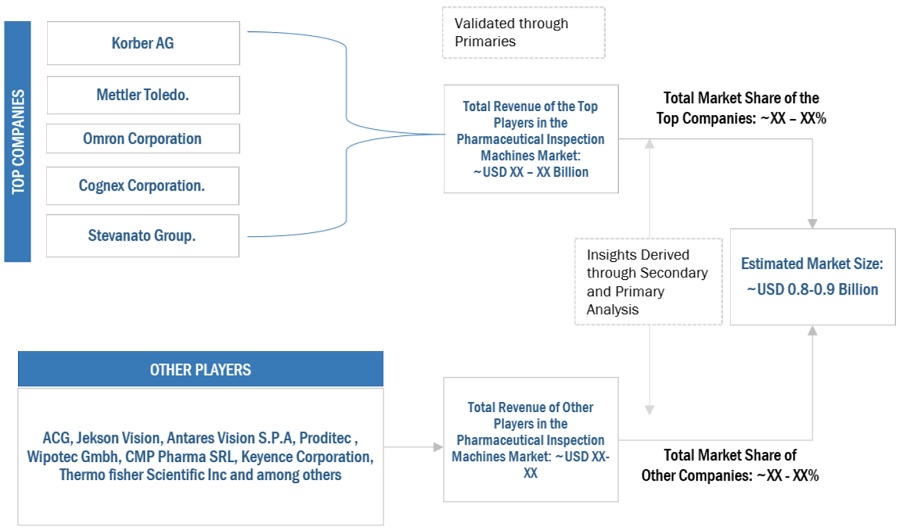
          FIGURE 4 INSPECTION MACHINES MARKET SIZE ESTIMATION (SUPPLY-SIDE ANALYSIS), 2021
          FIGURE 5 MARKET SIZE ESTIMATION: APPROACH 1 (REVENUE SHARE ANALYSIS)
          FIGURE 6 MARKET SIZE ESTIMATION: REVENUE SHARE ANALYSIS OF TOP PLAYERS, 2021
          FIGURE 7 INSIGHTS OF INDUSTRY EXPERTS
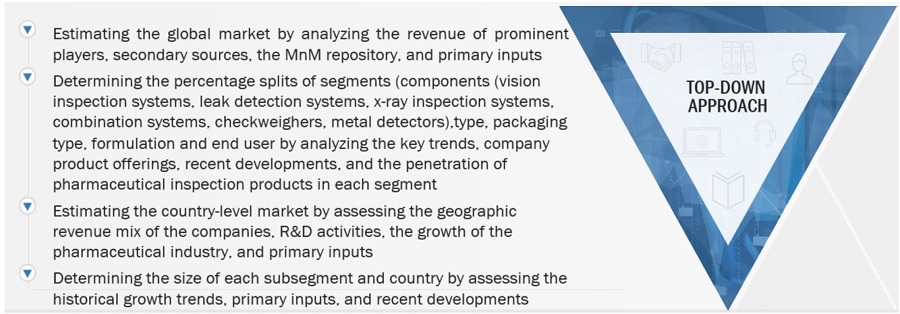
          FIGURE 8 TOP-DOWN APPROACH
    2.3 MARKET GROWTH RATE PROJECTIONS 
          FIGURE 9 INSPECTION MACHINES MARKET (SUPPLY-SIDE): CAGR PROJECTIONS
          FIGURE 10 INSPECTION MACHINES MARKET (DEMAND-SIDE): GROWTH ANALYSIS OF DEMAND-SIDE FACTORS
    2.4 DATA TRIANGULATION APPROACH 
          FIGURE 11 DATA TRIANGULATION METHODOLOGY
    2.5 MARKET SHARE ESTIMATION 
    2.6 ASSUMPTIONS 
    2.7 RECESSION IMPACT 
          TABLE 1 GLOBAL INFLATION RATE PROJECTIONS, 2024-2027 (% GROWTH)
 
3 EXECUTIVE SUMMARY (Page No. - 53)
    FIGURE 12 INSPECTION MACHINES MARKET SIZE, BY PRODUCT, 2022 VS. 2027 (USD MILLION)
    FIGURE 13 INSPECTION MACHINES MARKET SIZE, BY TYPE, 2022 VS. 2027 (USD MILLION)
    FIGURE 14 INSPECTION MACHINES MARKET SHARE, BY PACKAGING TYPE, 2022 VS. 2027 (USD MILLION)
    FIGURE 15 INSPECTION MACHINES MARKET SHARE, BY END USER, 2022 VS. 2027 (USD MILLION)
    FIGURE 16 GEOGRAPHIC ANALYSIS: INSPECTION MACHINES MARKET
 
4 PREMIUM INSIGHTS (Page No. - 57)
    4.1 INSPECTION MACHINES: MARKET OVERVIEW 
          FIGURE 17 RISING NEED FOR REGULATORY COMPLIANCE TO DRIVE MARKET GROWTH
    4.2 ASIA PACIFIC: INSPECTION MACHINES MARKET SIZE, BY PACKAGING TYPE 
          FIGURE 18 AMPOULES & VIALS HELD LARGEST SHARE OF APAC MARKET IN 2021
    4.3 INSPECTION MACHINES MARKET SHARE: GEOGRAPHIC GROWTH OPPORTUNITIES 
          FIGURE 19 CHINA TO SHOW HIGHEST GROWTH DURING 2022–2027
    4.4 INSPECTION MACHINES MARKET SHARE, BY REGION (2020–2027) 
          FIGURE 20 NORTH AMERICA TO DOMINATE MARKET DURING FORECAST PERIOD
    4.5 INSPECTION MACHINES MARKET SHARE: DEVELOPED VS. DEVELOPING MARKETS 
          FIGURE 21 DEVELOPING MARKETS TO REGISTER HIGHER GROWTH RATE
 
5 MARKET OVERVIEW (Page No. - 61)
    5.1 INTRODUCTION 
    5.2 MARKET DYNAMICS 
          FIGURE 22 INSPECTION MACHINES MARKET FORECAST: DRIVERS, RESTRAINTS, OPPORTUNITIES, AND CHALLENGES
          TABLE 2 INSPECTION MACHINES MARKET FORECAST: IMPACT ANALYSIS
           5.2.1 MARKET DRIVERS
                    5.2.1.1 Growing mandates to maintain GMP compliance
                    5.2.1.2 Increasing pharmaceutical & biotechnology R&D expenditure
                    5.2.1.3 Growing product recalls
                    5.2.1.4 Increasing inspection checkpoints throughout production
                    5.2.1.5 Growth in medical devices industry
           5.2.2 MARKET RESTRAINTS
                    5.2.2.1 Growing demand for refurbished equipment due to high cost of inspection machines
                    5.2.2.2 Lack of access in emerging markets
           5.2.3 MARKET OPPORTUNITIES
                    5.2.3.1 Technological advancements
                    5.2.3.2 Rising outsourcing of manufacturing operations to emerging economies
           5.2.4 MARKET CHALLENGES
                    5.2.4.1 Complexities in integrating inspection machines
    5.3 INDUSTRY TRENDS 
           5.3.1 DEMAND FOR COMBINATION SYSTEMS
           5.3.2 GRADUAL SHIFT TO SMART CAMERAS
    5.4 REGULATORY GUIDELINES, BY INDUSTRY 
           5.4.1 PHARMACEUTICALS AND BIOTECHNOLOGY
           5.4.2 FOOD PACKAGING AND PROCESSING
           5.4.3 MEDICAL DEVICES
    5.5 REGULATORY ANALYSIS 
           5.5.1 NORTH AMERICA
                    TABLE 3 US: KEY REGULATIONS & STANDARDS GOVERNING INSPECTION OF PACKAGING
                    TABLE 4 CANADA: KEY REGULATIONS & STANDARDS GOVERNING INSPECTION OF PACKAGING
           5.5.2 EUROPE
           5.5.3 ASIA PACIFIC
                    TABLE 5 ASIA PACIFIC: KEY REGULATIONS & STANDARDS GOVERNING PHARMACEUTICAL PACKAGING EQUIPMENT FOR KEY COUNTRIES
           5.5.4 BRAZIL
           5.5.5 STRINGENCY OF REGULATIONS
                    TABLE 6 STRINGENCY OF REGULATIONS FOR INSPECTION MACHINES, BY REGION
    5.6 END-USER DEMAND ANALYSIS 
           5.6.1 DEMAND ANALYSIS FOR INSPECTION MACHINES
           5.6.2 UNMET NEEDS
           5.6.3 CHALLENGES ASSOCIATED WITH MANUAL INSPECTION/NON-INSPECTION OF PRODUCTS: END-USER PERSPECTIVE
    5.7 VALUE CHAIN ANALYSIS 
          FIGURE 23 INSPECTION MACHINES MARKET FORECAST: VALUE CHAIN ANALYSIS
    5.8 TECHNOLOGY ANALYSIS 
    5.9 PRICING ANALYSIS 
          TABLE 7 SELLING PRICE OF INSPECTION MACHINES BY TOP PLAYERS
    5.10 PATENT ANALYSIS 
           FIGURE 24 PATENT APPLICATIONS FOR INSPECTION MACHINES MARKET FORECAST, JANUARY 2012–DECEMBER 2022
    5.11 SUPPLY CHAIN ANALYSIS 
           FIGURE 25 INSPECTION MACHINES MARKET FORECAST: SUPPLY CHAIN ANALYSIS
    5.12 ECOSYSTEM ANALYSIS 
           TABLE 8 INSPECTION MACHINES MARKET ECOSYSTEM
    5.13 KEY CONFERENCES AND EVENTS IN 2022–2023 
           TABLE 9 INSPECTION MACHINES MARKET TRENDS: DETAILED LIST OF CONFERENCES AND EVENTS
    5.14 PORTER’S FIVE FORCES ANALYSIS 
           TABLE 10 INSPECTION MACHINES MARKET TRENDS: PORTER’S FIVE FORCES ANALYSIS
           5.14.1 THREAT OF NEW ENTRANTS
           5.14.2 THREAT OF NEW SUBSTITUTES
           5.14.3 BARGAINING POWER OF SUPPLIERS
           5.14.4 BARGAINING POWER OF BUYERS
           5.14.5 INTENSITY OF COMPETITIVE RIVALRY
    5.15 KEY STAKEHOLDERS AND BUYING CRITERIA 
           5.15.1 KEY STAKEHOLDERS IN BUYING PROCESS
                     FIGURE 26 INFLUENCE OF STAKEHOLDERS ON BUYING PROCESS OF INSPECTION MACHINES
           5.15.2 BUYING CRITERIA FOR INSPECTION MACHINES MARKET
                     FIGURE 27 KEY BUYING CRITERIA FOR END USERS
    5.16 TRADE ANALYSIS 
           TABLE 11 TOP 10 IMPORTERS OF MEASURING OR CHECKING INSTRUMENTS, APPLIANCES, AND MACHINES
           TABLE 12 TOP 10 EXPORTERS OF MEASURING OR CHECKING INSTRUMENTS, APPLIANCES, AND MACHINES
 
6 INSPECTION MACHINES MARKET TRENDS, BY PRODUCT (Page No. - 82)
    6.1 INTRODUCTION 
          FIGURE 28 VISION INSPECTION SYSTEMS SEGMENT TO HOLD LARGEST SHARE
          TABLE 13 INSPECTION MACHINES MARKET TRENDS, BY PRODUCT, 2020–2027 (USD MILLION)
    6.2 VISION INSPECTION SYSTEMS 
           6.2.1 VISION INSPECTION SYSTEMS TO DOMINATE MARKET
                    TABLE 14 MAJOR VISION INSPECTION SYSTEMS OFFERED, BY COMPANY
                    TABLE 15 VISION INSPECTION SYSTEMS MARKET, BY REGION, 2020–2027 (USD MILLION)
                    TABLE 16 NORTH AMERICA: VISION INSPECTION SYSTEMS MARKET, BY COUNTRY, 2020–2027 (USD MILLION)
                    TABLE 17 EUROPE: VISION INSPECTION SYSTEMS MARKET, BY COUNTRY, 2020–2027 (USD MILLION)
                    TABLE 18 ASIA PACIFIC: VISION INSPECTION SYSTEMS MARKET, BY COUNTRY, 2020–2027 (USD MILLION)
                    TABLE 19 LATIN AMERICA: VISION INSPECTION SYSTEMS MARKET, BY COUNTRY, 2020–2027 (USD MILLION)
    6.3 X-RAY INSPECTION SYSTEMS 
           6.3.1 DEMAND TO REDUCE PACKAGING ERRORS TO DRIVE GROWTH
                    TABLE 20 MAJOR X-RAY INSPECTION SYSTEMS OFFERED, BY COMPANY
                    TABLE 21 X-RAY INSPECTION SYSTEMS MARKET, BY REGION, 2020–2027 (USD MILLION)
                    TABLE 22 NORTH AMERICA: X-RAY INSPECTION SYSTEMS MARKET, BY COUNTRY, 2020–2027 (USD MILLION)
                    TABLE 23 EUROPE: X-RAY INSPECTION SYSTEMS MARKET, BY COUNTRY, 2020–2027 (USD MILLION)
                    TABLE 24 ASIA PACIFIC: X-RAY INSPECTION SYSTEMS MARKET, BY COUNTRY, 2020–2027 (USD MILLION)
                    TABLE 25 LATIN AMERICA: X-RAY INSPECTION SYSTEMS MARKET, BY COUNTRY, 2020–2027 (USD MILLION)
    6.4 LEAK DETECTION SYSTEMS 
           6.4.1 RISING ADOPTION IN PHARMACEUTICAL APPLICATIONS TO BOOST MARKET
                    TABLE 26 MAJOR LEAK DETECTION SYSTEMS OFFERED, BY COMPANY
                    TABLE 27 LEAK DETECTION SYSTEMS MARKET, BY REGION, 2020–2027 (USD MILLION)
                    TABLE 28 NORTH AMERICA: LEAK DETECTION SYSTEMS MARKET, BY COUNTRY, 2020–2027 (USD MILLION)
                    TABLE 29 EUROPE: LEAK DETECTION SYSTEMS MARKET, BY COUNTRY, 2020–2027 (USD MILLION)
                    TABLE 30 ASIA PACIFIC: LEAK DETECTION SYSTEMS MARKET, BY COUNTRY, 2020–2027 (USD MILLION)
                    TABLE 31 LATIN AMERICA: LEAK DETECTION SYSTEMS MARKET, BY COUNTRY, 2020–2027 (USD MILLION)
    6.5 METAL DETECTORS 
           6.5.1 EMPHASIS ON METAL DETECTION IN FOOD INDUSTRY TO BOOST DEMAND
                    TABLE 32 MAJOR METAL DETECTORS OFFERED, BY COMPANY
                    TABLE 33 METAL DETECTORS MARKET, BY REGION, 2020–2027 (USD MILLION)
                    TABLE 34 NORTH AMERICA: METAL DETECTORS MARKET, BY COUNTRY, 2020–2027 (USD MILLION)
                    TABLE 35 EUROPE: METAL DETECTORS MARKET, BY COUNTRY, 2020–2027 (USD MILLION)
                    TABLE 36 ASIA PACIFIC: METAL DETECTORS MARKET, BY COUNTRY, 2020–2027 (USD MILLION)
                    TABLE 37 LATIN AMERICA: METAL DETECTORS MARKET, BY COUNTRY, 2020–2027 (USD MILLION)
    6.6 CHECKWEIGHERS 
           6.6.1 NEED TO AVOID OVERFILLING TO ENSURE CHECKWEIGHER USE
                    TABLE 38 MAJOR CHECKWEIGHERS OFFERED, BY COMPANY
                    TABLE 39 CHECKWEIGHERS MARKET, BY REGION, 2020–2027 (USD MILLION)
                    TABLE 40 NORTH AMERICA: CHECKWEIGHERS MARKET, BY COUNTRY, 2020–2027 (USD MILLION)
                    TABLE 41 EUROPE: CHECKWEIGHERS MARKET, BY COUNTRY, 2020–2027 (USD MILLION)
                    TABLE 42 ASIA PACIFIC: CHECKWEIGHERS MARKET, BY COUNTRY, 2020–2027 (USD MILLION)
                    TABLE 43 LATIN AMERICA: CHECKWEIGHERS MARKET, BY COUNTRY, 2020–2027 (USD MILLION)
    6.7 SOFTWARE 
           6.7.1 RISING NEED TO IMPROVE INSPECTION EFFICIENCY TO EXPEDITE SOFTWARE ADOPTION
                    TABLE 44 MAJOR SOFTWARE SOLUTIONS OFFERED, BY COMPANY
                    TABLE 45 SOFTWARE MARKET, BY REGION, 2020–2027 (USD MILLION)
                    TABLE 46 NORTH AMERICA: SOFTWARE MARKET, BY COUNTRY, 2020–2027 (USD MILLION)
                    TABLE 47 EUROPE: SOFTWARE MARKET, BY COUNTRY, 2020–2027 (USD MILLION)
                    TABLE 48 ASIA PACIFIC: SOFTWARE MARKET, BY COUNTRY, 2020–2027 (USD MILLION)
                    TABLE 49 LATIN AMERICA: SOFTWARE MARKET, BY COUNTRY, 2020–2027 (USD MILLION)
    6.8 COMBINATION SYSTEMS 
           6.8.1 TECHNOLOGICAL ADVANCEMENTS TOWARD SYSTEM INTEGRATION TO SUPPORT MARKET GROWTH
                    TABLE 50 MAJOR COMBINATION SYSTEMS OFFERED, BY COMPANY
                    TABLE 51 COMBINATION SYSTEMS MARKET, BY REGION, 2020–2027 (USD MILLION)
                    TABLE 52 NORTH AMERICA: COMBINATION SYSTEMS MARKET, BY COUNTRY, 2020–2027 (USD MILLION)
                    TABLE 53 EUROPE: COMBINATION SYSTEMS MARKET, BY COUNTRY, 2020–2027 (USD MILLION)
                    TABLE 54 ASIA PACIFIC: COMBINATION SYSTEMS MARKET, BY COUNTRY, 2020–2027 (USD MILLION)
                    TABLE 55 LATIN AMERICA: COMBINATION SYSTEMS MARKET, BY COUNTRY, 2020–2027 (USD MILLION)
    6.9 OTHER INSPECTION SYSTEMS 
          TABLE 56 OTHER INSPECTION SYSTEMS MARKET, BY REGION, 2020–2027 (USD MILLION)
          TABLE 57 NORTH AMERICA: OTHER INSPECTION SYSTEMS MARKET, BY COUNTRY, 2020–2027 (USD MILLION)
          TABLE 58 EUROPE: OTHER INSPECTION SYSTEMS MARKET, BY COUNTRY, 2020–2027 (USD MILLION)
          TABLE 59 ASIA PACIFIC: OTHER INSPECTION SYSTEMS MARKET, BY COUNTRY, 2020–2027 (USD MILLION)
          TABLE 60 LATIN AMERICA: OTHER INSPECTION SYSTEMS MARKET, BY COUNTRY, 2020–2027 (USD MILLION)
    6.10 CUSTOMIZATION: VISION AND X-RAY INSPECTION SYSTEMS MARKETS, BY PACKAGING TYPE 
           TABLE 61 VISION INSPECTION SYSTEMS MARKET FOR AMPOULES & VIALS, BY REGION, 2020–2027 (USD MILLION)
           TABLE 62 VISION INSPECTION SYSTEMS MARKET FOR SYRINGES, BY REGION, 2020–2027 (USD MILLION)
           TABLE 63 X-RAY INSPECTION SYSTEMS MARKET FOR AMPOULES & VIALS, BY REGION, 2020–2027 (USD MILLION)
           TABLE 64 X-RAY INSPECTION SYSTEMS MARKET FOR SYRINGES, BY REGION, 2020–2027 (USD MILLION)
 
7 INSPECTION MACHINES MARKET TRENDS, BY TYPE (Page No. - 110)
    7.1 INTRODUCTION 
          FIGURE 29 FULLY AUTOMATED INSPECTION MACHINES SEGMENT TO WITNESS HIGHEST GROWTH
          TABLE 65 INSPECTION MACHINES MARKET OVERVIEW, BY TYPE, 2020–2027 (USD MILLION)
    7.2 FULLY AUTOMATED INSPECTION MACHINES 
           7.2.1 FULLY AUTOMATED SYSTEMS TO DOMINATE MARKET
                    TABLE 66 FULLY AUTOMATED INSPECTION MACHINES MARKET OVERVIEW, BY REGION, 2020–2027 (USD MILLION)
                    TABLE 67 NORTH AMERICA: FULLY AUTOMATED INSPECTION MACHINES MARKET, BY COUNTRY, 2020–2027 (USD MILLION)
                    TABLE 68 EUROPE: FULLY AUTOMATED INSPECTION MACHINES MARKET, BY COUNTRY, 2020–2027 (USD MILLION)
                    TABLE 69 ASIA PACIFIC: FULLY AUTOMATED INSPECTION MACHINES MARKET, BY COUNTRY, 2020–2027 (USD MILLION)
                    TABLE 70 LATIN AMERICA: FULLY AUTOMATED INSPECTION SYSTEMS MARKET, BY COUNTRY, 2020–2027 (USD MILLION)
    7.3 SEMI-AUTOMATED INSPECTION MACHINES 
           7.3.1 SEMI-AUTOMATED SYSTEMS MAJORLY ADOPTED IN PHARMACEUTICAL INDUSTRY FOR QUALITY CONTROL
                    TABLE 71 SEMI-AUTOMATED INSPECTION MACHINES MARKET OVERVIEW, BY REGION, 2020–2027 (USD MILLION)
                    TABLE 72 NORTH AMERICA: SEMI-AUTOMATED INSPECTION MACHINES MARKET, BY COUNTRY, 2020–2027 (USD MILLION)
                    TABLE 73 EUROPE: SEMI-AUTOMATED INSPECTION MACHINES MARKET, BY COUNTRY, 2020–2027 (USD MILLION)
                    TABLE 74 ASIA PACIFIC: SEMI-AUTOMATED INSPECTION MACHINES MARKET, BY COUNTRY, 2020–2027 (USD MILLION)
                    TABLE 75 LATIN AMERICA: SEMI-AUTOMATED INSPECTION MACHINES MARKET, BY COUNTRY, 2020–2027 (USD MILLION)
    7.4 MANUAL INSPECTION MACHINES 
           7.4.1 FOCUS ON REJECT RE-INSPECTION TO SUPPORT USE OF MANUAL INSPECTION MACHINES
                    TABLE 76 MANUAL INSPECTION MACHINES MARKET OVERVIEW, BY REGION, 2020–2027 (USD MILLION)
                    TABLE 77 NORTH AMERICA: MANUAL INSPECTION MACHINES MARKET, BY COUNTRY, 2020–2027 (USD MILLION)
                    TABLE 78 EUROPE: MANUAL INSPECTION MACHINES MARKET, BY COUNTRY, 2020–2027 (USD MILLION)
                    TABLE 79 ASIA PACIFIC: MANUAL INSPECTION MACHINES MARKET, BY COUNTRY, 2020–2027 (USD MILLION)
                    TABLE 80 LATIN AMERICA: MANUAL INSPECTION MACHINES MARKET, BY COUNTRY, 2020–2027 (USD MILLION)
 
8 INSPECTION MACHINES MARKET OVERVIEW, BY PACKAGING TYPE (Page No. - 120)
    8.1 INTRODUCTION 
          FIGURE 30 AMPOULES & VIALS SEGMENT TO WITNESS HIGHEST GROWTH
          TABLE 81 INSPECTION MACHINES MARKET REPORT, BY PACKAGING TYPE, 2020–2027 (USD MILLION)
    8.2 AMPOULES & VIALS 
           8.2.1 INCREASING DEMAND FOR VACCINES AND BIOPHARMACEUTICALS TO DRIVE GROWTH
                    TABLE 82 AMPOULE & VIAL INSPECTION MACHINES MARKET REPORT, BY REGION, 2020–2027 (USD MILLION)
                    TABLE 83 NORTH AMERICA: AMPOULE & VIAL INSPECTION MACHINES MARKET, BY COUNTRY, 2020–2027 (USD MILLION)
                    TABLE 84 EUROPE: AMPOULE & VIAL INSPECTION MACHINES MARKET, BY COUNTRY, 2020–2027 (USD MILLION)
                    TABLE 85 ASIA PACIFIC: AMPOULE & VIAL INSPECTION MACHINES MARKET, BY COUNTRY, 2020–2027 (USD MILLION)
                    TABLE 86 LATIN AMERICA: AMPOULE & VIAL INSPECTION MACHINES MARKET, BY COUNTRY, 2020–2027 (USD MILLION)
    8.3 SYRINGES 
           8.3.1 RISING ADOPTION OF PREFILLED SYRINGES TO SUPPORT MARKET GROWTH
                    TABLE 87 SYRINGE INSPECTION MACHINES MARKET REPORT, BY REGION, 2020–2027 (USD MILLION)
                    TABLE 88 NORTH AMERICA: SYRINGE INSPECTION MACHINES MARKET, BY COUNTRY, 2020–2027 (USD MILLION)
                    TABLE 89 EUROPE: SYRINGE INSPECTION MACHINES MARKET, BY COUNTRY, 2020–2027 (USD MILLION)
                    TABLE 90 ASIA PACIFIC: SYRINGE INSPECTION MACHINES MARKET, BY COUNTRY, 2020–2027 (USD MILLION)
                    TABLE 91 LATIN AMERICA: SYRINGE INSPECTION MACHINES MARKET, BY COUNTRY, 2020–2027 (USD MILLION)
    8.4 BOTTLES 
           8.4.1 GROWING PRODUCTION RATE TO EMPHASIZE BOTTLE INSPECTION
                    TABLE 92 BOTTLE INSPECTION MACHINES MARKET REPORT, BY REGION, 2020–2027 (USD MILLION)
                    TABLE 93 NORTH AMERICA: BOTTLE INSPECTION MACHINES MARKET, BY COUNTRY, 2020–2027 (USD MILLION)
                    TABLE 94 EUROPE: BOTTLE INSPECTION MACHINES MARKET, BY COUNTRY, 2020–2027 (USD MILLION)
                    TABLE 95 ASIA PACIFIC: BOTTLE INSPECTION MACHINES MARKET, BY COUNTRY, 2020–2027 (USD MILLION)
                    TABLE 96 LATIN AMERICA: BOTTLE INSPECTION MACHINES MARKET, BY COUNTRY, 2020–2027 (USD MILLION)
    8.5 BLISTER 
           8.5.1 EASE OF MANUFACTURING TO DRIVE GROWTH
                    TABLE 97 BLISTER INSPECTION MACHINES MARKET REPORT, BY REGION, 2020–2027 (USD MILLION)
                    TABLE 98 NORTH AMERICA: BLISTER INSPECTION MACHINES MARKET, BY COUNTRY, 2020–2027 (USD MILLION)
                    TABLE 99 EUROPE: BLISTER INSPECTION MACHINES MARKET, BY COUNTRY, 2020–2027 (USD MILLION)
                    TABLE 100 ASIA PACIFIC: BLISTER INSPECTION MACHINES MARKET, BY COUNTRY, 2020–2027 (USD MILLION)
                    TABLE 101 LATIN AMERICA: BLISTER INSPECTION MACHINES MARKET, BY COUNTRY, 2020–2027 (USD MILLION)
    8.6 OTHER PACKAGING TYPES 
          TABLE 102 INSPECTION MACHINES MARKET FOR OTHER PACKAGING TYPES, BY REGION, 2020–2027 (USD MILLION)
          TABLE 103 NORTH AMERICA: INSPECTION MACHINES MARKET FOR OTHER PACKAGING TYPES, BY COUNTRY, 2020–2027 (USD MILLION)
          TABLE 104 EUROPE: INSPECTION MACHINES MARKET FOR OTHER PACKAGING TYPES, BY COUNTRY, 2020–2027 (USD MILLION)
          TABLE 105 ASIA PACIFIC: INSPECTION MACHINES MARKET FOR OTHER PACKAGING TYPES, BY COUNTRY, 2020–2027 (USD MILLION)
          TABLE 106 LATIN AMERICA: INSPECTION MACHINES MARKET FOR OTHER PACKAGING TYPES, BY COUNTRY, 2020–2027 (USD MILLION)
 
9 INSPECTION MACHINES MARKET RESEARCH, BY END USER (Page No. - 135)
    9.1 INTRODUCTION 
          FIGURE 31 PHARMACEUTICAL & BIOTECHNOLOGY COMPANIES TO DOMINATE MARKET
          TABLE 107 INSPECTION MACHINES MARKET RESEARCH, BY END USER, 2020–2027 (USD MILLION)
    9.2 PHARMACEUTICAL & BIOTECHNOLOGY COMPANIES 
           9.2.1 PHARMA & BIOTECH SECTOR TO SHOW WIDESPREAD ADOPTION OF INSPECTION MACHINES
                    TABLE 108 INSPECTION MACHINES MARKET RESEARCH FOR PHARMACEUTICAL & BIOTECHNOLOGY COMPANIES, BY REGION, 2020–2027 (USD MILLION)
                    TABLE 109 NORTH AMERICA: INSPECTION MACHINES MARKET FOR PHARMACEUTICAL & BIOTECHNOLOGY COMPANIES, BY COUNTRY, 2020–2027 (USD MILLION)
                    TABLE 110 EUROPE: INSPECTION MACHINES MARKET FOR PHARMACEUTICAL & BIOTECHNOLOGY COMPANIES, BY COUNTRY, 2020–2027 (USD MILLION)
                    TABLE 111 ASIA PACIFIC: INSPECTION MACHINES MARKET FOR PHARMACEUTICAL & BIOTECHNOLOGY COMPANIES, BY COUNTRY, 2020–2027 (USD MILLION)
                    TABLE 112 LATIN AMERICA: INSPECTION MACHINES MARKET FOR PHARMACEUTICAL & BIOTECHNOLOGY COMPANIES, BY COUNTRY, 2020–2027 (USD MILLION)
    9.3 MEDICAL DEVICE MANUFACTURERS 
           9.3.1 INCREASING STRINGENCY OF REGULATORY MANDATES TO DRIVE UPTAKE OF INSPECTION MACHINES
                    TABLE 113 INSPECTION MACHINES MARKET RESEARCH FOR MEDICAL DEVICE MANUFACTURERS, BY REGION, 2020–2027 (USD MILLION)
                    TABLE 114 NORTH AMERICA: INSPECTION MACHINES MARKET FOR MEDICAL DEVICE MANUFACTURERS, BY COUNTRY, 2020–2027 (USD MILLION)
                    TABLE 115 EUROPE: INSPECTION MACHINES MARKET FOR MEDICAL DEVICE MANUFACTURERS, BY COUNTRY, 2020–2027 (USD MILLION)
                    TABLE 116 ASIA PACIFIC: INSPECTION MACHINES MARKET FOR MEDICAL DEVICE MANUFACTURERS, BY COUNTRY, 2020–2027 (USD MILLION)
                    TABLE 117 LATIN AMERICA: INSPECTION MACHINES MARKET FOR MEDICAL DEVICE MANUFACTURERS, BY COUNTRY, 2020–2027 (USD MILLION)
    9.4 FOOD PACKAGING & PROCESSING COMPANIES 
           9.4.1 INCREASING DEMAND FOR PROCESSED FOOD AND SAFETY CONCERNS TO SUPPORT GROWTH
                    TABLE 118 INSPECTION MACHINES MARKET RESEARCH FOR FOOD PACKAGING & PROCESSING COMPANIES, BY REGION, 2020–2027 (USD MILLION)
                    TABLE 119 NORTH AMERICA: INSPECTION MACHINES MARKET FOR FOOD PACKAGING & PROCESSING COMPANIES, BY COUNTRY, 2020–2027 (USD MILLION)
                    TABLE 120 EUROPE: INSPECTION MACHINES MARKET FOR FOOD PACKAGING & PROCESSING COMPANIES, BY COUNTRY, 2020–2027 (USD MILLION)
                    TABLE 121 ASIA PACIFIC: INSPECTION MACHINES MARKET FOR FOOD PACKAGING & PROCESSING COMPANIES, BY COUNTRY, 2020–2027 (USD MILLION)
                    TABLE 122 LATIN AMERICA: INSPECTION MACHINES MARKET FOR FOOD PACKAGING & PROCESSING COMPANIES, BY COUNTRY, 2020–2027 (USD MILLION)
    9.5 OTHER END USERS 
          TABLE 123 INSPECTION MACHINES MARKET RESEARCH FOR OTHER END USERS, BY REGION, 2020–2027 (USD MILLION)
          TABLE 124 NORTH AMERICA: INSPECTION MACHINES MARKET FOR OTHER END USERS, BY COUNTRY, 2020–2027 (USD MILLION)
          TABLE 125 EUROPE: INSPECTION MACHINES MARKET FOR OTHER END USERS, BY COUNTRY, 2020–2027 (USD MILLION)
          TABLE 126 ASIA PACIFIC: INSPECTION MACHINES MARKET FOR OTHER END USERS, BY COUNTRY, 2020–2027 (USD MILLION)
          TABLE 127 LATIN AMERICA: INSPECTION MACHINES MARKET OTHER END USERS, BY COUNTRY, 2020–2027 (USD MILLION)
 
10 INSPECTION MACHINES MARKET GRAPH, BY REGION (Page No. - 147)
     10.1 INTRODUCTION 
             FIGURE 32 INSPECTION MACHINES MARKET: GEOGRAPHIC SNAPSHOT
             TABLE 128 INSPECTION MACHINES MARKET, BY REGION, 2020–2027 (USD MILLION)
     10.2 NORTH AMERICA 
             FIGURE 33 NORTH AMERICA: INSPECTION MACHINES MARKET SNAPSHOT
             TABLE 129 NORTH AMERICA: INSPECTION MACHINES MARKET GRAPH, BY COUNTRY, 2020–2027 (USD MILLION)
             TABLE 130 NORTH AMERICA: INSPECTION MACHINES MARKET, BY PRODUCT, 2020–2027 (USD MILLION)
             TABLE 131 NORTH AMERICA: INSPECTION MACHINES MARKET, BY TYPE, 2020–2027 (USD MILLION)
             TABLE 132 NORTH AMERICA: INSPECTION MACHINES MARKET, BY PACKAGING TYPE, 2020–2027 (USD MILLION)
             TABLE 133 NORTH AMERICA: INSPECTION MACHINES MARKET, BY END USER, 2020–2027 (USD MILLION)
             10.2.1 US
                        10.2.1.1 US to dominate North American inspection machines market
                                      TABLE 134 US: INSPECTION MACHINES MARKET, BY PRODUCT, 2020–2027 (USD MILLION)
                                      TABLE 135 US: INSPECTION MACHINES MARKET, BY TYPE, 2020–2027 (USD MILLION)
                                      TABLE 136 US: INSPECTION MACHINES MARKET, BY PACKAGING TYPE, 2020–2027 (USD MILLION)
                                      TABLE 137 US: INSPECTION MACHINES MARKET, BY END USER, 2020–2027 (USD MILLION)
             10.2.2 CANADA
                        10.2.2.1 Improving healthcare quality and focus on patient safety to support market growth
                                      TABLE 138 CANADA: INSPECTION MACHINES MARKET GRAPH, BY PRODUCT, 2020–2027 (USD MILLION)
                                      TABLE 139 CANADA: INSPECTION MACHINES MARKET, BY TYPE, 2020–2027 (USD MILLION)
                                      TABLE 140 CANADA: INSPECTION MACHINES MARKET, BY PACKAGING TYPE, 2020–2027 (USD MILLION)
                                      TABLE 141 CANADA: INSPECTION MACHINES MARKET, BY END USER, 2020–2027 (USD MILLION)
             10.2.3 RECESSION IMPACT: NORTH AMERICA
     10.3 EUROPE 
             TABLE 142 EUROPE: INSPECTION MACHINES MARKET, BY COUNTRY, 2020–2027 (USD MILLION)
             TABLE 143 EUROPE: INSPECTION MACHINES MARKET, BY PRODUCT, 2020–2027 (USD MILLION)
             TABLE 144 EUROPE: INSPECTION MACHINES MARKET, BY TYPE, 2020–2027 (USD MILLION)
             TABLE 145 EUROPE: INSPECTION MACHINES MARKET, BY PACKAGING TYPE, 2020–2027 (USD MILLION)
             TABLE 146 EUROPE: INSPECTION MACHINES MARKET, BY END USER, 2020–2027 (USD MILLION)
             10.3.1 GERMANY
                        10.3.1.1 Germany to dominate European market
                                      TABLE 147 GERMANY: INSPECTION MACHINES MARKET GRAPH, BY PRODUCT, 2020–2027 (USD MILLION)
                                      TABLE 148 GERMANY: INSPECTION MACHINES MARKET, BY TYPE, 2020–2027 (USD MILLION)
                                      TABLE 149 GERMANY: INSPECTION MACHINES MARKET, BY PACKAGING TYPE, 2020–2027 (USD MILLION)
                                      TABLE 150 GERMANY: INSPECTION MACHINES MARKET, BY END USER, 2020–2027 (USD MILLION)
             10.3.2 FRANCE
                        10.3.2.1 High healthcare spending to boost adoption of advanced products
                                      TABLE 151 FRANCE: INSPECTION MACHINES MARKET, BY PRODUCT, 2020–2027 (USD MILLION)
                                      TABLE 152 FRANCE: INSPECTION MACHINES MARKET, BY TYPE, 2020–2027 (USD MILLION)
                                      TABLE 153 FRANCE: INSPECTION MACHINES MARKET, BY PACKAGING TYPE, 2020–2027 (USD MILLION)
                                      TABLE 154 FRANCE: INSPECTION MACHINES MARKET, BY END USER, 2020–2027 (USD MILLION)
             10.3.3 ITALY
                        10.3.3.1 Improvements in healthcare access and technology to support demand for inspection machines
                                      TABLE 155 ITALY: INSPECTION MACHINES MARKET GRAPH, BY PRODUCT, 2020–2027 (USD MILLION)
                                      TABLE 156 ITALY: INSPECTION MACHINES MARKET, BY TYPE, 2020–2027 (USD MILLION)
                                      TABLE 157 ITALY: INSPECTION MACHINES MARKET, BY PACKAGING TYPE, 2020–2027 (USD MILLION)
                                      TABLE 158 ITALY: INSPECTION MACHINES MARKET, BY END USER, 2020–2027 (USD MILLION)
             10.3.4 UK
                        10.3.4.1 Rising domestic market for pharmaceuticals and investments to favor product adoption
                                      TABLE 159 UK: INSPECTION MACHINES MARKET, BY PRODUCT, 2020–2027 (USD MILLION)
                                      TABLE 160 UK: INSPECTION MACHINES MARKET, BY TYPE, 2020–2027 (USD MILLION)
                                      TABLE 161 UK: INSPECTION MACHINES MARKET, BY PACKAGING TYPE, 2020–2027 (USD MILLION)
                                      TABLE 162 UK: INSPECTION MACHINES MARKET, BY END USER, 2020–2027 (USD MILLION)
             10.3.5 SPAIN
                        10.3.5.1 Increasing developments in pharmaceutical packaging industry to propel market growth
                                      TABLE 163 SPAIN: INSPECTION MACHINES MARKET GRAPH, BY PRODUCT, 2020–2027 (USD MILLION)
                                      TABLE 164 SPAIN: INSPECTION MACHINES MARKET, BY TYPE, 2020–2027 (USD MILLION)
                                      TABLE 165 SPAIN: INSPECTION MACHINES MARKET, BY PACKAGING TYPE, 2020–2027 (USD MILLION)
                                      TABLE 166 SPAIN: INSPECTION MACHINES MARKET, BY END USER, 2020–2027 (USD MILLION)
             10.3.6 SWITZERLAND
                        10.3.6.1 Increasing demand for healthcare services and growing healthcare awareness to drive market
                                      TABLE 167 SWITZERLAND: INSPECTION MACHINES MARKET SEGMENTATION, BY PRODUCT, 2020–2027 (USD MILLION)
                                      TABLE 168 SWITZERLAND: INSPECTION MACHINES MARKET, BY TYPE, 2020–2027 (USD MILLION)
                                      TABLE 169 SWITZERLAND: INSPECTION MACHINES MARKET, BY PACKAGING TYPE, 2020–2027 (USD MILLION)
                                      TABLE 170 SWITZERLAND: INSPECTION MACHINES MARKET, BY END USER, 2020–2027 (USD MILLION)
             10.3.7 REST OF EUROPE
                        TABLE 171 ROE: INSPECTION MACHINES MARKET, BY PRODUCT, 2020–2027 (USD MILLION)
                        TABLE 172 ROE: INSPECTION MACHINES MARKET, BY TYPE, 2020–2027 (USD MILLION)
                        TABLE 173 ROE: INSPECTION MACHINES MARKET, BY PACKAGING TYPE, 2020–2027 (USD MILLION)
                        TABLE 174 ROE: INSPECTION MACHINES MARKET, BY END USER, 2020–2027 (USD MILLION)
             10.3.8 RECESSION IMPACT: EUROPE
     10.4 ASIA PACIFIC 
             TABLE 175 ASIA PACIFIC: INSPECTION MACHINES MARKET SEGMENTATION, BY COUNTRY, 2020–2027 (USD MILLION)
             TABLE 176 ASIA PACIFIC: INSPECTION MACHINES MARKET, BY PRODUCT, 2020–2027 (USD MILLION)
             TABLE 177 ASIA PACIFIC: INSPECTION MACHINES MARKET, BY TYPE, 2020–2027 (USD MILLION)
             TABLE 178 ASIA PACIFIC: INSPECTION MACHINES MARKET, BY PACKAGING TYPE, 2020–2027 (USD MILLION)
             TABLE 179 ASIA PACIFIC: INSPECTION MACHINES MARKET, BY END USER, 2020–2027 (USD MILLION)
             10.4.1 CHINA
                        10.4.1.1 China to register high growth
                                      TABLE 180 CHINA: INSPECTION MACHINES MARKET, BY PRODUCT, 2020–2027 (USD MILLION)
                                      TABLE 181 CHINA: INSPECTION MACHINES MARKET, BY TYPE, 2020–2027 (USD MILLION)
                                      TABLE 182 CHINA: INSPECTION MACHINES MARKET, BY PACKAGING TYPE, 2020–2027 (USD MILLION)
                                      TABLE 183 CHINA: INSPECTION MACHINES MARKET, BY END USER, 2020–2027 (USD MILLION)
             10.4.2 JAPAN
                        10.4.2.1 Early adoption of technologically advanced products to attract market players to Japan
                                      TABLE 184 JAPAN: INSPECTION MACHINES MARKET, BY PRODUCT, 2020–2027 (USD MILLION)
                                      TABLE 185 JAPAN: INSPECTION MACHINES MARKET SEGMENTATION, BY TYPE, 2020–2027 (USD MILLION)
                                      TABLE 186 JAPAN: INSPECTION MACHINES MARKET, BY PACKAGING TYPE, 2020–2027 (USD MILLION)
                                      TABLE 187 JAPAN: INSPECTION MACHINES MARKET, BY END USER, 2020–2027 (USD MILLION)
             10.4.3 INDIA
                        10.4.3.1 Growing contract manufacturing base to contribute to machine adoption
                                      TABLE 188 INDIA: INSPECTION MACHINES MARKET, BY PRODUCT, 2020–2027 (USD MILLION)
                                      TABLE 189 INDIA: INSPECTION MACHINES MARKET, BY TYPE, 2020–2027 (USD MILLION)
                                      TABLE 190 INDIA: INSPECTION MACHINES MARKET, BY PACKAGING TYPE, 2020–2027 (USD MILLION)
                                      TABLE 191 INDIA: INSPECTION MACHINES MARKET SEGMENTATION, BY END USER, 2020–2027 (USD MILLION)
             10.4.4 SOUTH KOREA
                        10.4.4.1 Highly attractive medical tourism industry to propel market growth
                                      TABLE 192 SOUTH KOREA: INSPECTION MACHINES MARKET, BY PRODUCT, 2020–2027 (USD MILLION)
                                      TABLE 193 SOUTH KOREA: INSPECTION MACHINES MARKET, BY TYPE, 2020–2027 (USD MILLION)
                                      TABLE 194 SOUTH KOREA: INSPECTION MACHINES MARKET, BY PACKAGING TYPE, 2020–2027 (USD MILLION)
                                      TABLE 195 SOUTH KOREA: INSPECTION MACHINES MARKET, BY END USER, 2020–2027 (USD MILLION)
             10.4.5 REST OF ASIA PACIFIC
                        TABLE 196 ROAPAC: INSPECTION MACHINES MARKET SEGMENTATION, BY PRODUCT, 2020–2027(USD MILLION)
                        TABLE 197 ROAPAC: INSPECTION MACHINES MARKET, BY TYPE, 2020–2027 (USD MILLION)
                        TABLE 198 ROAPAC: INSPECTION MACHINES MARKET, BY PACKAGING TYPE, 2020–2027 (USD MILLION)
                        TABLE 199 ROAPAC: INSPECTION MACHINES MARKET, BY END USER, 2020–2027 (USD MILLION)
             10.4.6 RECESSION IMPACT: ASIA PACIFIC
     10.5 LATIN AMERICA 
             TABLE 200 LATIN AMERICA: INSPECTION MACHINES MARKET PREDICTION, BY COUNTRY, 2020–2027 (USD MILLION)
             TABLE 201 LATIN AMERICA: INSPECTION MACHINES MARKET, BY PRODUCT, 2020–2027 (USD MILLION)
             TABLE 202 LATIN AMERICA: INSPECTION MACHINES MARKET, BY TYPE, 2020–2027 (USD MILLION)
             TABLE 203 LATIN AMERICA: INSPECTION MACHINES MARKET, BY PACKAGING TYPE, 2020–2027 (USD MILLION)
             TABLE 204 LATIN AMERICA: INSPECTION MACHINES MARKET, BY END USER, 2020–2027 (USD MILLION)
             10.5.1 BRAZIL
                        10.5.1.1 Brazil to dominate LATAM market
                                      TABLE 205 BRAZIL: INSPECTION MACHINES MARKET, BY PRODUCT, 2020–2027 (USD MILLION)
                                      TABLE 206 BRAZIL: INSPECTION MACHINES MARKET, BY TYPE, 2020–2027 (USD MILLION)
                                      TABLE 207 BRAZIL: INSPECTION MACHINES MARKET, BY PACKAGING TYPE, 2020–2027 (USD MILLION)
                                      TABLE 208 BRAZIL: INSPECTION MACHINES MARKET, BY END USER, 2020–2027 (USD MILLION)
             10.5.2 MEXICO
                        10.5.2.1 Improving healthcare infrastructure to drive market
                                      TABLE 209 MEXICO: INSPECTION MACHINES MARKET, BY PRODUCT, 2020–2027 (USD MILLION)
                                      TABLE 210 MEXICO: INSPECTION MACHINES MARKET PREDICTION, BY TYPE, 2020–2027 (USD MILLION)
                                      TABLE 211 MEXICO: INSPECTION MACHINES MARKET, BY PACKAGING TYPE, 2020–2027 (USD MILLION)
                                      TABLE 212 MEXICO: INSPECTION MACHINES MARKET, BY END USER, 2020–2027 (USD MILLION)
             10.5.3 REST OF LATIN AMERICA
                        TABLE 213 ROLA: INSPECTION MACHINES MARKET, BY PRODUCT, 2020–2027 (USD MILLION)
                        TABLE 214 ROLA: INSPECTION MACHINES MARKET, BY TYPE, 2020–2027 (USD MILLION)
                        TABLE 215 ROLA: INSPECTION MACHINES MARKET, BY PACKAGING TYPE, 2020–2027 (USD MILLION)
                        TABLE 216 ROLA: INSPECTION MACHINES MARKET, BY END USER, 2020–2027 (USD MILLION)
             10.5.4 RECESSION IMPACT: LATIN AMERICA
     10.6 MIDDLE EAST & AFRICA 
             10.6.1 GOVERNMENT SUPPORT TO PUSH ADOPTION OF TECHNOLOGICALLY ADVANCED PRODUCTS AND FAVOR MARKET GROWTH
                        TABLE 217 MIDDLE EAST & AFRICA: INSPECTION MACHINES MARKET, BY PRODUCT, 2020–2027 (USD MILLION)
                        TABLE 218 MIDDLE EAST & AFRICA: INSPECTION MACHINES MARKET, BY TYPE, 2020–2027 (USD MILLION)
                        TABLE 219 MIDDLE EAST & AFRICA: INSPECTION MACHINES MARKET PREDICTION, BY PACKAGING TYPE, 2020–2027 (USD MILLION)
                        TABLE 220 MIDDLE EAST & AFRICA: INSPECTION MACHINES MARKET, BY END USER, 2020–2027 (USD MILLION)
             10.6.2 RECESSION IMPACT: MIDDLE EAST AND AFRICA
 
11 COMPETITIVE LANDSCAPE (Page No. - 201)
     11.1 OVERVIEW 
     11.2 RIGHT-TO-WIN APPROACHES ADOPTED BY KEY PLAYERS 
             TABLE 221 INSPECTION MACHINES MARKET: STRATEGIES ADOPTED BY KEY PLAYERS
     11.3 REVENUE SHARE ANALYSIS 
             FIGURE 34 REVENUE SHARE ANALYSIS OF TOP PLAYERS, 2019–2021
     11.4 MARKET SHARE ANALYSIS 
             FIGURE 35 INSPECTION MACHINES MARKET SHARE, BY KEY PLAYER, 2021
             TABLE 222 INSPECTION MACHINES MARKET PREDICTION: DEGREE OF COMPETITION
     11.5 COMPANY EVALUATION QUADRANT (2021) 
             11.5.1 STARS
             11.5.2 EMERGING LEADERS
             11.5.3 PERVASIVE PLAYERS
             11.5.4 PARTICIPANTS
                        FIGURE 36 INSPECTION MACHINES MARKET: COMPANY EVALUATION QUADRANT, 2021
     11.6 COMPANY EVALUATION QUADRANT FOR STARTUPS/SMES (2021) 
             11.6.1 PROGRESSIVE COMPANIES
             11.6.2 STARTING BLOCKS
             11.6.3 RESPONSIVE COMPANIES
             11.6.4 DYNAMIC COMPANIES
                        FIGURE 37 INSPECTION MACHINES MARKET: COMPANY EVALUATION QUADRANT FOR STARTUPS/SMES, 2021
     11.7 COMPETITIVE BENCHMARKING 
             TABLE 223 INSPECTION MACHINES MARKET PREDICTION: DETAILED LIST OF KEY STARTUPS/SMES
             11.7.1 PRODUCT FOOTPRINT OF COMPANIES
                        TABLE 224 COMPANY PRODUCT FOOTPRINT
                        TABLE 225 REGIONAL FOOTPRINT OF COMPANIES
     11.8 COMPETITIVE SCENARIO 
             TABLE 226 PRODUCT LAUNCHES
             TABLE 227 DEALS
             TABLE 228 OTHER DEVELOPMENTS
 
12 COMPANY PROFILES (Page No. - 214)
     12.1 MAJOR PLAYERS 
(Business Overview, Products/Solutions/Services Offered, Recent Developments, and MnM View)*
             12.1.1 ROBERT BOSCH GMBH
                        TABLE 229 ROBERT BOSCH GMBH: BUSINESS OVERVIEW
                        FIGURE 38 ROBERT BOSCH GMBH: COMPANY SNAPSHOT (2021)
             12.1.2 KÖRBER AG
                        TABLE 230 KÖRBER AG: BUSINESS OVERVIEW
                        FIGURE 39 KÖRBER AG: COMPANY SNAPSHOT (2021)
             12.1.3 TELEDYNE TECHNOLOGIES INCORPORATED
                        TABLE 231 TELEDYNE TECHNOLOGIES INCORPORATED: BUSINESS OVERVIEW
                        FIGURE 40 TELEDYNE TECHNOLOGIES INCORPORATED: COMPANY SNAPSHOT (2021)
             12.1.4 THERMO FISHER SCIENTIFIC, INC.
                        TABLE 232 THERMO FISHER SCIENTIFIC, INC.: BUSINESS OVERVIEW
                        FIGURE 41 THERMO FISHER SCIENTIFIC: COMPANY SNAPSHOT (2021)
             12.1.5 METTLER TOLEDO
                        TABLE 233 METTLER TOLEDO: BUSINESS OVERVIEW
                        FIGURE 42 METTLER TOLEDO: COMPANY SNAPSHOT (2021)
             12.1.6 COGNEX CORPORATION
                        TABLE 234 COGNEX CORPORATION: BUSINESS OVERVIEW
                        FIGURE 43 COGNEX CORPORATION: COMPANY SNAPSHOT (2021)
             12.1.7 JEKSON VISION PRIVATE LIMITED
                        TABLE 235 JEKSON VISION PRIVATE LIMITED: BUSINESS OVERVIEW
             12.1.8 OPTEL GROUP
                        TABLE 236 OPTEL GROUP: BUSINESS OVERVIEW
             12.1.9 ACG GROUP
                        TABLE 237 ACG GROUP: BUSINESS OVERVIEW
             12.1.10 ANTARES VISION S.P.A.
                        TABLE 238 ANTARES VISION S.P.A.: BUSINESS OVERVIEW
                        FIGURE 44 ANTARES VISION S.P.A.: COMPANY SNAPSHOT (2021)
             12.1.11 BREVETTI CEA SPA
                        TABLE 239 BREVETTI CEA SPA: BUSINESS OVERVIEW
             12.1.12 OMRON CORPORATION
                        TABLE 240 OMRON CORPORATION: BUSINESS OVERVIEW
                        FIGURE 45 OMRON CORPORATION: COMPANY SNAPSHOT (2021)
             12.1.13 MITSUBISHI CHEMICAL HOLDINGS CORPORATION
                        TABLE 241 MITSUBISHI CHEMICAL HOLDINGS CORPORATION: BUSINESS OVERVIEW
                        FIGURE 46 MITSUBISHI CHEMICAL HOLDINGS CORPORATION: COMPANY SNAPSHOT (2021)
* Business Overview, Products/Solutions/Services Offered, Recent Developments, and MnM View might not be captured in case of unlisted companies.
     12.2 OTHER COMPANIES 
             12.2.1 IRIS INSPECTION MACHINES
                        TABLE 242 IRIS INSPECTION MACHINES: COMPANY OVERVIEW
             12.2.2 SHANGHAI TOFFLON SCIENCE AND TECHNOLOGY CO. LTD.
                        TABLE 243 SHANGHAI TOFFLON SCIENCE AND TECHNOLOGY CO. LTD.: COMPANY OVERVIEW
             12.2.3 PRODITEC
                        TABLE 244 PRODITEC: COMPANY OVERVIEW
             12.2.4 WIPOTEC OCS GMBH
                        TABLE 245 WIPOTEC OCS GMBH: COMPANY OVERVIEW
             12.2.5 CMP PHARMA SRL
                        TABLE 246 CMP PHARMA SRL: COMPANY OVERVIEW
             12.2.6 GENERAL INSPECTION
                        TABLE 247 GENERAL INSPECTION: COMPANY OVERVIEW
             12.2.7 SYSTECH GROUP LIMITED
                        TABLE 248 SYSTECH GROUP LIMITED: COMPANY OVERVIEW
             12.2.8 LAETUS GMBH
                        TABLE 249 LAETUS GMBH: COMPANY OVERVIEW
             12.2.9 LOMA SYSTEMS
                        TABLE 250 LOMA SYSTEMS: COMPANY OVERVIEW
             12.2.10 VITRONIC DR.-ING. STEIN
                        TABLE 251 VITRONIC DR.-ING. STEIN: COMPANY OVERVIEW
             12.2.11 SEA VISION S.R.L.
                        TABLE 252 SEA VISION S.R.L.: COMPANY OVERVIEW
             12.2.12 MINEBEA INTEC GMBH
                        TABLE 253 MINEBEA INTEC GMBH: COMPANY OVERVIEW
 
13 APPENDIX (Page No. - 265)
     13.1 DISCUSSION GUIDE 
     13.2 KNOWLEDGESTORE: MARKETSANDMARKETS’ SUBSCRIPTION PORTAL 
     13.3 CUSTOMIZATION OPTIONS 
     13.4 RELATED REPORTS 
     13.5 AUTHOR DETAILS 

This study involved the extensive use of both primary and secondary sources. The research process involved the study of various factors affecting the industry to identify the segmentation types, industry trends, key players, competitive landscape, key market dynamics, and key player strategies.

Secondary Research

This research study involved the use of comprehensive secondary sources; directories and databases such as D&B, Bloomberg Business, and Factiva; and white papers, annual reports, and company house documents. Secondary research was used to identify and collect information for this extensive, technical, market-oriented, and commercial study of the global inspection machines market. It was also used to obtain important information about the top players, market classification, and segmentation according to industry trends to the bottom-most level, geographic markets, technology perspectives, and key developments related to the market. A database of the key industry leaders was also prepared using secondary research.

Primary Research

In the primary research process, various sources from both the supply and demand sides were interviewed to obtain qualitative and quantitative information for this report. The supply side's primary sources include industry experts such as CEOs, vice presidents, marketing and sales directors, technology and innovation directors, and related key executives from various key companies and organizations operating in the inspection machines market. The primary sources from the demand side include industry experts such as software application specialists, product managers, food inspection specialists, medical device manufacturers, pharmaceutical firm R&D heads, packaging department heads, research scientists, and other related key opinion leaders.

A breakdown of the primary respondents is provided below:

Inspection Machines Market Size, and Share

*Others include sales managers, marketing managers, and product managers.

Note: Tiers are defined based on a company’s total revenue, as of 2021: Tier 1 = >USD 1 billion, Tier 2 = USD 500 million to USD 1 billion, and Tier 3 = <USD 500 million.

To know about the assumptions considered for the study, download the pdf brochure

Market Size Estimation

The market size estimates and forecasts provided in this study are derived through a mix of the bottom-up approach (segmental analysis of major segments) and top-down approach (assessment of utilization/adoption/penetration trends, by product, type, packaging type, end user, and region).

Data Triangulation

After arriving at the market size, the total inspection machines market was divided into several segments and subsegments. To complete the overall market engineering process and arrive at the exact statistics for all segments & subsegments, data triangulation, and market breakdown procedures were employed, wherever applicable.

Objectives of the Study

  • To define, describe, segment, and forecast the inspection machines market by product, type, packaging type, end user, and region
  • To provide detailed information about the factors influencing the market growth (such as drivers, restraints, opportunities, and challenges)
  • To analyze micromarkets with respect to individual growth trends, prospects, and contributions to the overall inspection machines market
  • To analyze market opportunities for stakeholders and provide details of the competitive landscape for key players
  • To forecast the size of the inspection machines market in five main regions along with their respective key countries, namely, North America, Europe, the Asia Pacific, Latin America, and the Middle East & Africa
  • To profile key players in the inspection machines market and comprehensively analyze their core competencies and market shares
  • To track and analyze competitive developments, such as acquisitions; new product launches; expansions; collaborations, agreements, & partnerships; and R&D activities of the leading players in the inspection machines market
  • To benchmark players within the inspection machines market using the "Competitive Leadership Mapping" framework, which analyzes market players on various parameters within the broad categories of business and product strategy

Available Customizations

With the given market data, MarketsandMarkets offers customizations as per your company’s specific needs. The following customization options are available for the report:

Company Information

  • Detailed analysis and profiling of additional market players (up to 5)

Geographic Analysis

  • Further breakdown of the Asia Pacific inspection machines market into Australia, New Zealand, and others
  • Further breakdown of European inspection machines market into the Netherlands, Denmark, and others

Top 10 growth use-cases for machine vision systems

Quality inspection: Machine vision systems are widely used in industries such as automotive, electronics, and pharmaceuticals for inspecting the quality of products, detecting defects, and ensuring compliance with industry standards.

Packaging and labeling: Machine vision systems are used to ensure that products are properly packaged and labeled, with correct information and barcodes.

Robotics and automation: Machine vision systems are used to guide robots and other automated machinery, enabling them to perform tasks with precision and accuracy.

Surface inspection: Machine vision systems are used to inspect surfaces of products, such as metals, plastics, and glass, for defects, scratches, and other imperfections.

Object recognition: Machine vision systems are used to recognize objects, such as parts, components, and tools, and identify their position, orientation, and other characteristics.

Security and surveillance: Machine vision systems are used in security and surveillance applications, such as facial recognition, license plate recognition, and crowd monitoring.

Agriculture and food processing: Machine vision systems are used in agriculture and food processing for sorting, grading, and inspecting products such as fruits, vegetables, and meats.

Medical and pharmaceuticals: Machine vision systems are used in medical and pharmaceutical industries for detecting defects in medical devices, monitoring drug quality, and inspecting packaging.

Transportation: Machine vision systems are used in transportation industries for inspecting components of vehicles, monitoring traffic, and guiding autonomous vehicles.

Entertainment: Machine vision systems are used in entertainment industries for creating special effects, motion capture, and virtual reality experiences.

Industry impact of machine vision system market

Machine vision systems have a wide range of applications across various industries, and several industries are expected to be impacted heavily by the growth of the machine vision system market in the future. Here are a few industries that are expected to be particularly affected

Manufacturing: The manufacturing industry is one of the largest users of machine vision systems, and this trend is expected to continue in the future. Machine vision systems are used in manufacturing for quality control, defect detection, and process optimization. For example, in the automotive industry, machine vision systems are used to inspect parts for defects, while in the electronics industry, they are used to inspect circuit boards for faults.

Healthcare: The healthcare industry is another industry that is expected to be heavily impacted by the growth of the machine vision system market in the future. Machine vision systems are already being used in healthcare for medical imaging, diagnosis, and surgery. In the future, machine vision systems could be used for applications such as disease diagnosis and drug discovery.

Agriculture: The agriculture industry is also expected to be impacted by the growth of the machine vision system market in the future. Machine vision systems could be used in agriculture for applications such as crop monitoring, yield optimization, and pest detection. For example, machine vision systems could be used to monitor the growth of plants and detect early signs of disease or nutrient deficiencies.

Retail: The retail industry is another industry that is expected to be heavily impacted by the growth of the machine vision system market in the future. Machine vision systems could be used in retail for applications such as inventory management, theft prevention, and customer tracking. For example, machine vision systems could be used to track the movements of customers in a store and analyze their behavior to optimize store layout and product placement.

Transportation: The transportation industry is also expected to be impacted by the growth of the machine vision system market in the future. Machine vision systems could be used in transportation for applications such as autonomous vehicles, traffic monitoring, and safety inspections. For example, machine vision systems could be used to monitor traffic and detect accidents or congestion in real-time.

These are just a few examples of industries that are expected to be heavily impacted by the growth of the machine vision system market in the future. As the technology continues to advance and become more affordable, machine vision systems are likely to find new and innovative applications across a wide range of industries.

Top 10 companies in machine vision system market

  • Basler AG
  • Cognex Corporation
  • FLIR Systems, Inc.
  • Keyence Corporation
  • National Instruments Corporation
  • Omron Corporation
  • Sick AG
  • Sony Corporation
  • Teledyne Technologies Incorporated
  • Texas Instruments Incorporated

These companies offer a range of machine vision solutions, including hardware, software, and systems integration services. Many of these companies have a strong presence in key markets such as manufacturing, healthcare, and retail. They also invest heavily in research and development to stay at the forefront of the rapidly evolving machine vision system market.

Niche growth drivers for machine vision system business

Robotics: Machine vision systems can be used to provide vision guidance for robots in manufacturing and other industries. By using machine vision systems to guide robots, companies can improve efficiency and reduce the risk of errors. This application is particularly relevant in industries such as automotive, electronics, and consumer goods.

Autonomous vehicles: Machine vision systems are a critical component of autonomous vehicles. They are used for object detection, lane departure warnings, and other functions. As the demand for autonomous vehicles increases, the demand for machine vision systems in this application is also expected to grow.

Quality control: Machine vision systems are widely used for quality control in manufacturing. By using machine vision systems to inspect products, companies can detect defects and improve product quality. This application is particularly relevant in industries such as pharmaceuticals, food and beverage, and consumer goods.

Augmented reality: Machine vision systems can be used to enhance augmented reality applications. By using machine vision systems to track the position of a user's head or hands, companies can create more immersive and interactive augmented reality experiences. This application is particularly relevant in industries such as gaming, retail, and education.

Medical imaging: Machine vision systems are widely used in medical imaging applications, such as MRI and CT scans. By using machine vision systems to analyze medical images, doctors can detect and diagnose diseases more accurately and efficiently. This application is particularly relevant in the healthcare industry.

Custom Market Research Services

We will customize the research for you, in case the report listed above does not meet with your exact requirements. Our custom research will comprehensively cover the business information you require to help you arrive at strategic and profitable business decisions.

Request Customization

Instant Answers with GPT - Ask Now!

Ask real questions. Get complete answers !
Report Code
PH 4491
Published ON
Jan, 2023
Choose License Type
BUY NOW
  • SHARE
X
Request Customization
Speak to Analyst
Speak to Analyst
OR FACE-TO-FACE MEETING
PERSONALIZE THIS RESEARCH
  • Triangulate with your Own Data
  • Get Data as per your Format and Definition
  • Gain a Deeper Dive on a Specific Application, Geography, Customer or Competitor
  • Any level of Personalization
REQUEST A FREE CUSTOMIZATION
LET US HELP YOU!
  • What are the Known and Unknown Adjacencies Impacting the Inspection Machines Market
  • What will your New Revenue Sources be?
  • Who will be your Top Customer; what will make them switch?
  • Defend your Market Share or Win Competitors
  • Get a Scorecard for Target Partners
CUSTOMIZED WORKSHOP REQUEST
+1-888-600-6441
  • Call Us
  • +1-888-600-6441 (Corporate office hours)
  • +1-888-600-6441 (US/Can toll free)
  • +44-800-368-9399 (UK office hours)
CONNECT WITH US
ABOUT TRUST ONLINE
©2024 MarketsandMarkets Research Private Ltd. All rights reserved
DMCA.com Protection Status Website Feedback