4
MARKET OVERVIEW
Provides a snapshot of current market scenario, value chain context, and factors impacting competitive intensity.
4.2.1.1
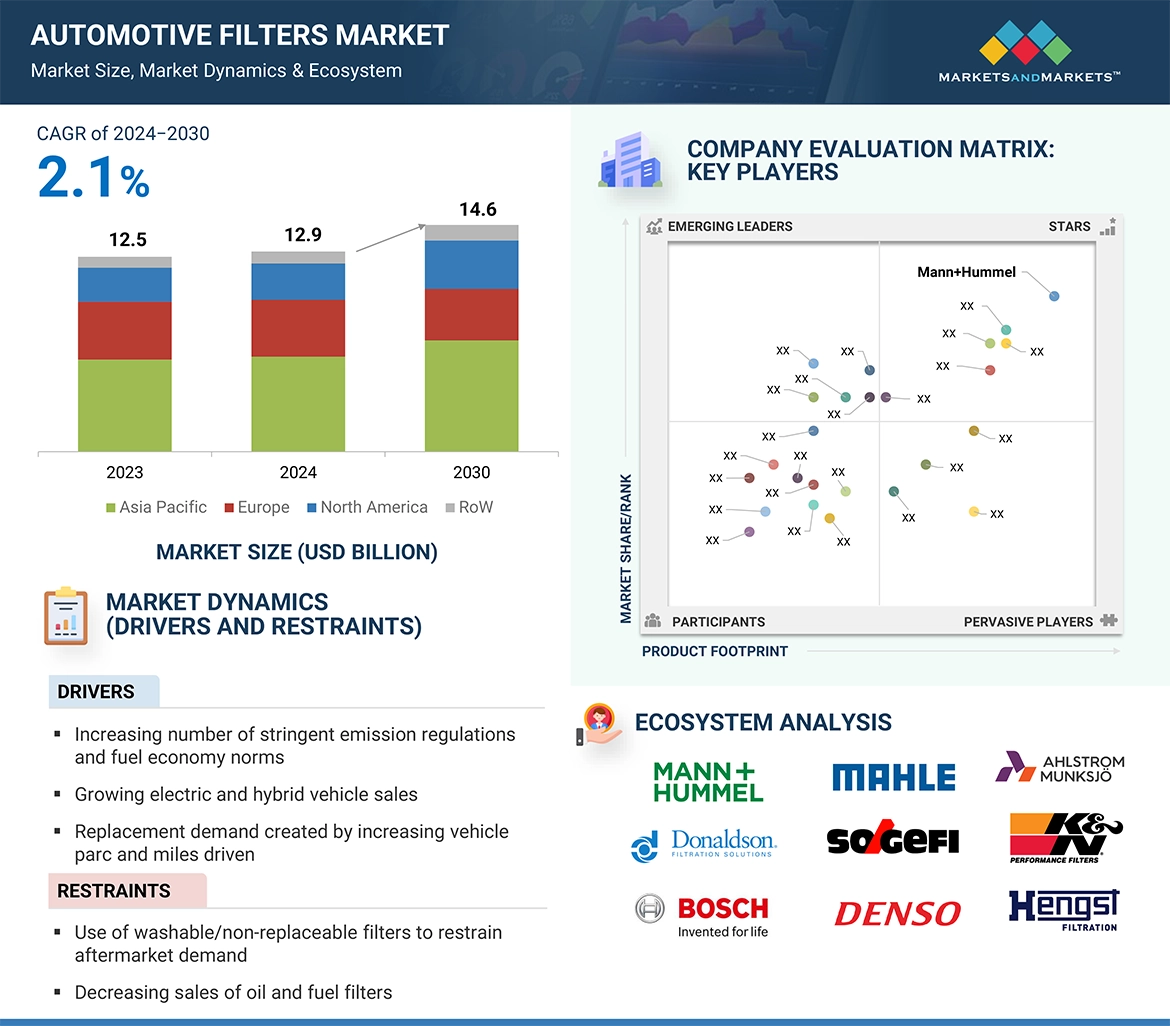
INCREASING NUMBER OF STRINGENT EMISSION REGULATIONS AND FUEL ECONOMY NORMS
4.2.1.2
GROWING ELECTRIC AND HYBRID VEHICLE SALES
4.2.1.3
REPLACEMENT DEMAND CREATED BY INCREASING VEHICLE PARC AND MILES DRIVEN
4.2.2.1
USE OF WASHABLE/NON-REPLACEABLE FILTERS TO RESTRAIN AFTERMARKET DEMAND
4.2.2.2
DECREASING SALES OF OIL AND FUEL FILTERS
4.2.3.1
ADVANCEMENTS IN FILTRATION MEDIA TECHNOLOGY
4.2.4.1
AVAILABILITY OF LOCAL PRODUCTS TO HINDER DEMAND FOR OE FILTERS
4.2.4.2
FLUCTUATING RAW MATERIAL COSTS
4.3
UNMET NEEDS AND WHITE SPACES
4.4
INTERCONNECTED MARKETS AND CROSS-SECTOR OPPORTUNITIES
4.5
STRATEGIC MOVES BY TIER-1/2/3 PLAYERS
5
INDUSTRY TRENDS
Outlines emerging trends, technology impact, and regulatory signals affecting growth trajectory and stakeholder decisions.
5.1
MACROECONOMIC OUTLOOK
5.1.2
GDP TRENDS AND FORECAST
5.1.3
TRENDS IN THE GLOBAL AUTOMOTIVE & TRANSPORTATION INDUSTRY
5.2
SUPPLY CHAIN ANALYSIS
5.4.1
AVERAGE SELLING PRICE TREND, BY FILTER TYPE (2022-2025)
5.4.2
AVERAGE SELLING PRICE TREND, BY REGION (2022-2025)
5.5.1
IMPORT SCENARIO (HS CODE 842123)
5.5.2
EXPORT SCENARIO (HS CODE 842123)
5.6
KEY CONFERENCES AND EVENTS, 2025–2026
5.7
TRENDS/DISRUPTIONS IMPACTING CUSTOMER BUSINESS
5.8
INVESTMENT AND FUNDING SCENARIO
5.9
FUNDING BY USE CASE APPLICATION
5.12
TOTAL COST OF OWNERSHIP
5.13
IMPACT OF 2025 US TARIFF – AUTOMOTIVE FILTERS MARKET
5.13.3
PRICE IMPACT ANALYSIS
5.13.4
IMPACT ON COUNTRIES/REGIONS
5.13.5
IMPACT ON THE AUTOMOTIVE INDUSTRY
6
TECHNOLOGICAL ADVANCEMENTS, AI-DRIVEN IMPACT, PATENTS, INNOVATIONS, AND FUTURE STRATEGIC APPLICATIONS
6.1.2
COMPLEMENTARY TECHNOLOGIES
6.1.3
ADJACENT TECHNOLOGIES
6.2
TECHNOLOGY/PRODUCT ROADMAP
6.5
IMPACT OF AI/GEN AI ON THE AUTOMOTIVE FILTERS MARKET
6.5.1
TOP USE CASES AND MARKET POTENTIAL
6.5.2
BEST PRACTICES IN ELECTRIC VEHICLE DEVELOPMENT
6.5.3
CASE STUDIES OF AI IMPLEMENTATION IN THE AUTOMOTIVE FILTERS MARKET
6.5.4
INTERCONNECTED ADJACENT ECOSYSTEM AND IMPACT ON MARKET PLAYERS
6.5.5
CLIENTS’ READINESS TO ADOPT GENERATIVE AI IN THE AUTOMOTIVE FILTERS MARKET
6.5
SUCCESS STORIES AND REAL-WORLD APPLICATIONS
7.1
REGIONAL REGULATIONS AND COMPLIANCE
7.1.1
REGULATORY BODIES, GOVERNMENT AGENCIES, AND OTHER ORGANIZATIONS
7.1.2
FILTRATION STANDARDS
7.1.3
EMISSION REGULATIONS
7.1.3.1
ON-ROAD VEHICLE EMISSION REGULATIONS
7.1.3.2
OFF-ROAD VEHICLE EMISSION REGULATIONS
8
CUSTOMER LANDSCAPE & BUYER BEHAVIOR
8.1
DECISION-MAKING PROCESS
8.2
BUYER STAKEHOLDERS AND BUYING EVALUATION CRITERIA
8.3
ADOPTION BARRIERS & INTERNAL CHALLENGES
8.4
UNMET NEEDS FROM VARIOUS END-USE INDUSTRIES
9
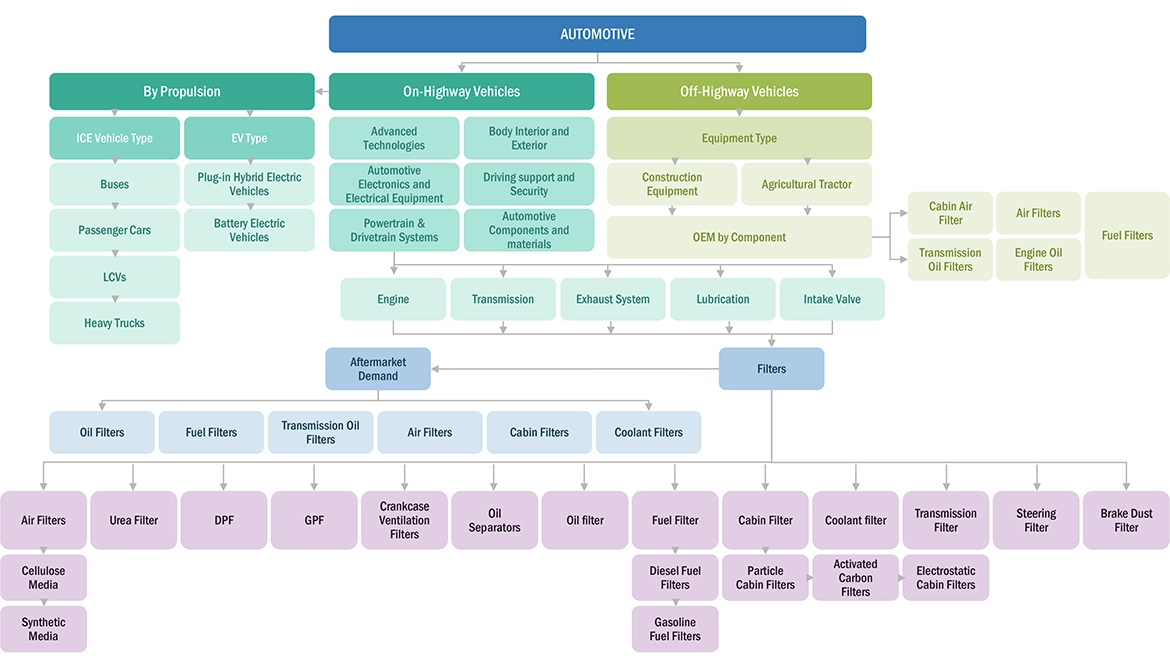
AUTOMOTIVE FILTERS MARKET, BY FILTER TYPE (MARKET SIZE & FORECAST TO 2032 – IN VALUE, USD THOUSAND & VOLUME)
COMPARATIVE ASSESSMENT OF KEY AUTOMOTIVE FILTER TYPES, THEIR MARKET POTENTIAL, AND DEMAND PATTERNS BY VARIOUS SUPPLIER COMPANIES
Market Size, Volume & Forecast – USD Million
9.2.1
INCREASING DEMAND FOR PASSENGER AND COMMERCIAL VEHICLES TO DRIVE THE MARKET
9.3.1
INCREASING STRINGENT EMISSION NORMS AND ADVANCEMENT IN FILTRATION MEDIA TO DRIVE THE MARKET
9.4.1
INCREASING THE ENGINE SIZE OF HEAVY TRUCKS AND SUVS TO DRIVE THE MARKET
9.5.1
RISING AWARENESS ABOUT IN-CABIN AIR QUALITY TO DRIVE THE MARKET
9.6.1
GROWING AWARENESS ABOUT POLLUTION CAUSED BY DISC BRAKES TO DRIVE THE MARKET
9.7.1
RISING ADOPTION OF AUTOMATIC, CONTINUOUS VARIABLE, AND DUAL-CLUTCH TRANSMISSION SYSTEMS TO DRIVE THE MARKET
9.8.1
RISING NUMBER OF HEAVY-DUTY VEHICLES WITH LARGER ENGINE CAPACITY TO DRIVE THE MARKET
9.9.1
INCREASING DEMAND FOR LUXURY AND PREMIUM CARS TO DRIVE THE MARKET
9.10.1
INCREASING DEMAND FOR SUVS AND HEAVY-DUTY VEHICLES WITH HYDRAULIC POWER STEERING TO DRIVE THE MARKET
9.11.1
STRINGENT EMISSION NORMS RELATED TO CO2 AND NOX TO DRIVE MARKET
9.12
DIESEL PARTICULATE FILTER (DPF)
9.12.1
INSTALLATION OF DPF IN ALL DIESEL VEHICLES ACROSS EUROPE AND NORTH AMERICA TO DRIVE THE MARKET
9.13
GASOLINE PARTICULATE FILTER (GPF)
9.13.1
ENGINE DOWNSIZING TREND TO DRIVE MARKET
9.14
CRANKCASE VENTILATION
9.14.1
RISING DEMAND FOR HEAVY-DUTY TRUCKS AND BUSES TO DRIVE THE MARKET
9.15
KEY PRIMARY INSIGHTS
10
AUTOMOTIVE AIR FILTERS MARKET, BY MEDIA TYPE (MARKET SIZE & FORECAST TO 2032 – IN VALUE, USD THOUSAND & VOLUME)
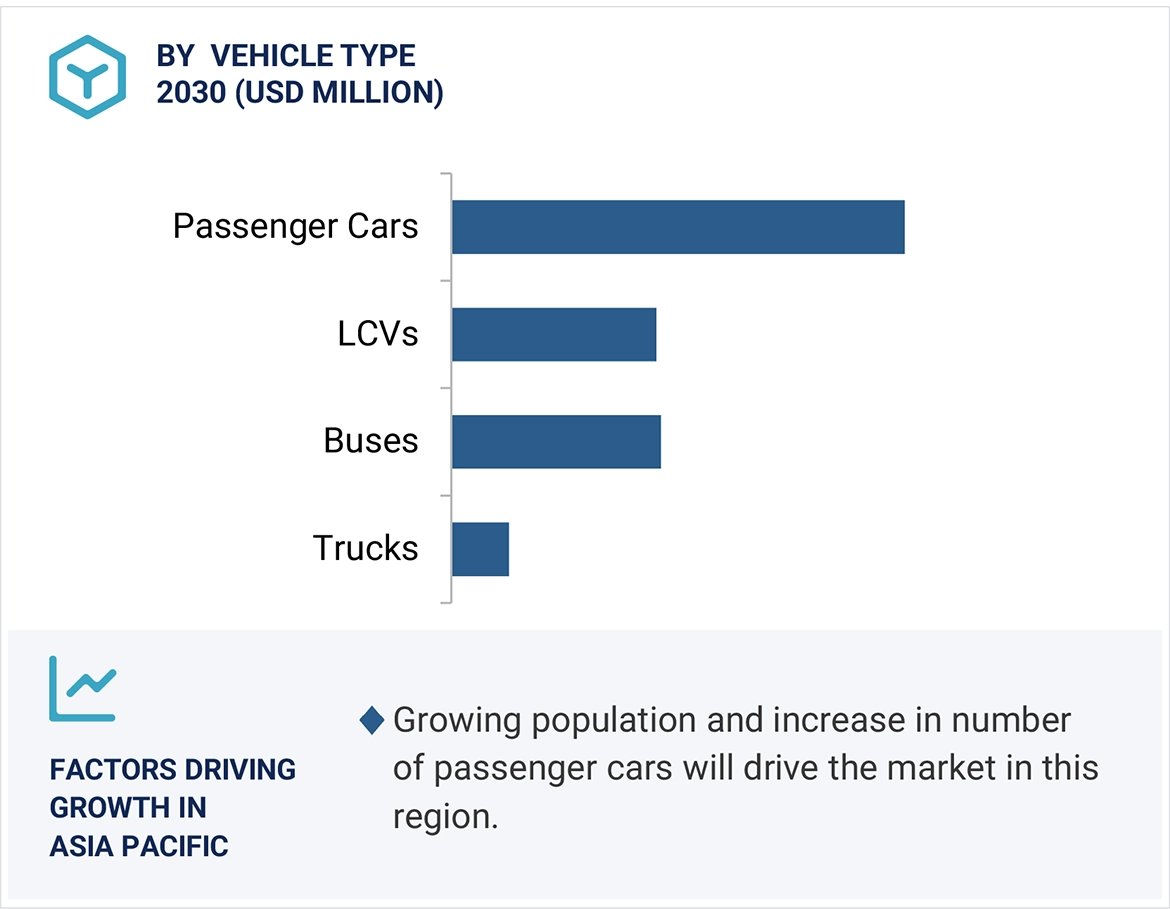
VEHICLE-WISE DEMAND POTENTIAL AND GROWTH PATHWAYS SHAPING AUTOMOTIVE FILTERS ADOPTION IN DIVERSE INDUSTRIES
10.2.1
COST-EFFECTIVENESS TO DRIVE MARKET
10.3.1
INCREASING DEMAND FOR PREMIUM VEHICLES TO DRIVE THE MARKET
10.4
KEY PRIMARY INSIGHTS
11
AUTOMOTIVE CABIN FILTERS MARKET, BY MATERIAL TYPE (MARKET SIZE & FORECAST TO 2032 – IN VALUE, USD THOUSAND & VOLUME)
SYSTEM-WISE DEMAND POTENTIAL AND GROWTH PATHWAYS SHAPING AUTOMOTIVE FILTERS ADOPTION IN DIVERSE INDUSTRIES
11.2
PARTICLE CABIN FILTERS
11.2.1
COST-EFFECTIVENESS AND BETTER PERFORMANCE TO DRIVE THE MARKET
11.3
ACTIVATED CARBON CABIN FILTERS
11.3.1
RISING DEMAND FOR MID-RANGE AND ECONOMY CARS IN EMERGING ECONOMIES TO DRIVE THE MARKET
11.4
ELECTROSTATIC CABIN FILTERS
11.4.1
GROWING SALES OF PREMIUM AND LUXURY VEHICLES TO DRIVE THE MARKET
11.5
KEY PRIMARY INSIGHTS
12
AUTOMOTIVE FUEL FILTERS MARKET, BY FUEL TYPE (MARKET SIZE & FORECAST TO 2032 – IN VALUE, USD THOUSAND & VOLUME)
SECTOR-SPECIFIC ADOPTION DRIVERS, DEMAND DYNAMICS, AND MARKET POTENTIAL ACROSS EACH ACTUATION
12.2.1
INCREASING SALES OF GASOLINE-FUELED VEHICLES COMPARED TO DIESEL-POWERED VEHICLES TO DRIVE THE MARKET
12.3.1
STRINGENT EMISSION NORMS ON DIESEL ENGINES TO REDUCE DEMAND
12.4
KEY PRIMARY INSIGHTS
13
OFF-HIGHWAY VEHICLE FILTERS MARKET, BY EQUIPMENT TYPE (MARKET SIZE & FORECAST TO 2032 – IN VALUE, USD THOUSAND & VOLUME)
SECTOR-SPECIFIC ADOPTION DRIVERS, DEMAND DYNAMICS, AND MARKET POTENTIAL ACROSS EACH COMPONENT
13.2
AGRICULTURAL TRACTOR
13.2.1
ADOPTION OF MECHANIZED FARMING TO DRIVE THE MARKET
13.3
CONSTRUCTION EQUIPMENT
13.3.1
INCREASED CONSTRUCTION ACTIVITIES AND INDUSTRIAL DEVELOPMENTS TO DRIVE THE MARKET
13.4
KEY PRIMARY INSIGHTS
14
AUTOMOTIVE FILTERS MARKET (ICE), BY VEHICLE TYPE (MARKET SIZE & FORECAST TO 2032 – IN VALUE, USD THOUSAND & VOLUME)
SECTOR-SPECIFIC ADOPTION DRIVERS, DEMAND DYNAMICS, AND MARKET POTENTIAL ACROSS EACH COMPONENT
14.2.1
NEED FOR FUEL EFFICIENCY TO DRIVE THE MARKET
14.3
LIGHT COMMERCIAL VEHICLE (LCV)
14.3.1
HIGH DEMAND IN NORTH AMERICA TO DRIVE THE MARKET
14.4.1
GROWTH OF LARGE-SCALE INDUSTRIES TO DRIVE THE MARKET
14.5.1
HIGH DEPENDENCY ON PUBLIC TRANSPORT TO DRIVE THE MARKET
14.6
KEY PRIMARY INSIGHTS
15
ELECTRIC & HYBRID VEHICLE FILTERS MARKET (OE),
BY VEHICLE TYPE (MARKET SIZE & FORECAST TO 2032 – IN VALUE, USD THOUSAND & VOLUME)
SECTOR-SPECIFIC ADOPTION DRIVERS, DEMAND DYNAMICS, AND MARKET POTENTIAL ACROSS EACH COMPONENT
15.2
BATTERY ELECTRIC VEHICLE (BEV)
15.2.1
GOVERNMENT SUBSIDIES AND INVESTMENTS IN CHARGING INFRASTRUCTURE TO DRIVE THE MARKET
15.3
PLUG-IN HYBRID ELECTRIC VEHICLE (PHEV)
15.3.1
BENEFITS OF THE HIGHER RANGE TO DRIVE THE MARKET
15.4
KEY PRIMARY INSIGHTS
16
AUTOMOTIVE FILTERS AFTERMARKET (ICE), BY FILTER TYPE (MARKET SIZE & FORECAST TO 2032 – IN VALUE, USD THOUSAND & VOLUME)
COMPARATIVE ASSESSMENT OF KEY AUTOMOTIVE FILTER TYPES, THEIR MARKET POTENTIAL, AND DEMAND PATTERNS BY VARIOUS SUPPLIER COMPANIES
16.2.1
INCREASING PROPORTION OF PASSENGER AND COMMERCIAL VEHICLES IN EMERGING ECONOMIES TO DRIVE THE MARKET
16.3.1
INCREASING DEMAND FOR GASOLINE FUEL FILTERS TO DRIVE THE MARKET
16.4.1
RISING DEMAND FOR MID & FULL-SIZE VEHICLES TO DRIVE MARKET
16.5.1
RISING DEMAND FOR IN-CABIN COMFORT TO DRIVE THE MARKET
16.6.1
GROWING PREMIUM VEHICLE PARC TO DRIVE MARKET
16.7.1
INCREASING CITY TRAFFIC AND LONG-DISTANCE TRAVEL TO DRIVE THE MARKET
16.8
KEY PRIMARY INSIGHTS
17
ELECTRIC & HYBRID VEHICLE FILTERS MARKET (OE),
BY FILTER TYPE (MARKET SIZE & FORECAST TO 2032 – IN VALUE, USD THOUSAND & VOLUME)
COMPARATIVE ASSESSMENT OF KEY AUTOMOTIVE FILTER TYPES, THEIR MARKET POTENTIAL, AND DEMAND PATTERNS BY VARIOUS SUPPLIER COMPANIES
17.2.1
RISING SALES OF PHEVS TO DRIVE THE MARKET
17.3.1
GROWING SALES OF PHEVS AND STRINGENT EMISSION NORMS TO DRIVE THE MARKET
17.4.1
EXCLUSIVE BLEND OF NATURAL AND SYNTHETIC MATERIALS IN ENGINE OIL FILTERS TO DRIVE THE MARKET
17.5.1
RISING PREMIUM VEHICLE RANGE WITH ENHANCED IN-CABIN AMBIANCE TO DRIVE MARKET
17.6.1
EXPECTED INTRODUCTION OF BRAKE DUST FILTERS BY AUDI AND BMW TO DRIVE THE MARKET
17.7.1
INCREASING DEMAND FOR ELECTRIC & HYBRID VEHICLES IN AUTOMATIC, CVT, AND DCT TRANSMISSIONS TO DRIVE THE MARKET
17.8.1
GROWING DEMAND FOR EFFICIENT PERFORMANCE OF POWER ELECTRONICS IN VEHICLES TO DRIVE THE MARKET
17.9
COOLING AIR PARTICLE
17.9.1
GROWING DEMAND FOR EFFICIENT BATTERY PERFORMANCE TO DRIVE THE MARKET
17.10
KEY PRIMARY INSIGHTS
18
OFF-HIGHWAY VEHICLE FILTERS MARKET (OE), BY FILTER TYPE (MARKET SIZE & FORECAST TO 2032 – IN VALUE, USD THOUSAND & VOLUME)
COMPARATIVE ASSESSMENT OF KEY FILTER TYPES, THEIR MARKET POTENTIAL, AND DEMAND PATTERNS BY VARIOUS SUPPLIER COMPANIES
Market Size, Volume & Forecast – USD Million
18.2.1
R&D INVESTMENTS TO IMPROVE AIR FILTRATION TECHNOLOGY TO DRIVE THE MARKET
18.3.1
GROWING RESIDENTIAL, COMMERCIAL, HIGHWAY, AND DAM CONSTRUCTION ACTIVITIES TO DRIVE THE MARKET
18.4.1
INCREASING DEMAND FOR HEAVY EQUIPMENT DUE TO RISING INFRASTRUCTURAL DEVELOPMENTS IN EMERGING ECONOMIES
18.5.1
HIGH ADOPTION RATE OF SMALL-SIZED TRACTORS IN THE ASIA PACIFIC AND NORTH AMERICA TO DRIVE THE MARKET
18.6.1
GROWING TRACTION OF POWER-SHIFT AND AUTOMATIC TRANSMISSION TECHNOLOGY TO DRIVE THE MARKET
18.7
KEY PRIMARY INSIGHTS
19
AUTOMOTIVE FILTERS MARKET, BY REGION (MARKET SIZE & FORECAST TO 2032 – IN VALUE, USD THOUSAND & VOLUME)
ASSESSING GROWTH PATTERNS, INDUSTRY FORCES, REGULATORY LANDSCAPE, AND MARKET POTENTIAL ACROSS KEY GEOGRAPHIES AND COUNTRIES
19.2.1.1
RISING PASSENGER VEHICLE DEMAND TO DRIVE THE MARKET
19.2.2.1
GROWING USE OF TECHNOLOGICALLY ADVANCED FILTRATION SOLUTIONS TO DRIVE THE MARKET
19.2.3.1
INCREASING DEMAND FOR LUXURY CARS TO DRIVE THE MARKET
19.2.4.1
GROWTH IN VEHICLE SALES TO DRIVE THE MARKET
19.2.5.1
GROWING DEMAND FOR AUTOMOTIVE COMPONENTS TO DRIVE THE MARKET
19.2.6
REST OF ASIA PACIFIC
19.2.6.1
DEVELOPING COUNTRIES WITH RISING DISPOSABLE INCOME
19.3.1.1
HIGH DEMAND FOR PREMIUM CARS TO DRIVE THE MARKET
19.3.2.1
INCREASE IN PRODUCTION OF HIGH-END VEHICLES TO DRIVE THE MARKET
19.3.3.1
PRESENCE OF A WELL-ESTABLISHED LUXURY CAR MARKET TO DRIVE THE MARKET
19.3.4.1
INCREASING PRODUCTION OF PASSENGER CARS TO DRIVE THE MARKET
19.3.5.1
RISING SALES OF PREMIUM VEHICLES TO DRIVE THE MARKET
19.3.6.1
RISING FOCUS ON EXPORTS TO DRIVE MARKET
19.3.7.1
INCREASING SALES OF PASSENGER CARS TO DRIVE THE MARKET
19.3.8.1
ROBUST GROWTH IN PRODUCTION CAPACITIES
19.4.1.1
INCREASING PRODUCTION OF SUVS TO DRIVE THE MARKET
19.4.2.1
RISING GOVERNMENT REGULATIONS TO DRIVE THE MARKET
19.4.3.1
GROWING DEMAND FOR ADVANCED FILTRATION TECHNOLOGY TO DRIVE THE MARKET
19.5.1.1
HEAVY INVESTMENTS IN THE AUTOMOTIVE SECTOR TO DRIVE THE MARKET
19.5.2.1
PRESENCE OF MAJOR AUTOMOTIVE COMPANIES TO DRIVE THE MARKET
19.5.3.1
GROWING DEMAND FOR ADVANCED FILTRATION TECHNOLOGY TO DRIVE THE MARKET
STRATEGIC ASSESSMENT OF LEADING PLAYERS, MARKET RANKING/SHARE, REVENUE ANALYSIS, COMPANY POSITIONING, AND COMPETITIVE BENCHMARKS INFLUENCING MARKET POTENTIAL
20.2
KEY PLAYER COMPETITIVE STRATEGIES/ RIGHT TO WIN
20.3
REVENUE ANALYSIS (2022-2024)
20.4
MARKET SHARE ANALYSIS,
20.6
COMPANY EVALUATION MATRIX: KEY PLAYERS,
20.6.5
COMPANY FOOTPRINT: KEY PLAYERS,
20.6.5.1
COMPANY FOOTPRINT
20.6.5.2
REGION FOOTPRINT
20.7
COMPANY EVALUATION MATRIX (ELECTRIC & HYBRID VEHICLE FILTER MANUFACTURERS): KEY PLAYERS,
20.7.5
COMPANY FOOTPRINT: KEY PLAYERS,
20.8
COMPANY VALUATION AND FINANCIAL METRICS
20.10
COMPETITIVE SCENARIO
IN-DEPTH REVIEW OF COMPANIES, PRODUCTS, RECENT INITIATIVES, AND POSITIONING STRATEGIES IN THE AUTOMOTIVE FILTERS MARKET LANDSCAPE
21.1.1.1
BUSINESS OVERVIEW
21.1.1.2
PRODUCTS/SOLUTIONS/SERVICES OFFERED
21.1.1.3.1
KEY STRENGTHS/RIGHT TO WIN
21.1.1.3.2
STRATEGIC CHOICES
21.1.1.3.3
WEAKNESSES/COMPETITIVE THREATS
21.1.2
DONALDSON COMPANY, INC.
21.1.2.1
BUSINESS OVERVIEW
21.1.2.2
PRODUCTS/SOLUTIONS/SERVICES OFFERED
21.1.2.3
RECENT DEVELOPMENTS
21.1.2.4
PRODUCT LAUNCHES
21.1.2.5.1
KEY STRENGTHS/RIGHT TO WIN
21.1.2.5.2
STRATEGIC CHOICES
21.1.2.5.3
WEAKNESSES/COMPETITIVE THREATS
21.1.3.1
BUSINESS OVERVIEW
21.1.3.2
PRODUCTS/SOLUTIONS/SERVICES OFFERED
21.1.3.3
RECENT DEVELOPMENTS
21.1.3.3.1
PRODUCT LAUNCHES
21.1.3.4.1
KEY STRENGTHS/RIGHT TO WIN
21.1.3.4.2
STRATEGIC CHOICES
21.1.3.4.3
WEAKNESSES/COMPETITIVE THREATS
21.1.4.1
BUSINESS OVERVIEW
21.1.4.2
PRODUCTS/SOLUTIONS/SERVICES OFFERED
21.1.4.3
RECENT DEVELOPMENTS
21.1.4.3.1
PRODUCT LAUNCHES
21.1.4.4.1
KEY STRENGTHS/RIGHT TO WIN
21.1.4.4.2
STRATEGIC CHOICES
21.1.4.4.3
WEAKNESSES/COMPETITIVE THREATS
21.1.5.1
BUSINESS OVERVIEW
21.1.5.2
PRODUCTS/SOLUTIONS/SERVICES OFFERED
21.1.5.3
RECENT DEVELOPMENTS
21.1.5.3.1
PRODUCT LAUNCHES
21.1.5.4.1
KEY STRENGTHS/RIGHT TO WIN
21.1.5.4.2
STRATEGIC CHOICES
21.1.5.4.3
WEAKNESSES/COMPETITIVE THREATS
21.1.6.1
BUSINESS OVERVIEW
21.1.6.2
PRODUCTS/SOLUTIONS/SERVICES OFFERED
21.1.6.3
RECENT DEVELOPMENTS
21.1.6.3.1
PRODUCT LAUNCHES
21.1.7.1
BUSINESS OVERVIEW
21.1.7.2
PRODUCTS/SOLUTIONS/SERVICES OFFERED
21.1.7.3
RECENT DEVELOPMENTS
21.1.7.3.1
PRODUCT LAUNCHES
21.1.8
TOYOTA BOSHOKU CORPORATION
21.1.8.1
BUSINESS OVERVIEW
21.1.8.2
PRODUCTS/SOLUTIONS/SERVICES OFFERED
21.1.8.3
RECENT DEVELOPMENTS
21.1.8.3.1
PRODUCT LAUNCHES
21.1.9.1
BUSINESS OVERVIEW
21.1.9.2
PRODUCTS/SOLUTIONS/SERVICES OFFERED
21.1.9.3
RECENT DEVELOPMENTS
21.1.9.3.1
PRODUCT LAUNCHES
21.1.10.1
BUSINESS OVERVIEW
21.1.10.2
PRODUCTS/SOLUTIONS/SERVICES OFFERED
21.1.10.3
RECENT DEVELOPMENTS
21.1.10.3.1
PRODUCT LAUNCHES
21.1.11.1
BUSINESS OVERVIEW
21.1.11.2
PRODUCTS/SOLUTIONS/SERVICES OFFERED
21.1.11.3
RECENT DEVELOPMENTS
21.1.11.3.1
PRODUCT LAUNCHES
21.2.3
K&N ENGINEERING, INC.
21.2.5
DALE FILTER SYSTEMS
22.1.1.1
KEY DATA FROM SECONDARY SOURCES
22.1.2.1
KEY DATA FROM PRIMARY SOURCES
22.1.2.2
KEY PRIMARY PARTICIPANTS
22.1.2.3
BREAKDOWN OF PRIMARY INTERVIEWS
22.1.2.4
KEY INDUSTRY INSIGHTS
22.2
MARKET SIZE ESTIMATION
22.2.1
BOTTOM-UP APPROACH
22.2.3
BASE NUMBER CALCULATION
22.3
MARKET FORECAST APPROACH
22.6
RESEARCH ASSUMPTIONS
22.7
RESEARCH LIMITATIONS AND RISK ASSESSMENT
23.2
KNOWLEDGESTORE: MARKETSANDMARKETS’ SUBSCRIPTION PORTAL
23.3
CUSTOMIZATION OPTIONS


Amey
Nov, 2019
Up to date (2017) Off highway filter marketplace Globally and by region for all types - Oil, Fuel, prefuel, hydraulic, transmission.
Amey
Nov, 2019
I would appreciate to have a sample of market research of the Brazilian Oil,Fuel,Air and HVAC market, production and market players split.
Amey
Nov, 2019
Air , Oil and Fuel filter Market at Canada , who is suppliers what size is it in aoutomotive including buses,trucks and business heavy equipments market .
Amey
Nov, 2019
Hello, I am interested in receiving reports for Aftermarket data for filters in the United States. Specifically, I would like to locate Vehicle in Operation information, or demands for Heavy Duty Filters. Any information provided would be much appreciated. Thank you.
Amey
Nov, 2019
What is the expected evolution of filter markets considering that the reliability of vehicles and quality of oils is continuously improving and enable to space out visits?.
Amey
Nov, 2019
yes Fuel Filters especially the Diesel Market size. I would like to see if you have info specifically units and dollars for the diesel fuel filter market in the u.s.
Amey
Nov, 2019
Interested to Know market potential for Fuel Filter Cum Water Separator for Ashok leyland Vehicles and current After market share held by various competetions in India.
Amey
Nov, 2019
we are conducting a final career project on filters for motorbikes. Your study migth help us. Regards.
Amey
Nov, 2019
I am seeking an air filter market report with a narrow focus. Specifically, the focus is medium and heavy vehicle in the North America markets (US and Canada data). May I please have a quote and a table of contents for a report with this focus? Thank you, Megan .
Amey
Nov, 2019
I'm specifically interested in automotive-filter manufacturers based in China and the markets/regions they supply to/support. .
Amey
Nov, 2019
I want to get a sense of how Mahle are doing in the UK and Europe within the Aftermarket compared to the leader. If I can get this, I will be able understand the full value of the report.
User
Jul, 2019
Hi, I am looking for specific information on Capacitive dividers for EVT, Testing, RC Dividers, Grading AIS, Grading GIS, TRV AIS, TRV GIS, Thyristor Valve, HVDC Bypass, Filter capacitor, EVT For the following countries and region - Europe. U.S., Canada, India, China, South America, and Middle East Can you please help me with a quote and timeline for the same?.
User
Jul, 2019
Diesel and Gasoline Particulate Filters, Catalysts for the automotive industry globally and all vehicle segments(i.e PC HCV). Thanks.
Swati
Jun, 2019
Hello, I am a consultant/investor in the North America Automotive Aftermarket space and would like a sample report to determine if it can add value for my filter manufacturer client. Regards, Frank.
Atul
May, 2019
We would be interested in purchasing the Report on automotive filters. Could you please provide us with some information prior to the purchase: Is there an extended table of content that you can share with us? Could you share with us the forecast model that is underlying the report? .
Atul
May, 2019
What is the source of the data used in the forecast? (Is it based on IHS data when it comes to volumes for instance?) .
Atul
May, 2019
Can you give us details regarding the methodology? We would need datapoints going back to 2013. Could you provide these? Many thanks in advance! .