[178 Pages Report] The brake friction market is projected to grow during the forecast period due to the increase in vehicle production. The brake friction (OE) market is projected to grow at a CAGR of 2.33% from 2018 to 2025, from USD 12.79 Billion in 2017 to USD 15.84 Billion by 2025. The brake friction aftermarket is projected to grow at a CAGR of 1.03% from 2018 to 2025, from an estimated USD 29.06 Billion in 2017 to USD 31.99 Billion by 2025.
The research methodology used in the report involves various secondary sources such as EAMA, OICA, CEMA, paid databases such as Marklines, Factiva, and other directories. Experts from related industries and suppliers have been interviewed to understand the future trends of the brake friction market. The bottom-up approach has been used to estimate the market size, by volume. The installation rate of disc and drum brake system has been derived by using model mapping of country level vehicles. The market size, by volume, is multiplied by the average OE price (AOP) of brake friction products units required for each application and architecture, to calculate the market size in terms of value. Summation of the country-wise markets gives the regional market, and further summation of the regional markets provides the global brake friction market. Dealers and distributors of brake friction and technology suppliers are consulted for information. To derive the aftermarket size, by volume, the total miles driven per vehicle per country and product life in miles are used to derive the number of friction products required per vehicle, which is then multiplied by the vehicle parc to derive the final market in terms of volume.
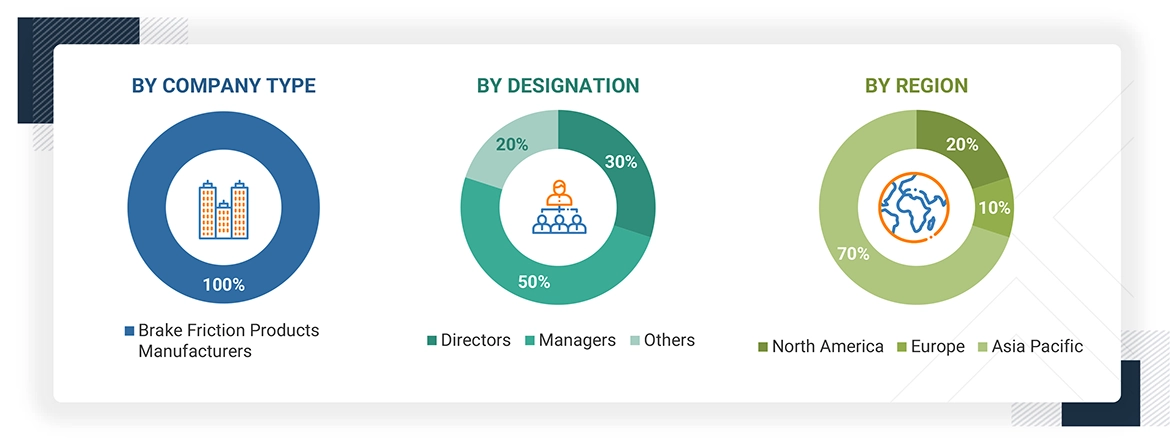
The figure below shows the break-up of the profile of industry experts who participated in the primary discussions.
To know about the assumptions considered for the study, download the pdf brochure
The ecosystem of the brake friction market consists of manufacturers and Tier 1 suppliers such as Robert Bosch (Germany), Aisin Seiki (Japan), Nisshinbo Holding (Japan), Federal Mogul (US), Brembo (Italy), Delphi (Now Aptiv) (UK), Tenneco (US), Akebono Brake Industries (Japan), Miba AG (Germany), and SGL Group (Germany).
The study answers several questions for the stakeholders, primarily which market segments to focus in the next two to five years (depends on a range of forecast period) for prioritizing their efforts and investments.
With the given market data, MarketsandMarkets can provide market data for below categories:
*Note: Country level Data Is available for India, China, Japan, South Korea, UK, Germany, France, US, Canada, Mexico, Russia and Brazil, following data*
The brake friction aftermarket is projected to grow at a CAGR of 1.03% during the forecast period, from USD 29.77 Billion in 2017 to USD 31.99 Billion by 2025. The increasing vehicle parc is the key factor driving the growth of the replacement market for brake friction. The brake friction (OE) market is projected to grow at a CAGR of 2.33% during the forecast period, from an estimated USD 13.48 Billion in 2018 to USD 15.84 Billion by 2025. This growth can be attributed to the increase in demand for vehicles across the globe.
The brake friction market has been segmented on the basis of ICE vehicle, off-highway vehicle, electric & hybrid vehicle, friction products, aftermarket, and region. Brake disc and brake pad are estimated to be the fastest growing and largest segments of the brake friction (OE) market, respectively, in terms of value. The increasing demand for performance, braking control, and less stopping distance of the vehicle has increased the demand for disc and brake pads.
The brake disc is estimated to be the fastest growing market, by product, in terms of value. Most of the present-day vehicles are equipped with brake disc as these are easy to install, repair, and more durable than the drum brake. With advancements in brake friction technology, disc brake friction is expected to show higher growth than the drum brake system. Disc brake products have higher stopping power and durability as compared to drum brake products. Moreover, increasingly stringent emission norms are driving the demand for lightweight friction products such as ceramic disc brakes. Hence, the ceramic brake disc is estimated to grow at the highest CAGR during the forecast period.
The brake pad is the fastest growing aftermarket, by product, in terms of value. The installation rate of disc brake system in vehicles is high in developed countries and is estimated to increase in developing countries such as India and Brazil. Additionally, the demand for brake disc is expected to increase further with an increase in average velocity of a vehicle. Disc pads have a lower product life as compared to the brake disc. Hence, the brake pads need to be replaced periodically. The increasing installation of disc brake in new cars will create an opportunity for the brake pad aftermarket. Hence, the brake pad aftermarket is expected to grow at a high CAGR during the forecast period.
The passenger car is the largest and fastest growing segment of brake friction (OE) market, by ICE vehicle type, in terms of value. The increasing demand for brake friction in passenger cars can be attributed to the increasing installation rate of disc brake systems in passenger cars. HEV is estimated to be the largest market for brake friction, by electric & hybrid vehicle type, in terms of value. HEVs have the largest share of electric and hybrid vehicle sales across the globe. Owing to the increasingly stringent emission norms and growing pollution levels, the adoption of electric & hybrid vehicles has increased across the globe.
North America is expected to dominate the brake friction aftermarket during the forecast period. Increasing vehicle parc is expected to boost the market in this region. The presence of leading brake friction manufacturers is also driving the growth of the market in this region. In addition, North America has an organized brake friction aftermarket, which includes key players such as Federal Mogul, Brembo, and others. Increasing customer awareness and technological advancements make it easy for manufacturers to operate in the aftermarket in the North American region. Additionally, consumers are more interested in the braking performance and safety of the vehicle. Hence, the region is expected to dominate the brake friction aftermarket.
The key factors restraining the growth of the brake friction aftermarket are the presence of multiple regional players in the brake friction market and easy availability of counterfeit products. The choice of brake friction systems varies with vehicle type and cost. This leads to customization and adds to the overall cost of the brake friction system. Moreover, a lack of awareness about the replacement of brake friction at regular intervals can hinder the growth of the aftermarket. Additionally, growing environmental concerns across the globe have compelled manufacturers to develop eco-friendly and lightweight brake friction products. Hence, key players such as Federal Mogul and Robert Bosch have launched their aftermarket products.
The major players in the brake friction market are Robert Bosch (Germany), Aisin Seiki (Japan), Nisshinbo Holding (Japan), Federal-Mogul (US), Brembo (Italy), Delphi (UK), Tenneco (US), Akebono Brake Industries (Japan), Miba (Germany), and SGL group (Germany). These companies collectively account for a major share of the brake friction market.
Aisin Seiki, Brembo, and Robert Bosch are the dominant players in the brake friction market. The extensive competition in the automotive industry has compelled these companies to focus on innovation. The companies are focusing on introducing innovative products in brake friction technology. As the demand for lightweight components is increasing, the lightweight ceramic disc will impact the brake friction market for electric and hybrid vehicle to a great extent.
To speak to our analyst for a discussion on the above findings, click Speak to Analyst
Table of Contents
1 Introduction (Page No. - 17)
1.1 Objectives
1.2 Product and Market Definition
1.3 Market Scope
1.3.1 Markets Covered
1.4 Years Considered in the Report
1.5 Currency & Pricing
1.6 Package Size
1.7 Limitations
1.8 Stakeholders
2 Research Methodology (Page No. - 21)
2.1 Research Data
2.2 Secondary Data
2.2.1 Key Secondary Sources
2.3 Data From Secondary Sources
2.4 Primary Data
2.4.1 Sampling Techniques & Data Collection Methods
2.4.2 Primary Participants
2.5 Market Size Estimation
2.5.1 Bottom-Up Approach
2.5.2 Top-Down Approach
2.6 Data Triangulation
2.7 Assumptions
3 Executive Summary (Page No. - 31)
4 Premium Insights (Page No. - 41)
4.1 Attractive Growth Opportunities in the Brake Friction Market
4.2 Brake Friction Market, By Country
4.3 Brake Friction OE Market, By Vehicle Type
4.4 Off-Highway Brake Friction (OE) Market, By Application
4.5 Electric & Hybrid Vehicle Brake Friction Market, By Vehicle Type
4.6 Automotive Disc Brake Market, By Disc Type
4.7 Automotive Brake Lining Market, By Lining Type
4.8 Brake Friction (OE) Market, By Product
4.9 Brake Friction Aftermarket, By Product
4.10 Brake Friction Product (OE) Market, By Region
5 Market Overview (Page No. - 48)
5.1 Introduction
5.2 Market Dynamics
5.2.1 Drivers
5.2.1.1 Increase in Vehicle Production Will Fuel the Demand for Brake Friction Market
5.2.1.1.1 Growing Demand for Passenger Cars and Commercial Vehicles
5.2.1.1.2 Increasing Demand for Construction Equipment and Off-Highway Vehicles
5.2.1.2 Increasing Use of Brakes Due to Traffic Congestion to Increase the Demand for Replacement Units
5.2.1.3 Increasing Vehicle PARC & Vehicle Miles Traveled to Boost the Aftermarket
5.2.2 Restraints
5.2.2.1 Improving Life of Brake Friction Products to Influence the Demand for Replacement Units
5.2.2.2 Advancements in Brake Technologies to Eliminate the Need for Friction Materials
5.2.2.3 Developing Public Transport Services and Trends Such as Ride Sharing
5.2.3 Opportunities
5.2.3.1 Electric & Hybrid Vehicle Segments are Expected to Drive the Demand for Brake Friction Market in Coming Future
5.2.3.2 Use of Lightweight Material in Brake Friction Products
5.2.3.3 Eco-Friendly and Non-Toxic Brake Friction Products to Be New Avenues of Growth for Brake Manufacturers
5.2.4 Challenges
5.2.4.1 Government Regulations Related to Alloy Composition of Brake Friction Products
5.2.4.2 Counterfeit Brake Friction Products in the Aftermarket
6 Brake Friction (OE) Market, By Product Type (Page No. - 60)
Note - The Chapter is Further Segmented at Regional Level (Asia Oceania, Europe, North America, and RoW)
6.1 Introduction
6.2 Brake Disc
6.3 Brake Pad
6.4 Drum Brake
6.5 Brake Shoe
6.6 Brake Liner
7 Off-Highway Brake Friction (OE) Market, By Application (Page No. - 68)
Note - The Chapter is Further Segmented at Regional Level (Asia Oceania, Europe, North America, and RoW)
7.1 Introduction
7.2 Agricultural Tractors
7.3 Construction Equipment
8 Electric & Hybrid Vehicle Brake Friction (OE) Market, By Vehicle Type (Page No. - 73)
Note - The Chapter is Further Segmented at Regional Level (Asia Oceania, Europe, North America, and RoW)
8.1 Introduction
8.2 Battery Electric Vehicle
8.3 Hybrid Electric Vehicle
8.4 Plug-In Hybrid Electric Vehicle
9 Brake Friction (OE) Market, By Vehicle Type (Page No. - 81)
Note - The Chapter is Further Segmented at Regional Level (Asia Oceania, Europe, North America, and RoW)
9.1 Introduction
9.2 Passenger Car
9.3 LCV (Light Commercial Vehicle)
9.4 Trucks
9.5 Buses
10 Brake Liner (OE) Market, By Liner Type (Page No. - 90)
Note - The Chapter is Further Segmented at Regional Level (Asia Oceania, Europe, North America, and RoW)
10.1 Introduction
10.2 Molded Brake Liner
10.3 Woven Brake Liner
11 Brake Disc (OE) Market, By Material Type (Page No. - 94)
The Chapter is Further Segmented at Regional Level (Asia Oceania, Europe, North America, and RoW)
11.1 Introduction
11.2 Metallic Brake Disc
11.3 Composite Brake Disc
11.4 Ceramic Brake Disc
12 Brake Friction Aftermarket, By Region (Page No. - 101)
Note: The Chapter is Further Segmented at Country Level and By Product Type (Brake Disc, Brake Drum, Brake Pad, Brake Shoe, Brake Liner)
12.1 Introduction
12.2 Asia Oceania
12.2.1 China
12.2.2 Japan
12.2.3 South Korea
12.2.4 India
12.3 Europe
12.3.1 Germany
12.3.2 France
12.3.3 UK
12.4 North America
12.4.1 US
12.4.2 Mexico
12.4.3 Canada
12.5 RoW
12.5.1 Russia
12.5.2 Brazil
13 Competitive Landscape (Page No. - 126)
13.1 Overview
13.2 Market Share Analysis
13.3 Competitive Situation & Trends
13.3.1 New Product Developments
13.3.2 Expansions
13.3.3 Mergers & Acquisitions
13.3.4 Joint Ventures & Agreements
13.3.5 Supply Contracts
14 Company Profiles (Page No. - 135)
(Business Overview, Products Offered, Recent Developments, SWOT Analysis, MnM View)*
14.1 Robert Bosch
14.2 Aisin Seiki
14.3 Nisshinbo
14.4 Federal-Mogul
14.5 Brembo
14.6 Delphi
14.7 Tenneco
14.8 Akebono
14.9 Miba
14.10 SGL
14.11 Meritor
14.12 Additional CPS
14.12.1 Europe
14.12.1.1 Continental Ag
14.12.1.2 Fte Automotive
14.12.1.3 Ate
14.12.1.4 Zf Friedrichshafen
14.12.1.5 Autoliv Inc
14.12.1.6 Wabco Holdings
14.12.2 Asia Pacific
14.12.2.1 Mando Corporation
14.12.2.2 Hitachi Automotive Systems, Ltd
14.12.2.3 Denso
14.12.3 North America
14.12.3.1 Cardone
14.12.3.2 Dorman
*Details on Business Overview, Products Offered, Recent Developments, SWOT Analysis, MnM View Might Not Be Captured in Case of Unlisted Companies.
15 Appendix (Page No. - 166)
15.1 Key Industry Insights
15.2 Discussion Guide
15.3 Knowledge Store: Marketsandmarkets Subscription Portal
15.4 Available Customizations
15.4.1 Brake Friction Aftermarket, By Vehicle (Country Level)
15.4.1.1 Passenger Cars
15.4.1.1.1 Brake Disc
15.4.1.1.2 Brake Pad
15.4.1.1.3 Brake Drum
15.4.1.1.4 Brake Shoe
15.4.1.1.5 Brake Liner
15.4.1.2 LCV
15.4.1.2.1 Brake Disc
15.4.1.2.2 Brake Pad
15.4.1.2.3 Brake Drum
15.4.1.2.4 Brake Shoe
15.4.1.2.5 Brake Liner
15.4.1.3 Hcv
15.4.1.3.1 Brake Disc
15.4.1.3.2 Brake Pad
15.4.1.3.3 Brake Drum
15.4.1.3.4 Brake Shoe
15.4.1.3.5 Brake Liner
15.4.2 Off-Highway Brake Friction Market, By Product Type, (Country Level)
15.4.2.1 Construction Equipment: Brake Friction Market
15.4.2.1.1 Brake Disc
15.4.2.1.2 Brake Pad
15.4.2.1.3 Brake Drum
15.4.2.1.4 Brake Shoe
15.4.2.1.5 Brake Liner
15.4.2.2 Agricultural Tractors: Brake Friction Market
15.4.2.2.1 Brake Disc
15.4.2.2.2 Brake Pad
15.4.2.2.3 Brake Drum
15.4.2.2.4 Brake Shoe
15.4.2.2.5 Brake Liner
15.4.3 Brake Friction Market, By Vehicle Type, (Country Level)
15.4.3.1 Passenger Cars: Brake Friction Market
15.4.3.1.1 Brake Disc
15.4.3.1.2 Brake Pad
15.4.3.1.3 Brake Drum
15.4.3.1.4 Brake Shoe
15.4.3.1.5 Brake Liner
15.4.3.2 LCV: Brake Friction Market
15.4.3.2.1 Brake Disc
15.4.3.2.2 Brake Pad
15.4.3.2.3 Brake Drum
15.4.3.2.4 Brake Shoe
15.4.3.2.5 Brake Liner
15.4.3.3 Bus: Brake Friction Market
15.4.3.3.1 Brake Disc
15.4.3.3.2 Brake Pad
15.4.3.3.3 Brake Drum
15.4.3.3.4 Brake Shoe
15.4.3.3.5 Brake Liner
15.4.3.4 Truck: Brake Friction Market
15.4.3.4.1 Brake Disc
15.4.3.4.2 Brake Pad
15.4.3.4.3 Brake Drum
15.4.3.4.4 Brake Shoe
15.4.3.4.5 Brake Liner
15.5 Related Reports
15.6 Author Details
List of Tables (91 Tables)
Table 1 Currency Exchange Rates (W.R.T. USD)
Table 2 Annual Time Spent in Traffic Congestion (Hours)
Table 3 Vehicle Weight Reduction Targets for Light Duty Ice Vehicle (20202050)
Table 4 Brake Friction Market, By Product Type, 20162025 (Million Units)
Table 5 Brake Friction Market, By Product Type, 20162025 (USD Million)
Table 6 Brake Disc: Brake Friction Market, By Region, 20162025 (Million Units)
Table 7 Brake Disc: Brake Friction Market, By Region, 20162025 (USD Million)
Table 8 Brake Pad: Brake Friction Market, By Region, 20162025 (Million Units)
Table 9 Brake Pad: Brake Friction Market, By Region, 20162025 (USD Million)
Table 10 Drum Brake: Brake Friction Market, By Region, 20162025 (Million Units)
Table 11 Drum Brake: Brake Friction Market, By Region, 20162025 (USD Million)
Table 12 Brake Shoe: Brake Friction Market, By Region, 20162025 (Million Units)
Table 13 Brake Shoe: Brake Friction Market, By Region, 20162025 (USD Million)
Table 14 Brake Liner: Brake Friction Market, By Region, 20162025 (Million Units)
Table 15 Brake Liner: Brake Friction Market, By Region, 20162025 (USD Million)
Table 16 OHV Brake Friction Market, By Application Type, 20162025 (Thousand Units)
Table 17 OHV Brake Friction Market, By Application Type, 20162025 (USD Million)
Table 18 Agricultural Tractors: OHV Brake Friction Market, By Region, 20162025 (000 Units)
Table 19 Agricultural Tractors: OHV Brake Friction Market, By Region, 20162025 (USD Million)
Table 20 Construction Equipment: OHV Brake Friction Market, By Region, 20162025 (000 Units)
Table 21 Construction Equipment: OHV Brake Friction Market, By Region, 20162025 (USD Million)
Table 22 Electric & Hybrid Vehicle Brake Friction Market, By Friction Products, 20162025 (000 Units)
Table 23 Electric & Hybrid Vehicle Brake Friction Market, By Friction Products, 20162025 (USD Million)
Table 24 Brake Friction Market, By Electric & Hybrid Vehicle Type, 20162025 (000 Units)
Table 25 Brake Friction Market, By Electric & Hybrid Vehicle Type, 20162025 (USD Million)
Table 26 BEV: Electric & Hybrid Vehicle Brake Friction Market, By Region, 20162025 (000 Units)
Table 27 BEV: Electric & Hybrid Vehicle Brake Friction Market, By Region, 20162025 (USD Million)
Table 28 HEV: Electric & Hybrid Vehicle Brake Friction Market, By Region, 20162025 (000 Units)
Table 29 HEV: Electric & Hybrid Vehicle Brake Friction Market, By Region, 20162025 (USD Million)
Table 30 PHEV: Electric & Hybrid Vehicle Brake Friction Market, By Region, 20162025 (000 Units)
Table 31 PHEV: Electric & Hybrid Vehicle Brake Friction Market, By Region, 20162025 (USD Million)
Table 32 Brake Friction Market, By Vehicle Type, 20162025 (Million Units)
Table 33 Brake Friction Market, By Vehicle Type, 20162025 (USD Million)
Table 34 Passenger Car: Brake Friction Market, By Region, 20162025 (Million Units)
Table 35 Passenger Car: Brake Friction Market, By Region, 20162025 (USD Million)
Table 36 LCV: Brake Friction Market, By Region, 20162025 (Million Units)
Table 37 LCV: Brake Friction Market, By Region, 20162025 (USD Million)
Table 38 Truck: Brake Friction Market, By Region, 20162025 (Million Units)
Table 39 Truck: Brake Friction Market, By Region, 20162025 (USD Million)
Table 40 Bus: Brake Friction Market, By Region, 20162025 (Million Units)
Table 41 Bus: Brake Friction Market, By Region, 20162025 (USD Million)
Table 42 Automotive Brake Liner Market, By Liner Type, 20162025 (Million Units)
Table 43 Molded Brake Liner: Automotive Brake Liner Market, By Region, 20162025 (Million Units)
Table 44 Woven Brake Liner: Automotive Brake Liner Market, By Region, 20162025 (Million Units)
Table 45 Brake Disc Market, By Brake Disc Material Type, 20162025 (Thousand Units)
Table 46 Brake Disc Market, By Brake Disc Material Type, 20162025 (USD Million)
Table 47 Metallic Brake Disc: Brake Friction Market, By Region, 20162025 (Thousand Units)
Table 48 Metallic Brake Disc: Brake Friction Market, By Region, 20162025 (USD Million)
Table 49 Composite Brake Disc: Brake Friction Market, By Region, 20162025 (Thousand Units)
Table 50 Composite Brake Disc: Brake Friction Market, By Region, 20162025 (USD Million)
Table 51 Ceramic Brake Disc: Brake Friction Market, By Region, 20162025 (Thousand Units)
Table 52 Ceramic Brake Disc: Brake Friction Market, By Region, 20162025 (USD Million)
Table 53 Brake Friction Aftermarket, By Region, 20162025 (Million Units)
Table 54 Brake Friction Aftermarket, By Region, 20162025 (USD Million)
Table 55 Asia Oceania: Brake Friction Aftermarket, By Country, 20162025 (Million Units)
Table 56 Asia Oceania: Brake Friction Aftermarket, By Country, 20162025 (USD Million)
Table 57 China: Brake Friction Aftermarket, By Product Type, 20162025 (Million Units)
Table 58 China: Brake Friction Aftermarket, By Product Type, 20162025 (USD Million)
Table 59 Japan: Brake Friction Aftermarket, By Product Type, 20162025 (Million Units)
Table 60 Japan: Brake Friction Aftermarket, By Product Type, 20162025 (USD Million)
Table 61 South Korea: Brake Friction Aftermarket, By Product Type, 20162025 (Million Units)
Table 62 South Korea: Brake Friction Aftermarket, By Product Type, 20162025 (USD Million)
Table 63 India: Brake Friction Aftermarket, By Product Type, 20162025 (Million Units)
Table 64 India: Brake Friction Aftermarket, By Product Type, 20162025 (USD Million)
Table 65 Europe: Brake Friction Aftermarket, By Country, 20162025 (Million Units)
Table 66 Europe: Brake Friction Aftermarket, By Country, 20162025 (USD Million)
Table 67 Germany: Brake Friction Aftermarket, By Product Type, 20162025 (Million Units)
Table 68 Germany: Brake Friction Aftermarket, By Product Type, 20162025 (USD Million)
Table 69 France: Brake Friction Aftermarket, By Product Type, 20162025 (Million Units)
Table 70 France: Brake Friction Aftermarket, By Product Type, 20162025 (USD Million)
Table 71 UK: Brake Friction Aftermarket, By Product Type, 20162025 (Million Units)
Table 72 UK: Brake Friction Aftermarket, By Product Type, 20162025 (USD Million)
Table 73 North America: Brake Friction Aftermarket, By Country, 20162025 (Million Units)
Table 74 North America: Brake Friction Aftermarket, By Country, 20162025 (USD Million)
Table 75 US: Brake Friction Aftermarket, By Product Type, 20162025 (Million Units)
Table 76 US: Brake Friction Aftermarket, By Product Type, 20162025 (USD Million)
Table 77 Mexico: Brake Friction Aftermarket, By Product Type, 20162025 (Million Units)
Table 78 Mexico: Brake Friction Aftermarket, By Product Type, 20162025 (USD Million)
Table 79 Canada: Brake Friction Aftermarket, By Product Type, 20162025 (Million Units)
Table 80 Canada: Brake Friction Aftermarket, By Product Type, 20162025 (USD Million)
Table 81 RoW: Brake Friction Aftermarket, By Country, 20162025 (Million Units)
Table 82 RoW: Brake Friction Aftermarket, By Country, 20162025 (USD Million)
Table 83 Russia: Brake Friction Aftermarket, By Product Type, 20162025 (Million Units)
Table 84 Russia: Brake Friction Aftermarket, By Product Type, 20162025 (USD Million)
Table 85 Brazil: Brake Friction Aftermarket, By Product Type, 20162025 (Million Units)
Table 86 Brazil: Brake Friction Aftermarket, By Product Type, 20162025 (USD Million)
Table 87 New Product Developments, 20152018
Table 88 Expansions, 20142018
Table 89 Mergers & Acquisitions, 20142017
Table 90 Joint Ventures & Agreements, 20142018
Table 91 Supply Contracts, 20142018
List of Figures (63 Figures)
Figure 1 Market Segmentation: Brake Friction Market
Figure 2 Brake Friction Market: Research Design
Figure 3 Research Methodology
Figure 4 Breakdown of Primary Interviews: By Company Type, Designation, & Region
Figure 5 Brake Friction Market: Bottom-Up Approach
Figure 6 Brake Friction Aftermarket: Bottom-Up Approach
Figure 7 Brake Friction Market, By Materials and Process: Top-Down Approach
Figure 8 Brake Friction Market, By Market Type, 2018 vs 2025 (USD Million)
Figure 9 Brake Friction Aftermarket, By Region, 2018 vs 2025 (USD Billion)
Figure 10 Brake Friction Aftermarket, By Product Type, 2018 vs 2025 (USD Billion)
Figure 11 Brake Friction (OE) Market, By Vehicle Type, 2018 vs 2025 (USD Million)
Figure 12 Brake Friction Market, By Electric & Hybrid Vehicle Type, 2018 vs 2025 (USD Million)
Figure 13 Off-Highway Brake Friction Market, By Application, 2018 vs 2025 (USD Million)
Figure 14 Brake Friction Products (OE) Market, By Product Type, 2018 vs 2025 (USD Million)
Figure 15 Brake Disc (OE) Market, By Disc Type, 20182025 (USD Million)
Figure 16 Brake Liner Market, By Liner Type, 20182025 (Million Units)
Figure 17 Increasing Vehicle PARC & Average Miles Driven Will Drive the Brake Friction Aftermarket During the Forecast Period
Figure 18 India to Grow at the Highest CAGR in Brake Friction Market, 2018
Figure 19 Passenger Car Segment to Dominate the Brake Friction (OE) Market, 20182025 (USD Billion)
Figure 20 Agricultural Tractors Segment to Hold the Largest Share of OHV Brake Friction Market, 20182025 (USD Million)
Figure 21 HEV Segment to Hold the Largest Share of Brake Friction Market, 20182025 (USD Million)
Figure 22 Ceramic Brake Segment to Witness the Highest Growth in the Automotive Disc Brake Market, 20182025 (USD Million)
Figure 23 Molded Brake Lining Segment to Witness the Highest Growth in the Automotive Brake Lining Market, 20182025
Figure 24 Brake Disc to Hold the Largest Share in the Brake Friction Market, 20182025 (USD Million)
Figure 25 Brake Pad to Witness the Highest Growth in the Brake Friction Aftermarket, 20182025 (USD Million)
Figure 26 Asia Oceania to Hold the Largest Share in the Brake Friction (OE) Market, 20182025 (USD Million)
Figure 27 Brake Friction: Market Dynamics
Figure 28 Passenger Car Production, By Key Country, 20172025 (000 Units)
Figure 29 Off-Highway Vehicle Sales, By Key Country, 2017 vs 2022 (000 Units)
Figure 30 Total Vehicle PARC, By Key Country, 20172022 (Million Units)
Figure 31 Passenger Car Average Miles Driven, By Key Country, 2017 vs 2019 vs 2022 (Thousand Miles)
Figure 32 Replacement Life of Brake Disc, By Material (Kilometers), 2017
Figure 33 Electric Vehicle Sales, By Vehicle Type, 20152025 (Thousand Units)
Figure 34 Weight of Brake Disc, By Material Used (LBS)
Figure 35 Brake Friction Market, By Product Type, 2018 vs 2025 (USD Million)
Figure 36 OHV Brake Friction Market, By Application, 2018 vs 2025 (USD Million)
Figure 37 Electric & Hybrid Vehicle Brake Friction Market, By Vehicle Type, 2018 vs 2025 (USD Million)
Figure 38 Brake Friction Market, By Vehicle Type, 2018 vs 2025 (USD Million)
Figure 39 Automotive Brake Liner Market, By Liner Type, 2018 vs 2025 (Million Units)
Figure 40 Brake Friction Market, By Brake Disc Material Type, 2018 vs 2025 (USD Billion)
Figure 41 Brake Friction Aftermarket, 20182025 (USD Million)
Figure 42 Asia Oceania: Brake Friction Aftermarket Snapshot
Figure 43 Europe: Brake Friction Aftermarket, By Country, 2018 vs 2025 (USD Million)
Figure 44 North America: Brake Friction Aftermarket Snapshot
Figure 45 RoW: Brake Friction Aftermarket, By Country, 2018 vs 2025 (USD Million)
Figure 46 Companies Adopted Expansions as the Key Growth Strategy, 20132017
Figure 47 Brake Friction Market Share, 2017
Figure 48 Robert Bosch: Company Snapshot
Figure 49 SWOT Analysis: Robert Bosch
Figure 50 Aisin Seiki: Company Snapshot
Figure 51 SWOT Analysis: Aisin Seiki
Figure 52 Nisshinbo: Company Snapshot
Figure 53 SWOT Analysis: Nisshinbo
Figure 54 Federal-Mogul: Company Snapshot
Figure 55 SWOT Analysis: Federal-Mogul
Figure 56 Brembo: Company Snapshot
Figure 57 SWOT Analysis: Brembo
Figure 58 Delphi: Company Snapshot
Figure 59 Tenneco: Company Snapshot
Figure 60 Akebono: Company Snapshot
Figure 61 Miba: Company Snapshot
Figure 62 SGL: Company Snapshot
Figure 63 Meritor: Company Snapshot
Benchmarking the rapid strategy shifts of the Top 100 companies in the Brake Friction Market
Request For Special Pricing
Growth opportunities and latent adjacency in Brake Friction Market
I AM PARTICULARLY INTERESTED IN THE BREMBO COMPANY AND IN PORTER FIVE FORCES ANALYSIS. THANK YOU IN ADVANCE.
I want a comprehensive report about the whole brake pads, lining, shoe, drums, for all type of passenger car and all type of commercial car, and for plane and locomotive and other means of transportation that uses brake pads or other forms braking.