The study involved four major activities in estimating the current size of the automotive brake system market. Exhaustive secondary research was done to collect information on the market, peer, and parent markets. The next step was to validate these findings and assumptions and size them with industry experts across value chains through primary research. The bottom-up and top-down approaches were employed to estimate the complete market size. After that, market breakdown and data triangulation processes were used to estimate the market size of segments and subsegments.
Secondary Research
In the secondary research process, various secondary sources have been used to identify and collect information useful for an extensive commercial study of the automotive brake system market. The secondary sources referred to in this research study include Organisation Internationale des Constructeurs d'Automobiles (OICA), MEMA Brake Manufacturers Council (BMC), Automotive Component Manufacturers Association of India (ACMA); corporate filings (such as annual reports, investor presentations, and financial statements); and trade, business, and automotive associations. Additionally, secondary research has been carried out to understand the average selling prices of disc and drum brakes by vehicle type, historic sales of new vehicles, and vehicle parc. Secondary data has been collected and analyzed to determine the overall market size, further validated by primary research.
Primary Research
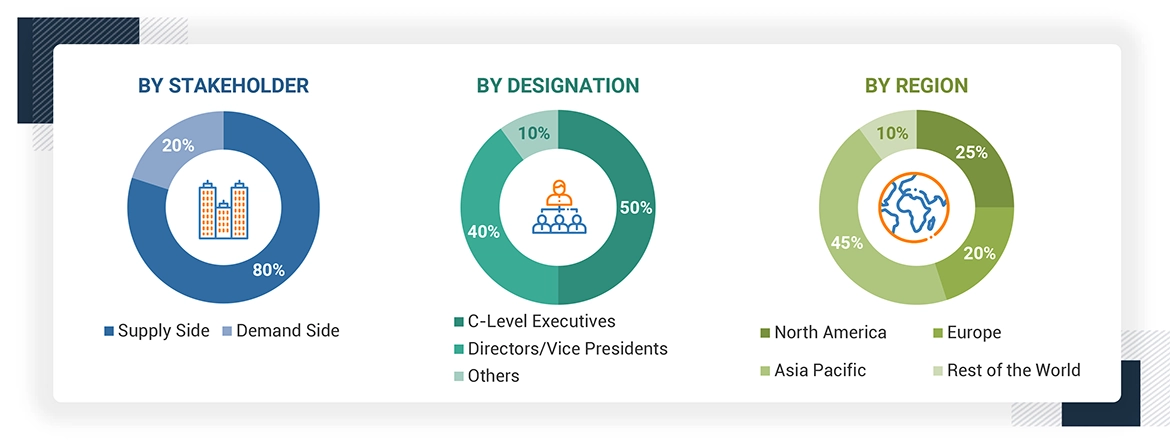
In the primary research process, various primary sources from both the supply and demand sides were interviewed to obtain qualitative and quantitative information on the market. The primary sources from the supply side included industry experts such as CXOs, vice presidents, directors from business development, marketing, product development/innovation teams, and related key executives from various key companies. Various system integrators, industry associations, independent consultants/industry veterans, and key opinion leaders were also interviewed.
Primary interviews have been conducted to gather insights such as ICE vehicle and off-highway equipment sales forecast, disc & drum brake market penetration & forecast, future technology trends, and upcoming technologies in the automotive brake system industry. Data triangulation was then done with the information gathered from secondary research. Stakeholders from the demand and supply side have been interviewed to understand their views on the points mentioned above.
Primary interviews have been conducted with market experts from the demand and supply side across four major regions: North America, Europe, Asia Pacific, and the Rest of the World. Primary data has been collected through questionnaires, emails, and telephonic interviews. In canvassing primaries, we have strived to cover various departments within organizations, such as sales and operations, to provide a holistic viewpoint in our report.
After interacting with industry experts, we have also conducted brief sessions with highly experienced independent consultants to reinforce the findings from our primaries. This and the in-house subject matter experts’ opinions have led us to the findings described in the remainder of this report.
To know about the assumptions considered for the study, download the pdf brochure
Market Size Estimation
A detailed market estimation approach was followed to estimate and validate the value of the automotive brake system market and other dependent submarkets, as mentioned below:
-
Key players in the automotive brake system market were identified through secondary research, and their global market shares were determined through primary and secondary research.
-
The research methodology included studying annual and quarterly financial reports, regulatory filings of significant market players (public), and interviews with industry experts for detailed market insights.
-
All industry-level penetration rates, percentage shares, splits, and breakdowns for the automotive brake system were determined using secondary sources and verified through primary sources.
-
All key macro indicators affecting the revenue growth of the market segments and subsegments have been accounted for, viewed in extensive detail, verified through primary research, and analyzed to get the validated and verified quantitative and qualitative data.
-
The gathered market data was consolidated and added with detailed inputs, analyzed, and presented in this report.
-
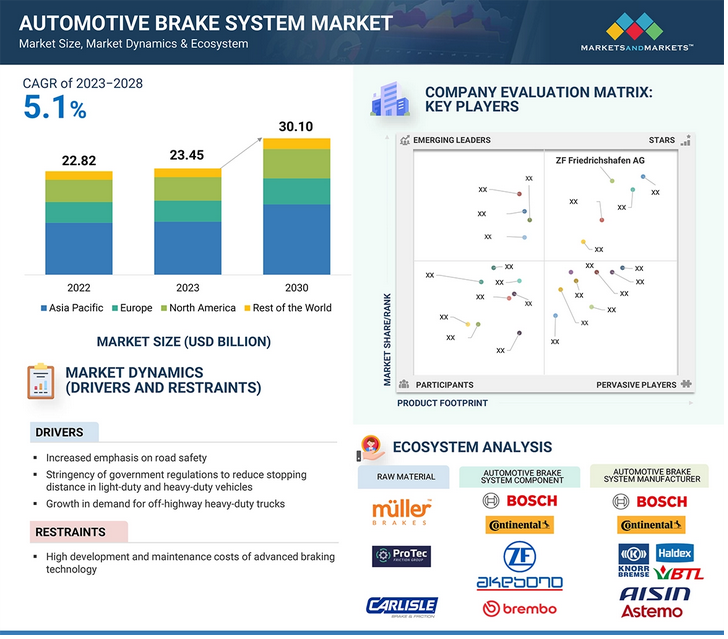
Qualitative aspects such as market drivers, restraints, opportunities, and challenges have been considered while calculating and forecasting the market size.
AUTOMOTIVE BRAKE SYSTEM MARKET (ON- & OFF-HIGHWAY): BOTTOM-UP APPROACH

To know about the assumptions considered for the study, Request for Free Sample Report
AUTOMOTIVE BRAKE SYSTEM MARKET: TOP-DOWN APPROACH

Data Triangulation
After arriving at the overall market size, the market was split into several segments and sub-segments using the market size estimation processes explained above. Where applicable, data triangulation and market breakdown procedures were employed to complete the overall market engineering process and determine each market segment's and sub-segments exact statistics. The data was triangulated by studying various factors and trends.


 LARGEST MARKET In 2022
 India FASTEST-GROWING MARKET IN THE REGION


User
Nov, 2019
We are interested in this document, because we need to write a paper concerning the Knorr-Bremse and Haldex merger commissioned by the University of Leuven, Belgium..
User
Nov, 2019
I am a trainee from continental Corporation. We purchased this study a few month ago and have some further questions. Especially some questions in regard to some definitions and some results in the Off-highway area. Please contact me as soon as possible .
User
Nov, 2019
let me keep this short as I do not have time to waste on this. I am interested in understanding brake manufacturers locations, annual outputs, expected growth and new programs won. Evidence that this report contains 3 out of 4 of these requirements I will buy your report. .
User
Nov, 2019
OFF HIGHWAY BRAKES FOR CONSTRUCTION, AGRICULTURY, MINING, MILITARY MARKETS). Market share, sales, main customers of each player, main products, etc.
User
Nov, 2019
Change from Vaccum Systems to electro hydraulic (EHB) Systems. How fast will the Change come into real volume production..
User
Nov, 2019
What would be the future market of Air Disc Brake in Commercial Vehicle market. And competition matrix in Brake system..
User
Nov, 2019
We are looking for information pertaining to Automotive Electronically Assisted Brake (EAB) System Market..
User
Nov, 2019
Car type vehicles M1 and light commercials N1, especially interesting hybrid vehicles. Also an interest in military vehicles.
User
Nov, 2019
Would like to see the depth of your reports. Maybe you can show that especially for the passcar brakes market.
User
Nov, 2019
Foundation brake suppliers - market share, awarded programs, plant locations in NAFTA, plant capacities..
User
Nov, 2019
Hello Please advise if your report details Automatic Park Brake, Electronic Park Brake Technology future implementation.
Apoorv
Jul, 2019
We are interested in growing our company in Canada. We would like to explore a relationship with a brake manufacturer / supplier that wants to increase their after market share of the Canadian Market. We are looking for Marketing help to determine who, and how, to best accomplish an introduction to this opportunity. .
Ajinkya
Jun, 2019
Please share sample which will contain market shares by supplier in AP or EMEA for pads or discs. We have few report to chose from but I want to select the most accurate one - hence my request..