Ballistic Protection Market Size, Share, Trends & Growth Analysis

Ballistic Protection Market by Material (Metals & Alloys, Ceramics, Composites, Others), Product (PPE, Weapon Stations and Optronics, Engine Protection, Others), Threat Level, Platform, Application, Technology, and Region - Global Forecast to 2027

Report Code: AS 2798 Aug, 2022, by marketsandmarkets.com

Updated on : Oct 22, 2024

The Ballistic Protection Market is experiencing significant growth driven by increasing demand for advanced protective gear across various sectors, including military, law enforcement, and civilian applications. Technological advancements in materials and manufacturing processes, such as the development of lightweight, high-strength composites and smart fabrics, are enhancing the effectiveness and comfort of ballistic protection products. As threats evolve, the need for innovative solutions that provide reliable protection while ensuring mobility and usability continues to rise. Additionally, growing awareness of personal safety and security in both public and private sectors is further fueling market expansion, leading to the adoption of state-of-the-art ballistic protection systems.
 
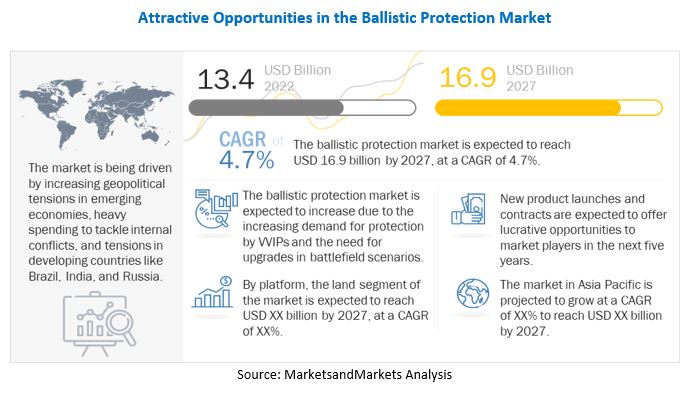
The Ballistic Protection Market is projected to grow from USD 13.4 billion in 2022 to USD 16.9 billion by 2027, growing at a CAGR of 4.7% from 2022 to 2027.

Increasing procurement of armored vehicles are also aiding the growth of the ballistic protection market in the US. Key manufacturers in the US are increasingly investing in R&D activities for the development of new and advanced armored vehicles. . In March 2022, it announced that it had increased its defense spending by 7.1% to reach USD 229 billion, continuing years of robust spending on its increasingly powerful military that is challenging the dominance of US armed forces in the Indo-Pacific region. The growth of the ballistic protection industry in China can be attributed to the procurement of vehicle armor protection systems such as Kevlar glass and fibers. India is the second-fastest-growing market for ballistic protection after China. The growth of the market in this country can be attributed to the increase in the defense budget and the overall development of the homeland security forces, such as the police, the first responders, and the VIP security personnel. With the rise in inter-border conflicts with Pakistan and China, the country also focuses on strengthening its military capabilities as well as safeguarding them.

Various players such as BAE Systems (UK), Avon Protection (US), Rheinmetall AG (US), Tencate Advanced Armor (Netherlands), Point Blank Enterprises (US), SAAB AB (Sweden) among others, are prominent players operating in the ballistic protection market.
Ballistic Protection Market

To know about the assumptions considered for the study, Request for Free Sample Report

Ballistic Protection Market Dynamics:

Driver: Rising political unrest in emerging economies

An increase in political instability and unrest, as well as increasing terrorist activities, have prompted law enforcement agencies and the material science community to develop and provide effective solutions that can help the safe movement of troops and vehicles. In the present scenario, the political conflicts in Syria, Libya, Iraq, and Afghanistan, along with Russia & Ukraine, India & Pakistan, India & China, and Russia & Turkey are increasing the need for combat armor. Domestic conflicts in many countries are also boosting the need for ammunition. This drives the demand for protective equipment.

Developing countries, such as Brazil, India, and Russia, are spending heavily on defense owing to internal conflicts and tensions with their neighboring countries. The Middle East & Africa region suffers from severe political unrest, boosting the need for advanced armor materials.

Unstable political conditions and terrorism across the world are adversely affecting the economies of many countries. Therefore, these countries are channeling their resources to invest in defense systems to counter these issues, which is a long-term driver for the global ballistic protection market

Restraint: Failure to provide complete protection

Regardless of technological advances, present ballistic composite technologies and products are unable to provide complete protection, especially on the battlefield. Fiber vests and composite helmets are good against shrapnel from artillery or grenades, which accounts for 70% to 85% of battlefield casualties. However, ballistic composites fail to provide 100% protection against other casualties, such as those caused by high-powered rifle fire. Therefore, companies in the industry are looking for better hard-facing inserts to counter existing threats

Opportunity: Rising demand for multipurpose equipment

The current market for personal protective equipment (PPE) is focused on high-performance and reasonably priced products. Many customers prefer protective equipment that serves more than one function. In general, PPE is designed for protection against a hazard—for instance, fire-resistant (FR) clothing is resistant to fire damage but may not provide adequate protection against mechanical hazards. However, workers in industries such as oil & gas and chemical may be exposed to multiple hazards at once. In such situations, workers need multifunctional protective clothing for protection against multiple hazards.

Challenges: High production cost of armor materials

The production process of armor materials varies based on their application. The technology used in manufacturing these materials is one of the most vital parts of the value chain. Production is governed by various agencies as well as by military forces, as it is a sensitive market. Various initiatives have been undertaken by these agencies and forces to ensure the secrecy and security of the technology used in the production of armor materials. The production process also needs to undergo several control methodologies to ensure intellectual property theft is minimized. These factors increase the production cost of armor materials. Manufacturers also invest heavily in R&D to enhance the efficiency of armor, thus increasing the overall cost of the material

Ballistic Protection Market Ecosystem:

The key stakeholders in the ballistic protection market ecosystem include companies which provide platforms and ballistic protection products. The major influencers in this market are investors, funders, academic researchers, integrators, service providers, and licencing agencies.

Marine segment held largest market share in terms of value in ballistic protection market

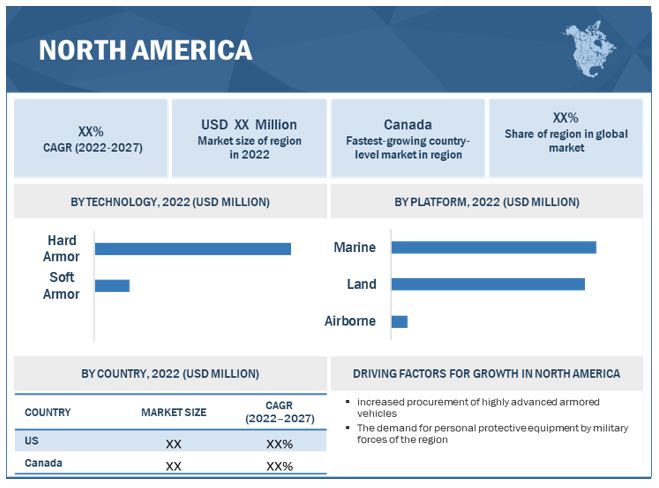
On the basis of platform, the ballistic protection market has been segmented into land, airborne and marine. Mairne accounted for 49.2% of the overall ballistic protection market. Defense naval vessels are specifically designed and used by coastguards and naval forces. They differ from commercial ships in terms of their applications, design, construction methods, and technologies applied. The hull of a ship is the major area in which ballistic materials are used. Apart from the hull, ballistic protection systems are installed on windows, weapon mounts, and optronics, among others.

The marine segment includes destroyers, frigates, corvettes, aircraft carriers, offshore support vehicles, and unmanned surface vehicles. The increase in demand for maritime security has resulted in the growth of the unmanned surface vehicles market.

Homeland Security is anticipated to grow at highest CAGR during forecast period

The homeland security application segment is expected to grow at the highest CAGR of 7.4% during the forecast period. Ballistic-resistant body armor is worn by homeland security officers while in the field to protect against specific ballistic threats. Homeland security officers use personal protective equipment, including body vests, ballistic helmets, and gloves to ensure safety during missions. Ballistic helmets are intended to protect the wearer against small arms fire and fragmentation threats. The combat systems used by homeland security officers are ballistic-resistant as they are reinforced with ceramics and thermoplastics.

In terms of value, North America led the ballistic protection market

The US and Canada are considered under North America for market analysis. Market growth in the North American region can be attributed to the increased procurement of highly advanced armored vehicles and the demand for personal protective equipment by military forces of the region. The increase in terror threats is the main reason for the procurement of ballistic protection systems for land, airborne, and marine platforms. The global defense industry investment in R&D has led to the development of new soldier modernization technologies that enhance survivability and sustainability capabilities, including advanced combat clothing, boots, hard armors, eyewear, and helmets.
Ballistic Protection Market by Region

To know about the assumptions considered for the study, download the pdf brochure

Top Ballistic Protection Companies - Key Market Players

The ballistic protection companies are dominated by a few globally established players such as BAE Systems (UK), Avon Protection (US), Rheinmetall AG (US), Tencate Advanced Armor (Netherlands), Point Blank Enterprises (US), SAAB AB (Sweden) among others, are prominent players operating in the ballistic protection market.

Want to explore hidden markets that can drive new revenue in Ballistic Protection Market?

Scope of the Report

Report Metric

Details

 
Estimated Market Size
 
USD 13.4 Billion
 
Projected Market Size
 
USD 16.9 Billion

Growth Rate

4.7%

Market size available for years

2018-2027

Base year considered

2021

Forecast period

2022-2027

Forecast units

Value (USD)

Segments covered

By platform, application, technology, material, product, threat level

Geographies covered

North America, Europe, Asia Pacific, Middle East, Rest of the World

Companies covered

BAE Systems (UK), Avon Protection (US), Rheinmetall AG (US), Tencate Advanced Armor (Netherlands), Point Blank Enterprises (US) and SAAB AB (Sweden), among others

This research report categorizes the Ballistic Protection Market based on Platform, Application, Technology, Material, Product, Threat Level and Region.

By Platform

  • Land
    • Combat Armored Vehicles
    • Combat Support Vehicles
    • Unmanned Armored Ground Vehicles
    • Soldiers & Security Personnel
    • Base Stations
  • Airborne
  • Marine
    • Destroyers
    • Frigates
    • Coverettes
    • Offshore Support Vessels (OSVS)
    • Aircraft Carriers
    • Submarines
    • Unmanned Surface Vehicles

By Application

  • Military
  • Homeland Security
    • Paramilitary Forces
    • Police Forces
    • Special Forces

By Technology

  • Hard Armor
    • Land
    • Airborne
    • Marine
  • Soft Armor
    • Land
    • Airbrone
    • Marine

By Material

  • Metals & Alloys
    • High-density steel
    • Aluminium
    • Titanium
  • Ceramics
    • Aluminum Oxide
    • Silicon Carbide
  • Composites
    • Aramid Composites
    • Carbon Composites
    • Hybrid Composites
    • 3D Composites
  • By Bulletproof Glass
    • Acrylic
    • Polycarbonate
  • By Fabric
    • Organic Cotton
    • Synthetic Nylon & Ployester

By Product

  • Personal Protective Equipment
    • Body Armor Clothing
    • Ballistic Helmets
    • Vests
    • Ballistic Boots
    • Ballistic Gloves
  • Ballistic Containers & Portable Shelters
  • Ballistic Blocks
  • Ballistic Barrier Systems
  • Hull & Body
  • Weapon Stations & Optronics
  • Fuel Drop Tanks & Ammunition Storage
  • Cockpit Ballistic Protection
  • Pilot Seat Protection
  • Ballistic Floors
  • Ballistic Windows
  • Ballistic Doors
  • Engine Protection

By Threat Level

  • Level II & Level IIA
  • Level III & Level IIIA
  • Level IV & Above

By Region

  • North America
  •  Europe
  • Asia Pacific
  • Middle East
  • Africa
  • Rest of the World

Recent Developments

  • In May 2022, TenCate Advanced Armor received a contract from the Naval Surface Warfare Center to provide maritime buoyant plates to support the Antiterrorism Afloat Equipage Program
  •  In March 2022, BAE Systems received a contract from the US Marine Corps to provide an Amphibious Combat Vehicle Recovery variant. The new variant provides direct field support and maintenance to the ACV family of vehicles.
  • In March 2022, BAE Systems received a contract from the US Contracting Command for providing M109A7 and M992A3 combat vehicles.
  • In March 2022, BAE Systems received a contract from the US Marine Corps to provide amphibious combat vehicles.
  • In February 2022, Tencate Advanced Armor received a contract for providing a force protection system for Mack Granite-based M917A3 Heavy Dump Truck (HDT) and other Mack Defense vehicle platforms.
  • In February 2022, Avon Protection received a contract to provide the second generation advanced combat helmet (ACH).
  • In February 2022, Avon Protection received a contract from the United States Department of Defense for providing second-generation advanced combat helmets.
  • In February 2022, Point Blank Enterprises received a contract from the US Marine Corps CH-53K for providing ballistic armor systems.

Frequently Asked Questions (FAQs):

To speak to our analyst for a discussion on the above findings, click Speak to Analyst


Exclusive indicates content/data unique to MarketsandMarkets and not available with any competitors.

TABLE OF CONTENTS
 
1 INTRODUCTION (Page No. - 37)
    1.1 STUDY OBJECTIVES
    1.2 MARKET DEFINITION
    1.3 STUDY SCOPE
           1.3.1 MARKETS COVERED
                    FIGURE 1 BALLISTIC PROTECTION MARKET SEGMENTATION
           1.3.2 REGIONAL SCOPE
           1.3.3 YEARS CONSIDERED
    1.4 CURRENCY
           TABLE 1 USD EXCHANGE RATES
    1.5 LIMITATIONS
    1.6 INCLUSIONS & EXCLUSIONS
    1.7 MARKET STAKEHOLDERS
    1.8 SUMMARY OF CHANGES
 
2 RESEARCH METHODOLOGY (Page No. - 41)
    2.1 RESEARCH DATA
           FIGURE 2 RESEARCH PROCESS FLOW
           FIGURE 3 RESEARCH DESIGN: BALLISTIC PROTECTION MARKET
           2.1.1 SECONDARY DATA
                    2.1.1.1 Key data from secondary sources
           2.1.2 PRIMARY DATA
                    2.1.2.1 Key data from primary sources
                    2.1.2.2 Breakdown of primaries
                               FIGURE 4 BREAKDOWN OF PRIMARY INTERVIEWS: BY COMPANY TYPE, DESIGNATION, AND REGION
    2.2 MARKET SIZE ESTIMATION
           2.2.1 BOTTOM-UP APPROACH
                    2.2.1.1 Ballistic protection market
                    2.2.1.2 Ballistic protection market, by application
                    2.2.1.3 Ballistic protection market, by technology
                    2.2.1.4 Ballistic protection market, by product
                               FIGURE 5 MARKET SIZE ESTIMATION METHODOLOGY: BOTTOM-UP APPROACH
           2.2.2 TOP-DOWN APPROACH
                    2.2.2.1 Ballistic protection market, by system and by threat level
                    2.2.2.2 Ballistic protection market, by system and by material
                               FIGURE 6 MARKET SIZE ESTIMATION METHODOLOGY: TOP-DOWN APPROACH
    2.3 DATA TRIANGULATION & VALIDATION
           2.3.1 TRIANGULATION THROUGH SECONDARY
           2.3.2 TRIANGULATION THROUGH PRIMARIES
                    FIGURE 7 DATA TRIANGULATION
    2.4 RESEARCH LIMITATIONS
    2.5 RESEARCH ASSUMPTIONS
    2.6 RISK ANALYSIS
 
3 EXECUTIVE SUMMARY (Page No. - 51)
    FIGURE 8 LAND SEGMENT TO LEAD BALLISTIC PROTECTION MARKET DURING FORECAST PERIOD
    FIGURE 9 HARD ARMOR SEGMENT TO DOMINATE DURING FORECAST PERIOD
    FIGURE 10 MILITARY TO BE LEADING SEGMENT DURING FORECAST PERIOD
    FIGURE 11 ASIA PACIFIC TO ACCOUNT FOR LARGEST SHARE OF BALLISTIC PROTECTION MARKET IN 2022
 
4 PREMIUM INSIGHTS (Page No. - 54)
    4.1 ATTRACTIVE GROWTH OPPORTUNITIES FOR PLAYERS IN BALLISTIC PROTECTION MARKET
           FIGURE 12 INCREASING GEOPOLITICAL TENSIONS IN EMERGING ECONOMIES TO DRIVE THE MARKET
    4.2 BALLISTIC PROTECTION MARKET, BY MATERIAL
           FIGURE 13 COMPOSITES SEGMENT TO ACCOUNT FOR LARGEST MARKET SIZE FROM 2022 TO 2027
    4.3  MARKET, BY PLATFORM
           FIGURE 14 LAND TO BE LARGEST PLATFORM SEGMENT DURING FORECAST PERIOD
    4.4 MARKET, BY KEY REGION
           FIGURE 15 EUROPE TO HOLD DOMINANT POSITION IN 2022
    4.5 MARKET, BY APPLICATION
           FIGURE 16 MILITARY APPLICATION TO DOMINATE DURING FORECAST PERIOD
    4.6 MARKET, BY THREAT LEVEL
           FIGURE 17 THREAT LEVEL IV & ABOVE TO HOLD LARGEST MARKET SHARE
    4.7 BALLISTIC PROTECTION MARKET, BY COUNTRY
           FIGURE 18 SOUTH KOREA TO REGISTER HIGHEST CAGR IN BALLISTIC PROTECTION MARKET DURING FORECAST PERIOD
 
5 MARKET OVERVIEW (Page No. - 58)
    5.1 INTRODUCTION
    5.2 MARKET DYNAMICS
           FIGURE 19 BALLISTIC PROTECTION MARKET: DRIVERS, RESTRAINTS, OPPORTUNITIES, AND CHALLENGES
           5.2.1 DRIVERS
                    5.2.1.1 Rising political unrest in emerging economies
                    5.2.1.2 Need for upgrades in battlefield scenarios
                    5.2.1.3 Development of lightweight, comfortable, and high-strength materials
                    5.2.1.4 Demand for protection by VVIPs
           5.2.2 RESTRAINTS
                    5.2.2.1 Inability to provide complete protection
                    5.2.2.2 Stringent standards for ballistic composite products
           5.2.3 OPPORTUNITIES
                    5.2.3.1 Rising demand for multipurpose equipment
                    5.2.3.2 Increasing demand from Asia Pacific
                    5.2.3.3 Advancements in armor composite materials
           5.2.4 CHALLENGES
                    5.2.4.1 High production cost of armor materials
                    5.2.4.2 Demand for increased comfort and functionality
    5.3 TRENDS/DISRUPTIONS IMPACTING CUSTOMER BUSINESS
           5.3.1 REVENUE SHIFT AND NEW REVENUE POCKETS FOR BALLISTIC PROTECTION MARKET
                    FIGURE 20 REVENUE SHIFT IN BUSINESS MARKET
    5.4 BALLISTIC PROTECTION MARKET ECOSYSTEM
           5.4.1 PROMINENT COMPANIES
           5.4.2 START-UPS AND SMALL ENTERPRISES
           5.4.3 END USERS
                    FIGURE 21 MARKET ECOSYSTEM MAP
                    TABLE 2 BALLISTIC PROTECTION MARKET ECOSYSTEM
    5.5 TECHNOLOGY ANALYSIS
           5.5.1 COMPOSITE TEXTILES IN HIGH-PERFORMANCE APPAREL
    5.6 USE CASE ANALYSIS
           5.6.1 USE CASE: ENHANCED COMFORT DURING COMBAT
                    TABLE 3 PROBLEMS ASSOCIATED WITH ACTIONS DURING COMBAT
    5.7 VALUE CHAIN ANALYSIS OF BALLISTIC PROTECTION MARKET
           FIGURE 22 VALUE CHAIN ANALYSIS
    5.8 PORTER’S FIVE FORCES ANALYSIS
           TABLE 4 MARKET: PORTER’S FIVE FORCES ANALYSIS
           FIGURE 23 BALLISTIC PROTECTION MARKET: PORTER’S FIVE FORCES ANALYSIS
           5.8.1 THREAT OF NEW ENTRANTS
           5.8.2 THREAT OF SUBSTITUTES
           5.8.3 BARGAINING POWER OF SUPPLIERS
           5.8.4 BARGAINING POWER OF BUYERS
           5.8.5 INTENSITY OF COMPETITIVE RIVALRY
    5.9 KEY STAKEHOLDERS & BUYING CRITERIA
           5.9.1 KEY STAKEHOLDERS IN BUYING PROCESS
                    FIGURE 24 INFLUENCE OF STAKEHOLDERS ON BUYING PROCESS FOR TOP TWO APPLICATIONS
                    TABLE 5 INFLUENCE OF STAKEHOLDERS ON BUYING PROCESS FOR TOP TWO APPLICATIONS (%)
           5.9.2 BUYING CRITERIA
                    FIGURE 25 KEY BUYING CRITERIA FOR TOP TWO APPLICATIONS
                    TABLE 6 KEY BUYING CRITERIA FOR TOP TWO APPLICATIONS
    5.10 TARIFF AND REGULATORY LANDSCAPE
           5.10.1 REGULATORY BODIES, GOVERNMENT AGENCIES, AND OTHER ORGANIZATIONS
                     TABLE 7 NORTH AMERICA: REGULATORY BODIES, GOVERNMENT AGENCIES, AND OTHER ORGANIZATIONS
                     TABLE 8 EUROPE: REGULATORY BODIES, GOVERNMENT AGENCIES, AND OTHER ORGANIZATIONS
                     TABLE 9 ASIA PACIFIC: REGULATORY BODIES, GOVERNMENT AGENCIES, AND OTHER ORGANIZATIONS
                     TABLE 10 MIDDLE EAST & AFRICA: REGULATORY BODIES, GOVERNMENT AGENCIES, AND OTHER ORGANIZATIONS
                     TABLE 11 LATIN AMERICA: REGULATORY BODIES, GOVERNMENT AGENCIES, AND OTHER ORGANIZATIONS
    5.11 BALLISTIC PROTECTION MARKET: TRADE DATA
           TABLE 12 COUNTRY-WISE IMPORTS, 2020-2021 (USD THOUSAND)
           TABLE 13 COUNTRY-WISE EXPORTS, 2020-2021 (USD THOUSAND)
    5.12 KEY CONFERENCES & EVENTS IN 2022–2023
           TABLE 14 BALLISTIC PROTECTION MARKET: CONFERENCES & EVENTS
 
6 INDUSTRY TRENDS (Page No. - 79)
    6.1 INTRODUCTION
    6.2 ADVANCED MATERIALS FOR BALLISTIC PROTECTION
           6.2.1 ELECTRONIC TEXTILES
           6.2.2 ELECTRIC ARMOR
    6.3 TECHNOLOGY TRENDS
           6.3.1 DOUBLE-SIDED COMBAT UNIFORM FABRIC
           6.3.2 DEFCON ARMOR TECHNOLOGY
           6.3.3 MODULAR BALLISTIC PROTECTION SYSTEMS
           6.3.4 ADVANCED CERAMIC BALLISTIC ARMOR
           6.3.5 DYNEEMA FORCE MULTIPLIER TECHNOLOGY
           6.3.6 IMPROVED OUTER TACTICAL VESTS
           6.3.7 LIQUID ARMOR
           6.3.8 SMART FLUID
           6.3.9 REACTIVE ARMOR TECHNOLOGY
           6.3.10 SENSOR TECHNOLOGY
           6.3.11 NEXT-GEN SUITS
    6.4 BALLISTIC PROTECTION MARKET: SUPPLY CHAIN ANALYSIS
           FIGURE 26 SUPPLY CHAIN ANALYSIS
    6.5 BALLISTIC PROTECTION MARKET: PATENT ANALYSIS
           TABLE 15 PATENT ANALYSIS (2019–2022)
 
7 BALLISTIC PROTECTION MARKET, BY PLATFORM (Page No. - 86)
    7.1 INTRODUCTION
           FIGURE 27 BALLISTIC PROTECTION MARKET, BY PLATFORM, 2022 & 2027
           TABLE 16 MARKET, BY PLATFORM, 2018–2021 (USD MILLION)
           TABLE 17 MARKET, BY PLATFORM, 2022–2027 (USD MILLION)
    7.2 LAND
           7.2.1 COMBAT ARMORED VEHICLES
                    7.2.1.1 Main battle tanks
                               7.2.1.1.1 Increasing offensive cross-country operations
                    7.2.1.2 Infantry fighting vehicles
                               7.2.1.2.1 Procurement by emerging economies
                    7.2.1.3 Armored personnel carriers
                               7.2.1.3.1 Increasing demand to counter terrorist attacks and asymmetric warfare
                    7.2.1.4 Armored amphibious vehicles
                               7.2.1.4.1 Used by military forces for amphibious operations
                    7.2.1.5 Mine-resistant ambush protected
                               7.2.1.5.1 Increasing use for protection from IEDs and mines
                    7.2.1.6 Light armored vehicles
                               7.2.1.6.1 Uses for border patrol and ISR
                    7.2.1.7 Self-propelled howitzers
                               7.2.1.7.1 Easy maneuverability boosts demand
                    7.2.1.8 Air defense vehicles
                               7.2.1.8.1 Adoption of vehicle-mounted anti-aircraft guns
                    7.2.1.9 Armored mortar carriers
                               7.2.1.9.1 High demand for integrated armored vehicles with dedicated mortar storage compartment
           7.2.2 COMBAT SUPPORT VEHICLES
                    7.2.2.1 Armored supply trucks
                               7.2.2.1.1 Increasing use for fuel and ammunition supply to troops
                    7.2.2.2 Armored fuel trucks
                               7.2.2.2.1 Used to transport fuel to forward arming and refueling points
                    7.2.2.3 Armored ammunition replenishment vehicles
                               7.2.2.3.1 Used at forward bases during warfare operations
                    7.2.2.4 Armored ambulances
                               7.2.2.4.1 Vital to transport injured personnel to medical facilities
                    7.2.2.5 Armored command and control vehicles
                               7.2.2.5.1 Increasing adoption for mobile armored operations
                    7.2.2.6 Repair and recovery vehicles
                               7.2.2.6.1 High demand for towing or repair of combat vehicles
           7.2.3 UNMANNED ARMORED GROUND VEHICLES
                    7.2.3.1 Increasing research & development on UGVs for warfare
           7.2.4 SOLDIERS & SECURITY PERSONNEL
                    7.2.4.1 Wide-scale use of personal protective equipment
           7.2.5 BASE STATIONS
                    7.2.5.1 Stations used for shelter and storage by military
    7.3 AIRBORNE
           7.3.1 FIXED-WING AIRCRAFT
                    7.3.1.1 Upcoming defense programs to drive segment
                    7.3.1.2 Fighter aircraft
                    7.3.1.3 Transport aircraft
                    7.3.1.4 Reconnaissance & surveillance aircraft
           7.3.2 HELICOPTERS
                    7.3.2.1 Provide accessibility for special missions
                    7.3.2.2 Attack & reconnaissance helicopters
                    7.3.2.3 Special mission helicopters
                    7.3.2.4 Maritime helicopters
                    7.3.2.5 Transport helicopters
           7.3.3 UNMANNED AERIAL VEHICLES (UAV)
                    7.3.3.1 High number of ISR missions drives demand
    7.4 MARINE
           7.4.1 DESTROYERS
                    7.4.1.1 Fast, long-lasting, maneuverable ships
           7.4.2 FRIGATES
                    7.4.2.1 Used to protect other warships and merchant ships
           7.4.3 CORVETTES
                    7.4.3.1 Smallest vessel class among warships
           7.4.4 OFFSHORE SUPPORT VESSELS (OSVS)
                    7.4.4.1 Small patrol vessels used for coastal defense
           7.4.5 AIRCRAFT CARRIERS
                    7.4.5.1 Possibility of using hybrid propulsion for aircraft carriers
           7.4.6 SUBMARINES
                    7.4.6.1 US, France, and India – currently using or developing electric propulsion systems
           7.4.7 UNMANNED SURFACE VEHICLES
                    7.4.7.1 Used in military applications for seaborne targets
 
8 BALLISTIC PROTECTION MARKET, BY APPLICATION (Page No. - 98)
    8.1 INTRODUCTION
           FIGURE 28 BALLISTIC PROTECTION MARKET, BY APPLICATION, 2022 & 2027 (USD MILLION)
           TABLE 18 MARKET, BY APPLICATION, 2018–2021 (USD MILLION)
           TABLE 19 MARKET, BY APPLICATION, 2022–2027 (USD MILLION)
    8.2 MILITARY
           8.2.1 HIGH LEVEL OF THREAT DEMANDS HIGHER PROTECTION
    8.3 HOMELAND SECURITY
           8.3.1 PARAMILITARY FORCES
                    8.3.1.1 Semi-militarized forces for domestic tactical missions
           8.3.2 POLICE FORCES
                    8.3.2.1 Wide-scale use of body vests and helmets
           8.3.3 SPECIAL FORCES
                    8.3.3.1 Security units for special operations
 
9 BALLISTIC PROTECTION MARKET, BY TECHNOLOGY (Page No. - 102)
    9.1 INTRODUCTION
           FIGURE 29 MARKET, BY TECHNOLOGY, 2022 & 2027
           TABLE 20 MARKET, BY TECHNOLOGY, 2018–2021 (USD MILLION)
           TABLE 21 MARKET, BY TECHNOLOGY, 2022–2027 (USD MILLION)
    9.2 HARD ARMOR
           9.2.1 USED IN HIGH-RISK-OF-ATTACK SCENARIOS
           9.2.2 LAND
           9.2.3 AIRBORNE
           9.2.4 MARINE
    9.3 SOFT ARMOR
           9.3.1 DEMAND DRIVEN BY NEED FOR LIGHTWEIGHT BODY ARMOR
           9.3.2 LAND
           9.3.3 AIRBORNE
           9.3.4 MARINE
 
10 BALLISTIC PROTECTION MARKET, BY MATERIAL (Page No. - 106)
     10.1 INTRODUCTION
             FIGURE 30 MARKET, BY MATERIAL, 2022 & 2027
             TABLE 22 MARKET, BY MATERIAL, 2018–2021 (USD MILLION)
             TABLE 23 MARKET, BY MATERIAL, 2022–2027 (USD MILLION)
     10.2 METALS & ALLOYS
             10.2.1 HIGH-DENSITY STEEL
                        10.2.1.1 Protects armored vehicles from different ballistic threats
             10.2.2 ALUMINUM
                        10.2.2.1 Lightweight property makes it ideal for military applications
             10.2.3 TITANIUM
                        10.2.3.1 Superior material for combat systems
     10.3 CERAMICS
             10.3.1 ALUMINUM OXIDE
                        10.3.1.1 Contributes to enhancement of body armor
             10.3.2 SILICON CARBIDE
                        10.3.2.1 Effective material against bullets
     10.4 COMPOSITES
             10.4.1 ARAMID COMPOSITES
                        10.4.1.1 Used in aerospace and military applications
                        10.4.1.2 Para-aramid
                        10.4.1.3 Meta-aramid
             10.4.2 CARBON COMPOSITES
                        10.4.2.1 Suitable for aerospace structure applications
             10.4.3 HYBRID COMPOSITES
                        10.4.3.1 Incorporate natural and synthetic fibers
             10.4.4 3D COMPOSITES
                        10.4.4.1 Used to manufacture wing-to-spar joints in aircraft
     10.5 BULLETPROOF GLASS
             10.5.1 ACRYLIC
                        10.5.1.1 Used in bullet-resistant systems for ballistic panels
             10.5.2 POLYCARBONATE
                        10.5.2.1 Provides protection against multiple-shot penetration
     10.6 FABRIC
             10.6.1 OFFERS PROTECTION AGAINST PROJECTILE IMPACT
             10.6.2 ORGANIC COTTON
                        10.6.2.1 Can be used to make protective apparel
             10.6.3 SYNTHETIC NYLON & POLYESTER
                        10.6.3.1 Used in multilayered armor systems
 
11 BALLISTIC PROTECTION MARKET, BY PRODUCT (Page No. - 113)
     11.1 INTRODUCTION
             FIGURE 31 BALLISTIC PROTECTION MARKET, BY PRODUCT, 2022 & 2027
             TABLE 24 MARKET, BY PRODUCT, 2018–2021 (USD MILLION)
             TABLE 25 MARKET, BY PRODUCT, 2022–2027 (USD MILLION)
     11.2 PERSONAL PROTECTIVE EQUIPMENT
             11.2.1 BODY ARMOR CLOTHING
                        11.2.1.1 NBC SUITS & THERMAL CAMOUFLAGE SUITS
                                     11.2.1.1.1 Designed to protect against chemical, biological, or radioactive contamination
                        11.2.1.2 IMMERSION SUITS
                                     11.2.1.2.1 Used to remain afloat and for protection against hazards in water
                        11.2.1.3 ADVANCED BALLISTIC SUITS
                                     11.2.1.3.1 Increasing demand for cooling system ballistic suits
             11.2.2 BALLISTIC HELMETS
                        11.2.2.1 Advanced ballistic helmets
                        11.2.2.2 HUD/HMD helmets
             11.2.3 VESTS
                        11.2.3.1 Interceptor Body Armor (IBA)
                        11.2.3.2 Interim Small Arms Protective Overvest (ISAPO)
                        11.2.3.3 Personnel Armor Systems for Ground Troops (PASGT)
                        11.2.3.4 Ranger Body Armor (RBA)
                        11.2.3.5 Survival Vests
             11.2.4 BALLISTIC BOOTS
                        11.2.4.1 Provide stability to feet in rugged terrain
             11.2.5 BALLISTIC GLOVES
                        11.2.5.1 Effectively disguise wearer across conditions
     11.3 BALLISTIC CONTAINERS & PORTABLE SHELTERS
             11.3.1 KEY DEMAND DRIVERS – LOW WEIGHT, FLEXIBILITY, AND STATIC STRENGTH
     11.4 BALLISTIC BLOCKS
             11.4.1 CAN BE INSTALLED INDOORS AND OUTDOORS
     11.5 BALLISTIC BARRIER SYSTEMS
             11.5.1 CAN WITHSTAND IMPACT OF .50 CALIBER BMG APIT AMMUNITION
     11.6 HULL & BODY
             11.6.1 PROVIDE PROTECTION ON MARINE PLATFORMS
     11.7 WEAPON STATIONS & OPTRONICS
             11.7.1 USED TO PROTECT OPTRONIC DEVICES AGAINST LEVEL III AND IV BALLISTIC THREATS
     11.8 FUEL DROP TANKS & AMMUNITION STORAGE
             11.8.1 HIGH LEVEL OF BALLISTIC PROTECTION REQUIRED
     11.9 COCKPIT BALLISTIC PROTECTION
             11.9.1 PROVIDES PROTECTION FROM SMALL ARMS FIRE
     11.10 PILOT SEAT PROTECTION
             11.10.1 PROTECT AGAINST BALLISTIC FRAGMENTS AND EXPLOSIVE ELEMENTS
     11.11 BALLISTIC FLOORS
             11.11.1 PROVIDE ACOUSTIC INSULATION AND SUPERIOR DURABILITY
     11.12 BALLISTIC WINDOWS
             11.12.1 ACCOMMODATE A RANGE OF PROTECTION LEVELS
     11.13 BALLISTIC DOORS
             11.13.1 MADE OF BULLET-RESISTANT STEEL AND HEAVY-DUTY HARDWARE
     11.14 ENGINE PROTECTION
             11.14.1 CONSISTS OF BALLISTIC-RESISTANT LIGHTWEIGHT MATERIALS
 
12 BALLISTIC PROTECTION MARKET, BY THREAT LEVEL (Page No. - 122)
     12.1 INTRODUCTION
             FIGURE 32 BALLISTIC PROTECTION MARKET, BY THREAT LEVEL, 2022 & 2027
             TABLE 26 MARKET, BY THREAT LEVEL, 2018–2021 (USD MILLION)
             TABLE 27 MARKET, BY THREAT LEVEL, 2022–2027 (USD MILLION)
     12.2 LEVEL II & LEVEL IIA
             12.2.1 COVERT-STYLE BODY ARMOR
     12.3 LEVEL III & LEVEL IIIA
             12.3.1 LEVEL IIIA – HIGHEST THREAT LEVEL IN SOFT ARMOR
     12.4 LEVEL IV & ABOVE
             12.4.1 CAN STOP BULLETS FROM RIFLES AND SUBMACHINE GUNS
 
13 REGIONAL ANALYSIS (Page No. - 126)
     13.1 INTRODUCTION
             FIGURE 33 ASIA PACIFIC DOMINATES BALLISTIC PROTECTION MARKET IN 2022
             TABLE 28 MARKET, BY REGION, 2018–2021 (USD MILLION)
             TABLE 29 MARKET, BY REGION, 2022–2027 (USD MILLION)
     13.2 NORTH AMERICA
             FIGURE 34 NORTH AMERICA: BALLISTIC PROTECTION MARKET SNAPSHOT
             TABLE 30 NORTH AMERICA: MARKET, BY PLATFORM, 2018–2021 (USD MILLION)
             TABLE 31 NORTH AMERICA: MARKET, BY PLATFORM, 2022–2027 (USD MILLION)
             TABLE 32 NORTH AMERICA: MARKET, BY APPLICATION, 2018–2021 (USD MILLION)
             TABLE 33 NORTH AMERICA: MARKET, BY APPLICATION, 2022–2027 (USD MILLION)
             TABLE 34 NORTH AMERICA: MARKET, BY TECHNOLOGY, 2018–2021 (USD MILLION)
             TABLE 35 NORTH AMERICA: MARKET, BY TECHNOLOGY, 2022–2027 (USD MILLION)
             TABLE 36 NORTH AMERICA: MARKET, BY MATERIAL, 2018–2021 (USD MILLION)
             TABLE 37 NORTH AMERICA: MARKET, BY MATERIAL, 2022–2027 (USD MILLION)
             TABLE 38 NORTH AMERICA: MARKET, BY PRODUCT, 2018–2021 (USD MILLION)
             TABLE 39 NORTH AMERICA: MARKET, BY PRODUCT, 2022–2027 (USD MILLION)
             TABLE 40 NORTH AMERICA: MARKET, BY THREAT LEVEL, 2018–2021 (USD MILLION)
             TABLE 41 NORTH AMERICA: MARKET, BY THREAT LEVEL, 2022–2027 (USD MILLION)
             TABLE 42 NORTH AMERICA: MARKET, BY COUNTRY, 2018–2021 (USD MILLION)
             TABLE 43 NORTH AMERICA: MARKET, BY COUNTRY, 2022–2027 (USD MILLION)
             13.2.1 US
                        13.2.1.1 Increased procurement of armored vehicles
                                     TABLE 44 US: BALLISTIC PROTECTION MARKET, BY PLATFORM, 2018–2021 (USD MILLION)
                                     TABLE 45 US: MARKET, BY PLATFORM, 2022–2027 (USD MILLION)
                                     TABLE 46 US: MARKET, BY APPLICATION, 2018–2021 (USD MILLION)
                                     TABLE 47 US: MARKET, BY APPLICATION, 2022–2027 (USD MILLION)
                                     TABLE 48 US: MARKET, BY TECHNOLOGY, 2018–2021 (USD MILLION)
                                     TABLE 49 US: MARKET, BY TECHNOLOGY, 2022–2027 (USD MILLION)
             13.2.2 CANADA
                        13.2.2.1 Commercialization of advanced materials
                                     TABLE 50 CANADA: MARKET, BY PLATFORM, 2018–2021 (USD MILLION)
                                     TABLE 51 CANADA: MARKET, BY PLATFORM, 2022–2027 (USD MILLION)
                                     TABLE 52 CANADA: MARKET, BY APPLICATION, 2018–2021 (USD MILLION)
                                     TABLE 53 CANADA: MARKET, BY APPLICATION, 2022–2027 (USD MILLION)
                                     TABLE 54 CANADA: MARKET, BY TECHNOLOGY, 2018–2021 (USD MILLION)
                                     TABLE 55 CANADA: BALLISTIC PROTECTION MARKET, BY TECHNOLOGY, 2022–2027 (USD MILLION)
     13.3 EUROPE
             FIGURE 35 EUROPE: BALLISTIC PROTECTION MARKET SNAPSHOT
             TABLE 56 EUROPE: MARKET, BY COUNTRY, 2018–2021 (USD MILLION)
             TABLE 57 EUROPE: MARKET, BY COUNTRY, 2022–2027 (USD MILLION)
             TABLE 58 EUROPE: MARKET, BY PLATFORM, 2018–2021 (USD MILLION)
             TABLE 59 EUROPE: MARKET, BY PLATFORM, 2022–2027 (USD MILLION)
             TABLE 60 EUROPE: MARKET, BY APPLICATION, 2018–2021 (USD MILLION)
             TABLE 61 EUROPE: MARKET, BY APPLICATION, 2022–2027 (USD MILLION)
             TABLE 62 EUROPE: MARKET, BY TECHNOLOGY, 2018–2021 (USD MILLION)
             TABLE 63 EUROPE: MARKET, BY TECHNOLOGY, 2022–2027 (USD MILLION)
             TABLE 64 EUROPE: MARKET, BY MATERIAL, 2018–2021 (USD MILLION)
             TABLE 65 EUROPE: MARKET, BY MATERIAL, 2022–2027 (USD MILLION)
             TABLE 66 EUROPE: MARKET, BY THREAT LEVEL, 2018–2021 (USD MILLION)
             TABLE 67 EUROPE: MARKET, BY THREAT LEVEL, 2022–2027 (USD MILLION)
             TABLE 68 EUROPE: MARKET, BY PRODUCT, 2018–2021 (USD MILLION)
             TABLE 69 EUROPE: MARKET, BY PRODUCT, 2022–2027 (USD MILLION)
             13.3.1 UK
                        13.3.1.1 Rising investments in ballistic protection systems
                                     TABLE 70 UK: BALLISTIC PROTECTION MARKET, BY PLATFORM, 2018–2021 (USD MILLION)
                                     TABLE 71 UK: MARKET, BY PLATFORM, 2022–2027 (USD MILLION)
                                     TABLE 72 UK: MARKET, BY APPLICATION, 2018–2021 (USD MILLION)
                                     TABLE 73 UK: MARKET, BY APPLICATION, 2022–2027 (USD MILLION)
                                     TABLE 74 UK: MARKET, BY TECHNOLOGY, 2018–2021 (USD MILLION)
                                     TABLE 75 UK: MARKET, BY TECHNOLOGY, 2022–2027 (USD MILLION)
             13.3.2 FRANCE
                        13.3.2.1 Military modernization programs
                                     TABLE 76 FRANCE: BALLISTIC PROTECTION MARKET, BY PLATFORM, 2018–2021 (USD MILLION)
                                     TABLE 77 FRANCE: MARKET, BY PLATFORM, 2022–2027 (USD MILLION)
                                     TABLE 78 FRANCE: MARKET, BY APPLICATION, 2018–2021 (USD MILLION)
                                     TABLE 79 FRANCE: MARKET, BY APPLICATION, 2022–2027 (USD MILLION)
                                     TABLE 80 FRANCE: MARKET, BY TECHNOLOGY, 2018–2021 (USD MILLION)
                                     TABLE 81 FRANCE: MARKET, BY TECHNOLOGY, 2022–2027 (USD MILLION)
             13.3.3 RUSSIA
                        13.3.3.1 Developing mock-ups of new helmets and complete body armor
                                     TABLE 82 RUSSIA: BALLISTIC PROTECTION MARKET, BY PLATFORM, 2018–2021 (USD MILLION)
                                     TABLE 83 RUSSIA: MARKET, BY PLATFORM, 2022–2027 (USD MILLION)
                                     TABLE 84 RUSSIA: MARKET, BY APPLICATION, 2018–2021 (USD MILLION)
                                     TABLE 85 RUSSIA: MARKET, BY APPLICATION, 2022–2027 (USD MILLION)
                                     TABLE 86 RUSSIA: MARKET, BY TECHNOLOGY, 2018–2021 (USD MILLION)
                                     TABLE 87 RUSSIA: MARKET, BY TECHNOLOGY, 2022–2027 (USD MILLION)
             13.3.4 ITALY
                        13.3.4.1 Second-largest consumer of ballistic protection systems in Europe
                                     TABLE 88 ITALY: BALLISTIC PROTECTION MARKET, BY PLATFORM, 2018–2021 (USD MILLION)
                                     TABLE 89 ITALY: MARKET, BY PLATFORM, 2022–2027 (USD MILLION)
                                     TABLE 90 ITALY: MARKET, BY APPLICATION, 2018–2021 (USD MILLION)
                                     TABLE 91 ITALY: MARKET, BY APPLICATION, 2022–2027 (USD MILLION)
                                     TABLE 92 ITALY: MARKET, BY TECHNOLOGY, 2018–2021 (USD MILLION)
                                     TABLE 93 ITALY: MARKET, BY TECHNOLOGY, 2022–2027 (USD MILLION)
             13.3.5 REST OF EUROPE
                        13.3.5.1 Increase in demand for armored combat equipment
                                     TABLE 94 REST OF EUROPE: BALLISTIC PROTECTION MARKET, BY PLATFORM, 2018–2021 (USD MILLION)
                                     TABLE 95 REST OF EUROPE: MARKET, BY PLATFORM, 2022–2027 (USD MILLION)
                                     TABLE 96 REST OF EUROPE: MARKET, BY APPLICATION, 2018–2021 (USD MILLION)
                                     TABLE 97 REST OF EUROPE: MARKET, BY APPLICATION, 2022–2027 (USD MILLION)
                                     TABLE 98 REST OF EUROPE: MARKET, BY TECHNOLOGY, 2018–2021 (USD MILLION)
                                     TABLE 99 REST OF EUROPE: MARKET, BY TECHNOLOGY, 2022–2027 (USD MILLION)
     13.4 ASIA PACIFIC
             FIGURE 36 ASIA PACIFIC: BALLISTIC PROTECTION MARKET SNAPSHOT
             TABLE 100 ASIA PACIFIC: MARKET, BY COUNTRY, 2018–2021 (USD MILLION)
             TABLE 101 ASIA PACIFIC: MARKET, BY COUNTRY, 2022–2027 (USD MILLION)
             TABLE 102 ASIA PACIFIC: MARKET, BY PLATFORM, 2018–2021 (USD MILLION)
             TABLE 103 ASIA PACIFIC: MARKET, BY PLATFORM, 2022–2027 (USD MILLION)
             TABLE 104 ASIA PACIFIC: MARKET, BY APPLICATION, 2018–2021 (USD MILLION)
             TABLE 105 ASIA PACIFIC: MARKET, BY APPLICATION, 2022–2027 (USD MILLION)
             TABLE 106 ASIA PACIFIC: MARKET, BY MATERIAL, 2018–2021 (USD MILLION)
             TABLE 107 ASIA PACIFIC: MARKET, BY MATERIAL, 2022–2027 (USD MILLION)
             TABLE 108 ASIA PACIFIC: MARKET, BY TECHNOLOGY, 2018–2021 (USD MILLION)
             TABLE 109 ASIA PACIFIC: MARKET, BY TECHNOLOGY, 2022–2027 (USD MILLION)
             TABLE 110 ASIA PACIFIC: MARKET, BY THREAT LEVEL, 2018–2021 (USD MILLION)
             TABLE 111 ASIA PACIFIC: MARKET, BY THREAT LEVEL, 2022–2027 (USD MILLION)
             TABLE 112 ASIA PACIFIC: MARKET, BY PRODUCT, 2018–2021 (USD MILLION)
             TABLE 113 ASIA PACIFIC: MARKET, BY PRODUCT, 2022–2027 (USD MILLION)
             13.4.1 CHINA
                        13.4.1.1 Increased defense spending
                                     TABLE 114 CHINA: BALLISTIC PROTECTION MARKET, BY PLATFORM, 2018–2021 (USD MILLION)
                                     TABLE 115 CHINA: MARKET, BY PLATFORM, 2022–2027 (USD MILLION)
                                     TABLE 116 CHINA: MARKET, BY APPLICATION, 2018–2021 (USD MILLION)
                                     TABLE 117 CHINA: MARKET, BY APPLICATION, 2022–2027 (USD MILLION)
                                     TABLE 118 CHINA: MARKET, BY TECHNOLOGY, 2018–2021 (USD MILLION)
                                     TABLE 119 CHINA: MARKET, BY TECHNOLOGY, 2022–2027 (USD MILLION)
             13.4.2 INDIA
                        13.4.2.1 Conflicts with Pakistan and China drive demand
                                     TABLE 120 INDIA: BALLISTIC PROTECTION MARKET, BY PLATFORM, 2018–2021 (USD MILLION)
                                     TABLE 121 INDIA: MARKET, BY PLATFORM, 2022–2027 (USD MILLION)
                                     TABLE 122 INDIA: MARKET, BY APPLICATION, 2018–2021 (USD MILLION)
                                     TABLE 123 INDIA: MARKET, BY APPLICATION, 2022–2027 (USD MILLION)
                                     TABLE 124 INDIA: MARKET, BY TECHNOLOGY, 2018–2021 (USD MILLION)
                                     TABLE 125 INDIA: MARKET, BY TECHNOLOGY, 2022–2027 (USD MILLION)
             13.4.3 JAPAN
                        13.4.3.1 Need for increased security in East Asia
                                     TABLE 126 JAPAN: BALLISTIC PROTECTION MARKET, BY PLATFORM, 2018–2021 (USD MILLION)
                                     TABLE 127 JAPAN: MARKET, BY PLATFORM, 2022–2027 (USD MILLION)
                                     TABLE 128 JAPAN: MARKET, BY APPLICATION, 2018–2021 (USD MILLION)
                                     TABLE 129 JAPAN: MARKET, BY APPLICATION, 2022–2027 (USD MILLION)
                                     TABLE 130 JAPAN: MARKET, BY TECHNOLOGY, 2018–2021 (USD MILLION)
                                     TABLE 131 JAPAN: MARKET, BY TECHNOLOGY, 2022–2027 (USD MILLION)
             13.4.4 SOUTH KOREA
                        13.4.4.1 Modernization programs by defense forces
                                     TABLE 132 SOUTH KOREA: BALLISTIC PROTECTION MARKET, BY PLATFORM, 2018–2021 (USD MILLION)
                                     TABLE 133 SOUTH KOREA: MARKET, BY PLATFORM, 2022–2027 (USD MILLION)
                                     TABLE 134 SOUTH KOREA: MARKET, BY APPLICATION, 2018–2021 (USD MILLION)
                                     TABLE 135 SOUTH KOREA: MARKET, BY APPLICATION, 2022–2027 (USD MILLION)
                                     TABLE 136 SOUTH KOREA: MARKET, BY TECHNOLOGY, 2018–2021 (USD MILLION)
                                     TABLE 137 SOUTH KOREA: MARKET, BY TECHNOLOGY, 2022–2027 (USD MILLION)
             13.4.5 REST OF ASIA PACIFIC
                        13.4.5.1 Demand driven by increasing use of IEDs and other explosives
                                     TABLE 138 REST OF ASIA PACIFIC: BALLISTIC PROTECTION MARKET, BY PLATFORM, 2018–2021 (USD MILLION)
                                     TABLE 139 REST OF ASIA PACIFIC: MARKET, BY PLATFORM, 2022–2027 (USD MILLION)
                                     TABLE 140 REST OF ASIA PACIFIC: MARKET, BY APPLICATION, 2018–2021 (USD MILLION)
                                     TABLE 141 REST OF ASIA PACIFIC: MARKET, BY APPLICATION, 2022–2027 (USD MILLION)
                                     TABLE 142 REST OF ASIA PACIFIC: MARKET, BY TECHNOLOGY, 2018–2021 (USD MILLION)
                                     TABLE 143 REST OF ASIA PACIFIC: MARKET, BY TECHNOLOGY, 2022–2027 (USD MILLION)
     13.5 MIDDLE EAST
             FIGURE 37 MIDDLE EAST: BALLISTIC PROTECTION MARKET SNAPSHOT
             TABLE 144 MIDDLE EAST: MARKET, BY COUNTRY, 2018–2021 (USD MILLION)
             TABLE 145 MIDDLE EAST: MARKET, BY COUNTRY, 2022–2027 (USD MILLION)
             TABLE 146 MIDDLE EAST: MARKET, BY PLATFORM, 2018–2021 (USD MILLION)
             TABLE 147 MIDDLE EAST: MARKET, BY PLATFORM, 2022–2027 (USD MILLION)
             TABLE 148 MIDDLE EAST: MARKET, BY APPLICATION, 2018–2021 (USD MILLION)
             TABLE 149 MIDDLE EAST: MARKET, BY APPLICATION, 2022–2027 (USD MILLION)
             TABLE 150 MIDDLE EAST: MARKET, BY MATERIAL, 2018–2021 (USD MILLION)
             TABLE 151 MIDDLE EAST: MARKET, BY MATERIAL, 2022–2027 (USD MILLION)
             TABLE 152 MIDDLE EAST: MARKET, BY TECHNOLOGY, 2018–2021 (USD MILLION)
             TABLE 153 MIDDLE EAST: MARKET, BY TECHNOLOGY, 2022–2027 (USD MILLION)
             TABLE 154 MIDDLE EAST: MARKET, BY THREAT LEVEL, 2018–2021 (USD MILLION)
             TABLE 155 MIDDLE EAST: MARKET, BY THREAT LEVEL, 2022–2027 (USD MILLION)
             TABLE 156 MIDDLE EAST: MARKET, BY PRODUCT, 2018–2021 (USD MILLION)
             TABLE 157 MIDDLE EAST: MARKET, BY PRODUCT, 2022–2027 (USD MILLION)
             13.5.1 UAE
                        13.5.1.1 Increasing collaborations for armored vehicles
                                     TABLE 158 UAE: BALLISTIC PROTECTION MARKET, BY PLATFORM, 2018–2021 (USD MILLION)
                                     TABLE 159 UAE: MARKET, BY PLATFORM, 2022–2027 (USD MILLION)
                                     TABLE 160 UAE: MARKET, BY APPLICATION, 2018–2021 (USD MILLION)
                                     TABLE 161 UAE: MARKET, BY APPLICATION, 2022–2027 (USD MILLION)
                                     TABLE 162 UAE: MARKET, BY TECHNOLOGY, 2018–2021 (USD MILLION)
                                     TABLE 163 UAE: MARKET, BY TECHNOLOGY, 2022–2027 (USD MILLION)
             13.5.2 SAUDI ARABIA
                        13.5.2.1 Rising procurement of armored vehicles
                                     TABLE 164 SAUDI ARABIA: BALLISTIC PROTECTION MARKET, BY PLATFORM, 2018–2021 (USD MILLION)
                                     TABLE 165 SAUDI ARABIA: MARKET, BY PLATFORM, 2022–2027 (USD MILLION)
                                     TABLE 166 SAUDI ARABIA: MARKET, BY APPLICATION, 2018–2021 (USD MILLION)
                                     TABLE 167 SAUDI ARABIA: MARKET, BY APPLICATION, 2022–2027 (USD MILLION)
                                     TABLE 168 SAUDI ARABIA: MARKET, BY TECHNOLOGY, 2018–2021 (USD MILLION)
                                     TABLE 169 SAUDI ARABIA: MARKET, BY TECHNOLOGY, 2022–2027 (USD MILLION)
             13.5.3 ISRAEL
                        13.5.3.1 Increasing investment in ballistic technology
                                     TABLE 170 ISRAEL: BALLISTIC PROTECTION MARKET, BY PLATFORM, 2018–2021 (USD MILLION)
                                     TABLE 171 ISRAEL: MARKET, BY PLATFORM, 2022–2027 (USD MILLION)
                                     TABLE 172 ISRAEL: MARKET, BY APPLICATION, 2018–2021 (USD MILLION)
                                     TABLE 173 ISRAEL: MARKET, BY APPLICATION, 2022–2027 (USD MILLION)
                                     TABLE 174 ISRAEL: MARKET, BY TECHNOLOGY, 2018–2021 (USD MILLION)
                                     TABLE 175 ISRAEL: MARKET, BY TECHNOLOGY, 2022–2027 (USD MILLION)
     13.6 AFRICA
             FIGURE 38 AFRICA: BALLISTIC PROTECTION MARKET SNAPSHOT
             TABLE 176 AFRICA: MARKET, BY PLATFORM, 2018–2021 (USD MILLION)
             TABLE 177 AFRICA: MARKET, BY PLATFORM, 2022–2027 (USD MILLION)
             TABLE 178 AFRICA: MARKET, BY APPLICATION, 2018–2021 (USD MILLION)
             TABLE 179 AFRICA: MARKET, BY APPLICATION, 2022–2027 (USD MILLION)
             TABLE 180 AFRICA: MARKET, BY TECHNOLOGY, 2018–2021 (USD MILLION)
             TABLE 181 AFRICA: MARKET, BY TECHNOLOGY, 2022–2027 (USD MILLION)
             TABLE 182 AFRICA: MARKET, BY MATERIAL, 2018–2021 (USD MILLION)
             TABLE 183 AFRICA: MARKET, BY MATERIAL, 2022–2027 (USD MILLION)
             TABLE 184 AFRICA: MARKET, BY PRODUCT, 2018–2021 (USD MILLION)
             TABLE 185 AFRICA: MARKET, BY PRODUCT, 2022–2027 (USD MILLION)
             TABLE 186 AFRICA: MARKET, BY THREAT LEVEL, 2018–2021 (USD MILLION)
             TABLE 187 AFRICA: MARKET, BY THREAT LEVEL, 2022–2027 (USD MILLION)
     13.7 LATIN AMERICA
             FIGURE 39 LATIN AMERICA: BALLISTIC PROTECTION MARKET SNAPSHOT
             TABLE 188 LATIN AMERICA: MARKET, BY PLATFORM, 2018–2021 (USD MILLION)
             TABLE 189 LATIN AMERICA: MARKET, BY PLATFORM, 2022–2027 (USD MILLION)
             TABLE 190 LATIN AMERICA: MARKET, BY APPLICATION, 2018–2021 (USD MILLION)
             TABLE 191 LATIN AMERICA: MARKET, BY APPLICATION, 2022–2027 (USD MILLION)
             TABLE 192 LATIN AMERICA: MARKET, BY MATERIAL, 2018–2021 (USD MILLION)
             TABLE 193 LATIN AMERICA: MARKET, BY MATERIAL, 2022–2027 (USD MILLION)
             TABLE 194 LATIN AMERICA: MARKET, BY TECHNOLOGY, 2018–2021 (USD MILLION)
             TABLE 195 LATIN AMERICA: MARKET, BY TECHNOLOGY, 2022–2027 (USD MILLION)
             TABLE 196 LATIN AMERICA: MARKET, BY THREAT LEVEL, 2018–2021 (USD MILLION)
             TABLE 197 LATIN AMERICA: MARKET, BY THREAT LEVEL, 2022–2027 (USD MILLION)
             TABLE 198 LATIN AMERICA: MARKET, BY PRODUCT, 2018–2021 (USD MILLION)
             TABLE 199 LATIN AMERICA: MARKET, BY PRODUCT, 2022–2027 (USD MILLION)
 
14 COMPETITIVE LANDSCAPE (Page No. - 183)
     14.1 INTRODUCTION 
             FIGURE 40 CONTRACTS WAS KEY GROWTH STRATEGY BETWEEN 2017 AND 2022
             14.1.1 MARKET EVALUATION FRAMEWORK
                        FIGURE 41 MARKET EVALUATION FRAMEWORK: CONTRACTS TO BE LEADING STRATEGY FOR TOP PLAYERS IN 2022
     14.2 COMPETITIVE LEADERSHIP MAPPING (OVERALL MARKET) 
             14.2.1 VISIONARY LEADERS
             14.2.2 INNOVATORS
             14.2.3 DYNAMIC DIFFERENTIATORS
             14.2.4 EMERGING COMPANIES
     14.3 COMPETITIVE SCENARIO 
             14.3.1 OTHER DEVELOPMENTS
                        TABLE 200 BALLISTIC PROTECTION MARKET: OTHER DEVELOPMENTS, 2017–2022
 
15 COMPANY PROFILES (Page No. - 188)
     15.1 INTRODUCTION 
(Business overview, Products/Solutions/Services offered, Recent Developments, MnM view, Key strengths, Strategic choices, Weaknesses and competitive threats) *  
     15.2 KEY PLAYERS 
             15.2.1 BAE SYSTEMS
                        TABLE 201 BAE SYSTEMS: BUSINESS OVERVIEW
                        FIGURE 42 BAE SYSTEMS: COMPANY SNAPSHOT
                        TABLE 202 BAE SYSTEMS: PRODUCTS/SOLUTIONS/SERVICES OFFERED
                        TABLE 203 BAE SYSTEMS: DEALS
             15.2.2 AVON PROTECTION
                        TABLE 204 AVON PROTECTION: BUSINESS OVERVIEW
                        FIGURE 43 AVON PROTECTION: COMPANY SNAPSHOT
                        TABLE 205 AVON PROTECTION: PRODUCTS/SOLUTIONS/SERVICES OFFERED
                        TABLE 206 AVON PROTECTION: DEALS
             15.2.3 RHEINMETALL AG
                        TABLE 207 RHEINMETALL AG: BUSINESS OVERVIEW
                        FIGURE 44 RHEINMETALL AG: COMPANY SNAPSHOT
                        TABLE 208 RHEINMETALL AG: PRODUCTS/SOLUTIONS/SERVICES OFFERED
                        TABLE 209 RHEINMETALL AG: DEALS
             15.2.4 TENCATE ADVANCED ARMOR
                        TABLE 210 TENCATE ADVANCED ARMOR: BUSINESS OVERVIEW
                        TABLE 211 TENCATE ADVANCED ARMOR: PRODUCTS/SOLUTIONS/SERVICES OFFERED
                        TABLE 212 TENCATE ADVANCED ARMOR: DEALS
             15.2.5 FMS ENTERPRISES MIGUN LTD.
                        TABLE 213 FMS ENTERPRISES MIGUN LTD.: BUSINESS OVERVIEW
                        TABLE 214 FMS ENTERPRISES MIGUN LTD.: PRODUCTS/SOLUTIONS/SERVICES OFFERED
             15.2.6 POINT BLANK ENTERPRISES
                        TABLE 215 POINT BLANK ENTERPRISES: BUSINESS OVERVIEW
                        TABLE 216 POINT BLANK ENTERPRISES: PRODUCTS/SOLUTIONS/SERVICES OFFERED
                        TABLE 217 POINT BLANK ENTERPRISES: DEALS
             15.2.7 SEYNTEX
                        TABLE 218 SEYNTEX: BUSINESS OVERVIEW
                        TABLE 219 SEYNTEX: PRODUCTS/SOLUTIONS/SERVICES OFFERED
                        TABLE 220 SEYNTEX: DEALS
             15.2.8 ADA (AUSTRALIAN DEFENCE APPAREL)
                        TABLE 221 ADA (AUSTRALIAN DEFENCE APPAREL): BUSINESS OVERVIEW
                        TABLE 222 ADA (AUSTRALIAN DEFENCE APPAREL): PRODUCTS/SOLUTIONS/SERVICES OFFERED
                        TABLE 223 ADA (AUSTRALIAN DEFENCE APPAREL): DEALS
             15.2.9 SURVITEC GROUP LIMITED
                        TABLE 224 SURVITEC GROUP LIMITED: BUSINESS OVERVIEW
                        TABLE 225 SURVITEC GROUP LIMITED: PRODUCTS/SOLUTIONS/SERVICES OFFERED
             15.2.10 ARMORWORKS
                        TABLE 226 ARMORWORKS: BUSINESS OVERVIEW
                        TABLE 227 ARMORWORKS: PRODUCTS/SOLUTIONS/SERVICES OFFERED
             15.2.11 REVISION MILITARY
                        TABLE 228 REVISION MILITARY: BUSINESS OVERVIEW
                        TABLE 229 REVISION MILITARY: PRODUCTS/SOLUTIONS/SERVICES OFFERED
                        TABLE 230 REVISION MILITARY: DEALS
             15.2.12 ARMORSOURCE LLC.
                        TABLE 231 ARMORSOURCE LLC.: BUSINESS OVERVIEW
                        TABLE 232 ARMORSOURCE LLC.: PRODUCTS/SOLUTIONS/SERVICES OFFERED
                        TABLE 233 ARMORSOURCE LLC.: DEALS
             15.2.13 SOUTHERN STATES LLC.
                        TABLE 234 SOUTHERN STATES LLC.: BUSINESS OVERVIEW
                        TABLE 235 SOUTHERN STATES LLC. : PRODUCTS/SOLUTIONS/SERVICES OFFERED
             15.2.14 CRAIG INTERNATIONAL BALLISTICS PTY LTD.
                        TABLE 236 CRAIG INTERNATIONAL BALLISTICS PTY LTD.: BUSINESS OVERVIEW
                        TABLE 237 CRAIG INTERNATIONAL BALLISTICS PTY LTD.: PRODUCTS/SOLUTIONS/SERVICES OFFERED
                        TABLE 238 CRAIG INTERNATIONAL BALLISTICS PTY LTD.: DEALS
             15.2.15 PAUL BOYE TECHNOLOGIES
                        TABLE 239 PAUL BOYE TECHNOLOGIES: BUSINESS OVERVIEW
                        TABLE 240 PAUL BOYE TECHNOLOGIES: PRODUCTS/SOLUTIONS/SERVICES OFFERED
             15.2.16 ROKETSAN
                        TABLE 241 ROKETSAN: BUSINESS OVERVIEW
                        TABLE 242 ROKETSAN: PRODUCTS/SOLUTIONS/SERVICES OFFERED
             15.2.17 SAAB AB
                        TABLE 243 SAAB AB: BUSINESS OVERVIEW
                        FIGURE 45 SAAB AB: COMPANY SNAPSHOT
                        TABLE 244 SAAB AB: PRODUCTS/SOLUTIONS/SERVICES OFFERED
             15.2.18 MKU LIMITED
                        TABLE 245 MKU LIMITED: BUSINESS OVERVIEW
                        TABLE 246 MKU LIMITED: PRODUCTS/SOLUTIONS/SERVICES OFFERED
             15.2.19 PACIFIC SAFETY PRODUCTS
                        TABLE 247 PACIFIC SAFETY PRODUCTS: BUSINESS OVERVIEW
                        TABLE 248 PACIFIC SAFETY PRODUCTS: PRODUCTS/SOLUTIONS/SERVICES OFFERED
             15.2.20 ELMON
                        TABLE 249 ELMON: BUSINESS OVERVIEW
                        TABLE 250 ELMON: PRODUCTS/SOLUTIONS/SERVICES OFFERED
             15.2.21 NP AEROSPACE
                        TABLE 251 NP AEROSPACE: BUSINESS OVERVIEW
             15.2.22 PLASAN
                        TABLE 252 PLASAN: BUSINESS OVERVIEW
             15.2.23 ARMOR EXPRESS
                        TABLE 253 ARMOR EXPRESS: BUSINESS OVERVIEW
*Details on Business overview, Products/Solutions/Services offered, Recent Developments, MnM view, Key strengths, Strategic choices, Weaknesses and competitive threats might not be captured in case of unlisted companies.  
 
16 APPENDIX (Page No. - 226)
     16.1 DISCUSSION GUIDE 
     16.2 KNOWLEDGESTORE: MARKETSANDMARKETS’ SUBSCRIPTION PORTAL 
     16.3 CUSTOMIZATION OPTIONS 
     16.4 RELATED REPORTS 
     16.5 AUTHOR DETAILS 
 

This research study involved the extensive use of secondary sources, directories, and databases, such as D&B Hoovers, Bloomberg Businessweek, and Factiva to identify and collect information relevant to the ballistic protection market. Primary sources included industry experts from the core and related industries as well as preferred suppliers, manufacturers, solution providers, technology developers, alliances, and organizations related to all the segments of this industry’s value chain. All primary sources were interviewed to obtain and verify critical qualitative and quantitative information as well as to assess prospects for the growth of the market during the forecast period.

Secondary Research

The share of companies in the ballistic protection market was determined using secondary data made available through paid and unpaid sources and by analyzing their product portfolios. The companies were rated based on the performance and quality of their products. These data points were further validated by primary sources.

Secondary sources that were referred to for this research study on the ballistic protection market included financial statements of companies offering and developing ballistic protection products and solutions and information from various trade, business, and professional associations, among others. Secondary data was collected and analyzed to arrive at the overall size of the ballistic protection market, which was further validated by primary respondents.

Primary Research

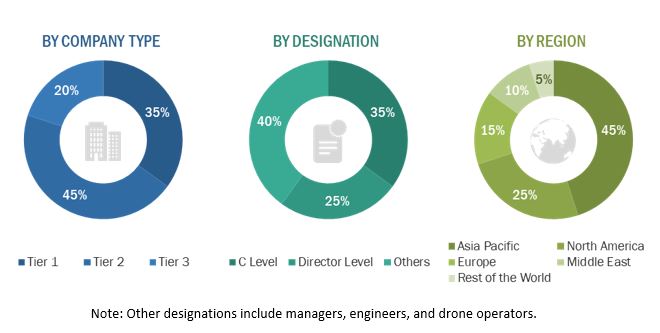
Extensive primary research was conducted after obtaining information about the current scenario of the ballistic protection market through secondary research. Several primary interviews were conducted with market experts from both, the demand- and supply-side across 5 major regions, namely, North America, Europe, Asia Pacific, the Middle East and Africa and Latin America. This primary data was collected through questionnaires, mails, and telephonic interviews.
Ballistic Protection Market Size, and Share

To know about the assumptions considered for the study, download the pdf brochure

Market Size Estimation

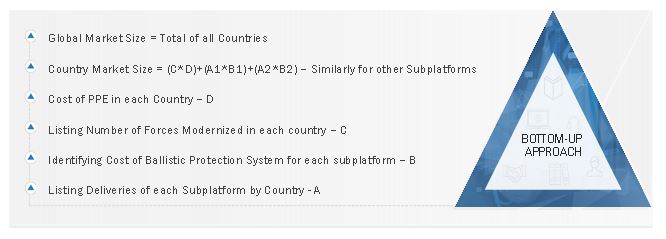
Both, the top-down and bottom-up approaches were used to estimate and validate the size of the ballistic protection market.

The research methodology that was used to estimate the size of the target drones market includes the following details.

Key players in the ballistic protection market were identified through secondary research, and their market share was determined through primary and secondary research. This included a study of the annual and financial reports of the top market players and extensive interviews of leaders such as chief executive officers, directors, and marketing executives of the leading companies operating in the target drones market.

All percentage shares, splits, and breakdowns were determined using secondary sources and were verified through primary sources. All possible parameters that affect the markets covered in this research study were accounted for, viewed in extensive detail, verified through primary research, and analyzed to obtain the final quantitative and qualitative data on the ballistic protection market. This data was consolidated, enhanced with detailed inputs, analyzed by MarketsandMarkets, and presented in this report.

Market size estimation methodology: Bottom-up approach
Ballistic Protection Market Size, and Bottom-up approach

Data Triangulation

After arriving at the overall size of the ballistic protection market from the market size estimation process explained above, the total market has been split into several segments and subsegments. The data triangulation and market breakdown procedures explained below have been implemented, wherever applicable, to complete the overall market engineering process and arrive at the exact statistics for various market segments and subsegments. The data was triangulated by studying various factors and trends from both the demand and supply sides. Along with this, the market size was validated using both, top-down and bottom-up approaches.

Objectives of the Study

  • To define, describe, segment, and forecast the size of the ballistic protection market based on platform, application, technology, material, product, threat level and region for the forecast period from 2022 to 2027
  • To forecast the size of various segments of the market with respect to five major regions, namely, North America, Europe, Asia Pacific, the Middle East, Africa and Latin America , along with the major countries in each of these regions
  • To identify and analyze the key drivers, restraints, opportunities, and challenges influencing the growth of the market
  • To identify opportunities for stakeholders in the market by studying key market and technology trends
  • To analyze competitive developments such as contracts, agreements, acquisitions & partnerships, new product launches & developments, and R&D activities in the market
  • To estimate the procurement of ballistic protection products by different countries to track the market size of ballistic protection
  • To provide a comprehensive competitive landscape of the market along with an overview of the different strategies adopted by key players to strengthen their position in the market
  • To identify industry trends, market trends, and technology trends currently prevailing in the market
  • To analyze micromarkets1 with respect to individual technological trends and their contribution to the total market
  • To analyze opportunities in the market for stakeholders by identifying key market trends
  • To profile key market players and comprehensively analyze their market share and core competencies2
  • To provide a detailed competitive landscape of the market, along with an analysis of business and strategies such as mergers & acquisitions, partnerships, agreements, and product developments in the ballistic protection market
  • To identify detailed financial positions, key products, and unique selling points of leading companies in the market

Available Customizations:

Along with market data, MarketsandMarkets offers customizations as per the specific needs of a company. The following customization options are available for the report:

Company Information

  • Detailed analysis and profiling of additional market players (up to 5)
  • Market analysis of additional countries (subject to the data availability)
Custom Market Research Services

We will customize the research for you, in case the report listed above does not meet with your exact requirements. Our custom research will comprehensively cover the business information you require to help you arrive at strategic and profitable business decisions.

Request Customization

Instant Answers with GPT - Ask Now!

Ask real questions. Get complete answers !
Report Code
AS 2798
Published ON
Aug, 2022
Choose License Type
BUY NOW
  • SHARE
X
Request Customization
Speak to Analyst
Speak to Analyst
OR FACE-TO-FACE MEETING
PERSONALIZE THIS RESEARCH
  • Triangulate with your Own Data
  • Get Data as per your Format and Definition
  • Gain a Deeper Dive on a Specific Application, Geography, Customer or Competitor
  • Any level of Personalization
REQUEST A FREE CUSTOMIZATION
LET US HELP YOU!
  • What are the Known and Unknown Adjacencies Impacting the Ballistic Protection Market
  • What will your New Revenue Sources be?
  • Who will be your Top Customer; what will make them switch?
  • Defend your Market Share or Win Competitors
  • Get a Scorecard for Target Partners
CUSTOMIZED WORKSHOP REQUEST
knowledgestore logo

Hold On!

Want to explore hidden markets that can drive new revenue in Ballistic Protection Market?

Find Hidden Markets
  • Call Us
  • +1-888-600-6441 (Corporate office hours)
  • +1-888-600-6441 (US/Can toll free)
  • +44-800-368-9399 (UK office hours)
CONNECT WITH US
ABOUT TRUST ONLINE
©2024 MarketsandMarkets Research Private Ltd. All rights reserved
DMCA.com Protection Status
Website Feedback