Battery Additives Market by Type (Conductive Additive, Porous Additive, and Nucleating Additive), Application (Lead Acid and Li-ion), and Region (APAC, Europe, North America, South America, and the Middle East & Africa) - Global Forecast to 2023


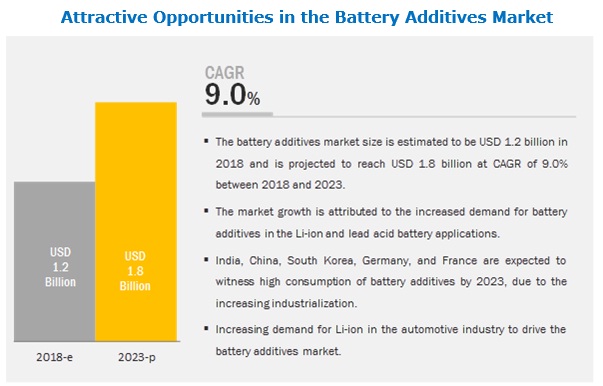
The battery additives market is projected to reach USD 1.8 billion by 2023, at a CAGR of 9.0%. The growing demand for Li-ion batteries in consumer electronics, high adoption of HEV, PHEV, and EV in the automotive industry, and the increasing investments in renewable energy are factors fueling the growth of the market. However, underdeveloped support infrastructure for EVs is a major restraint for market growth.
Lead acid application to be the largest segment of the battery additives market, in terms of value
On the basis of application, the battery additives market has been categorized into lead acid, L-ion, and others. The lead acid segment was the largest application of battery additives in 2017, whereas Li-ion is projected to be the faster-growing application segment of the battery additive market during the forecast period. Li-ion batteries are widely used in various applications such as smartphones, tablets, laptops, wearable devices, and other home applications. Battery additives used in the Li-ion application increase storage stability, safety, and improves the performance of batteries.
The EVs sub application is projected to register a higher CAGR during the forecast period
On the basis of sub application of Li-ion, the battery additives market has been segmented into EVs, portable devices, industrial, and others. EVs is the largest and fastest-growing application of Li-ion owing to reliable, cost-efficient, and good torque and lower emission control characteristics.
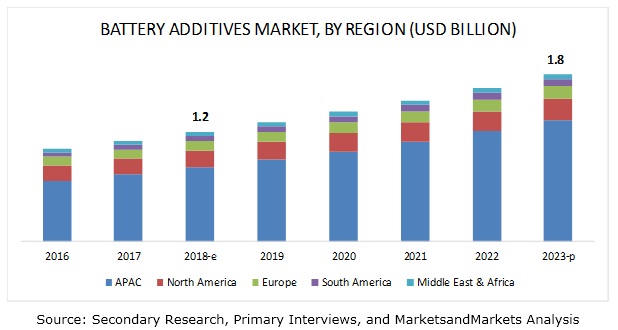
APAC is projected to be the largest market during the forecast period.
On the basis of region, the battery additives market has been segmented into APAC, Europe, North America, the Middle East & Africa, and South America. APAC is projected to register the highest growth in the global battery additives market during the forecast period. The demand for battery additives is high in developing economies such as China and India. The growth of the battery additives market in APAC is mainly driven by high demand in portable devices and electric vehicles applications. Rising population and growing end-use industries have led to innovation and development, making APAC an important industrial hub, globally. High growth and innovation, along with industry consolidations, are expected to lead to the rapid growth of the market in the region.
Key Market Players in Battery Additives Market
The key players profiled in this report include Cabot Corporation (US), 3M (US), IMERYS (France), Orion Engineered Carbons (Luxembourg), Hammond Group (US), SGL Carbon (Germany), Borregaard (Norway), HOPAX (Taiwan), PENOX (Germany), and ALTANA (Germany). These companies have adopted various organic as well as inorganic growth strategies between 2015 and 2019 to strengthen their positions in the market. The key players adopted both organic and inorganic growth strategies to enhance their regional presence and meet the growing demand for battery additives from emerging economies.
Battery Additives Market Report Scope
|
Report Metric |
Details |
|
Years considered for the study |
2016-2023 |
|
Base year |
2017 |
|
Forecast period |
2018-2023 |
|
Units considered |
Value (USD Million) |
|
Segments |
Type, Application, and Region |
|
Regions |
North America, APAC, Europe, the Middle East & Africa, and South America |
|
Companies |
Total of 10 major players covered: |
This research report categorizes the battery additives market based on type, application, and region.
On the basis of type, the battery additives market has been segmented as follows:
- Conductive Additive
- Porous Additive
- Nucleating Additive
On the basis of application, the battery additives market has been segmented as follows:
- Lead Acid
- Li-ion
- Others (nickel-metal hydride and nickel-cadmium)
On the basis of region, the battery additive market has been segmented as follows:
- Europe
- North America
- APAC
- Middle East & Africa
- South America
Recent Developments in Battery Additives Market
- In February 2016, Cabot Corporation launched a new conductive additive, LITX 300, for Li-ion battery applications. This new additive is easy to disperse as well as incorporate in the Li-ion battery manufacturing process. It also improves conductivity, flexibility, and shelf life of Li-ion batteries.
- In November 2018, Orion Engineered Carbons acquired acetylene carbon black manufacturer Société du Noir d'Acétylène de l'Aubette. This acquisition added acetylene carbon black to its product portfolio which is used in Li-ion batteries and high-end electrical cables manufacturing.
- In January 2017, IMERYS started manufacturing graphite in Namibia, 13 months after the new Otjiwarongo mine became operational. This was to cater to the increasing demand for graphite, as the sales of electric and hybrid vehicles increased significantly in the previous year.
Critical Questions the Battery Additives Market Report Answers:
- Are there any upcoming hot bets for the battery additives market?
- How are the market dynamics for different applications of battery additives?
- What are the upcoming opportunities for different types of battery additives in emerging economies?
- What are the significant trends in end-use industries that are influencing the battery additive market?
- Who are the major manufacturers of battery additives?
- What are the factors governing the battery additives market in each region?
To speak to our analyst for a discussion on the above findings, click Speak to Analyst
 Exclusive indicates content/data unique to MarketsandMarkets and not available with any competitors.
Table of Contents
1 Introduction (Page No. - 17)
1.1 Objectives of the Study
1.2 Market Definition
1.3 Market Scope
1.3.1 Battery Additives Market Segmentation
1.3.2 Regions Covered
1.3.3 Years Considered for the Study
1.4 Currency
1.5 Stakeholders
2 Research Methodology (Page No. - 21)
2.1 Research Data
2.1.1 Secondary Data
2.1.1.1 Key Data From Secondary Sources
2.1.2 Primary Data
2.1.2.1 Key Data From Primary Sources
2.1.2.2 Key Industry Insights
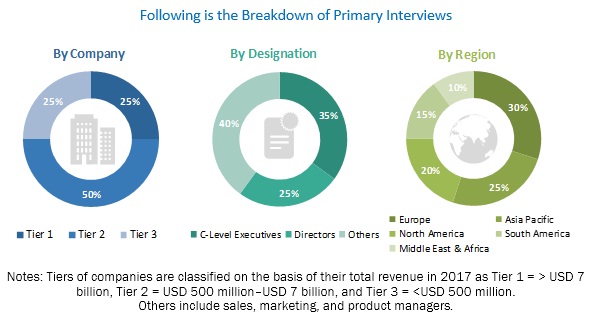
2.1.2.3 Breakdown of Primary Interviews
2.2 Market Size Estimation
2.2.1 Bottom-Up Approach
2.2.2 Top-Down Approach
2.3 Data Triangulation
2.4 Assumptions
2.5 Limitations
3 Executive Summary (Page No. - 29)
4 Premium Insights (Page No. - 32)
4.1 Attractive Opportunities in the Battery Additives Market
4.2 Battery Additive Market, By Application
4.3 Battery Additives Market, By Major Countries
4.4 APAC Battery Additive Market, By Application and Country
5 Market Overview (Page No. - 35)
5.1 Introduction
5.2 Market Dynamics
5.2.1 Drivers
5.2.1.1 Increasing Demand for Li-Ion Batteries in Consumer Electronics Applications
5.2.1.2 High Adoption of Hev, Phev, and Ev in the Automotive Industry
5.2.1.3 Increasing Investments in Renewable Energy
5.2.2 Restraints
5.2.2.1 Underdeveloped Support Infrastructure for EVs
5.2.2.2 Stringent Safety Issues Related to Batteries
5.2.3 Opportunities
5.2.3.1 Technological Advancements in Li-Ion Batteries
5.2.4 Challenges
5.2.4.1 Regulations and Safety Issues Related to Lead Acid Batteries
5.3 Porter’s Five Forces Analysis
5.3.1 Threat of New Entrants
5.3.2 Threat of Substitutes
5.3.3 Bargaining Power of Suppliers
5.3.4 Bargaining Power of Buyers
5.3.5 Intensity of Competitive Rivalry
6 Battery Additives Market, By Type (Page No. - 43)
6.1 Introduction
6.2 Conductive Additive
6.3 Porous Additive
6.4 Nucleating Additive
7 Battery Additives Market, By Application (Page No. - 45)
7.1 Introduction
7.2 Lithium-Ion Battery
7.2.1 Portable Devices
7.2.1.1 Better Performance and Durability of Li-Ion Battery to Drive the Demand in the Portable Devices Application
7.2.2 Electric Vehicles
7.2.2.1 Increasing Environmental Awareness About the Use of Li-Ion Battery in EVs to Increase the Demand for Battery Additives
7.2.3 Industrial
7.2.3.1 Improved Efficiency of Li-Ion Batteries in Construction and Mining Equipment to Fuel the Demand for Battery Additives
7.2.4 Others
7.3 Lead Acid Battery
7.3.1 Automotive
7.3.1.1 Growing Production of Automobiles to Drive the Battery Additives Market
7.3.2 Industrial
7.3.2.1 Improved Mechanical and Electrical Properties of Lead Acid Battery are Boosting the Battery Additives Market
7.4 Others
8 Battery Additives Market, By Region (Page No. - 52)
8.1 Introduction
8.2 North America
8.2.1 US
8.2.1.1 Increasing Consumption of Electronic Devices is Governing the Market Growth
8.2.2 Canada
8.2.2.1 Government Initiatives are Likely to Boost the Demand for Battery Additives
8.2.3 Mexico
8.2.3.1 Increasing Demand for Li-Ion Batteries is Triggering the Growth of the Market
8.3 APAC
8.3.1 China
8.3.1.1 Rising Demand for Electric Vehicles is Contributing to the Market Growth
8.3.2 India
8.3.2.1 High Growth of the Automotive Industry is Propelling the Market
8.3.3 Japan
8.3.3.1 Growth of Various End-Use Industries is Spurring the Market
8.3.4 South Korea
8.3.4.1 Rapid Economic Expansion in South Korea to Fuel Market Growth
8.3.5 Malaysia
8.3.5.1 Increasing Consumer Electronics to Boost the Demand for Battery Additives
8.3.6 Taiwan
8.3.6.1 Growing Demand for Li-Ion Batteries to Augment the Market Growth
8.3.7 Indonesia
8.3.7.1 Increasing Demand for Passenger Cars to Drive the Demand for Battery Additives
8.3.8 Rest of APAC
8.4 Europe
8.4.1 Germany
8.4.1.1 Increasing Investments in Battery Production are Offering Opportunities for Battery Additives Manufacturers
8.4.2 France
8.4.2.1 Rising Use of Battery Additives in the Automotive Industry is Driving the Market
8.4.3 UK
8.4.3.1 Growing EVs Sector is Boosting the UK Market
8.4.4 Italy
8.4.4.1 Innovations in the Battery Industry are Expected to Stimulate Market Growth
8.4.5 Netherlands
8.4.5.1 Innovations in EVs to Drive the Battery Additives Market
8.4.6 Norway
8.4.6.1 Growing Consumer Electronics Industry is Driving the Market
8.4.7 Spain
8.4.7.1 Increasing Demand From the Automotive Industry to Drive the Demand for Battery Additives
8.4.8 Rest of Europe
8.5 South America
8.5.1 Brazil
8.5.1.1 Rise in the Number of Battery Production Facilities is Boosting the Market
8.5.2 Argentina
8.5.2.1 Growth of the Automotive Industry is A Driving Factor for the Market
8.5.3 Rest of South America
8.6 Middle East & Africa
8.6.1 Saudi Arabia
8.6.1.1 Increase in the Number of Vehicles is Driving the Market
8.6.2 South Africa
8.6.2.1 Automotive, Electronics, and Chemical Industries are Driving the Market
8.6.3 Rest of the Middle East & Africa
9 Competitive Landscape (Page No. - 82)
9.1 Overview
9.2 Competitive Leadership Mapping
9.2.1 Visionary Leaders
9.2.2 Innovators
9.2.3 Dynamic Differentiators
9.2.4 Emerging Companies
9.3 Competitive Benchmarking
9.3.1 Strength of Product Portfolio
9.3.2 Business Strategy Excellence
9.4 Ranking of Key Players, 2018
9.5 Competitive Scenario
9.5.1 Expansion
9.5.2 Acquisition
9.5.3 New Product Launch
10 Company Profiles (Page No. - 90)
10.1 Cabot Corporation
10.1.1 Business Overview
10.1.2 Products Offered
10.1.3 Recent Developments
10.1.4 SWOT Analysis
10.1.5 MnM View
10.2 Hammond Group
10.2.1 Business Overview
10.2.2 Products Offered
10.2.3 Recent Developments
10.2.4 SWOT Analysis
10.2.5 MnM View
10.3 Orion Engineered Carbons
10.3.1 Business Overview
10.3.2 Products Offered
10.3.3 Recent Developments
10.3.4 SWOT Analysis
10.3.5 MnM View
10.4 IMERYS
10.4.1 Business Overview
10.4.2 Products Offered
10.4.3 Recent Developments
10.4.4 SWOT Analysis
10.4.5 MnM View
10.5 3M
10.5.1 Business Overview
10.5.2 Products Offered
10.5.3 SWOT Analysis
10.5.4 MnM View
10.6 ALTANA
10.6.1 Business Overview
10.6.2 Products Offered
10.7 Borregaard
10.7.1 Business Overview
10.7.2 Products Offered
10.8 HOPAX
10.8.1 Business Overview
10.8.2 Products Offered
10.8.3 Recent Developments
10.9 PENOX
10.9.1 Business Overview
10.9.2 Products Offered
10.10 SGL Group
10.10.1 Business Overview
10.10.2 Products Offered
11 Appendix (Page No. - 107)
11.1 Discussion Guide
11.2 Knowledge Store: Marketsandmarkets’ Subscription Portal
11.3 Available Customizations
11.4 Related Reports
List of Tables (63 Tables)
Table 1 Battery Additives Market Size, By Application, 2016–2023 (USD Million)
Table 2 Battery Additive Market Size in Li-Ion Application, By Region, 2016–2023 (USD Million)
Table 3 Battery Additives Market Size in Lead Acid Application, By Region, 2016–2023 (USD Million)
Table 4 Battery Additive Market Size in Other Applications, By Region, 2016–2023 (USD Million)
Table 5 Battery Additives Market Size, By Region, 2016–2023 (USD Million)
Table 6 North America: By Market Size, By Country, 2016–2023 (USD Million)
Table 7 North America: By Market Size in Li-Ion Application, By Country, 2016–2023 (USD Million)
Table 8 North America: By Market Size in Li-Ion Application, By Sub Application, 2016–2023 (USD Million)
Table 9 North America: By Market Size in Lead Acid Application, By Country, 2016–2023 (USD Million)
Table 10 North America: By Market Size in Lead Acid Application, By Sub Application, 2016–2023 (USD Million)
Table 11 North America: By Market Size in Other Applications, By Country, 2016–2023 (USD Million)
Table 12 US: By Market Size, By Application, 2016–2023 (USD Million)
Table 13 Canada: By Market Size, By Application, 2016–2023 (USD Million)
Table 14 Mexico: By Market Size, By Application, 2016–2023 (USD Million)
Table 15 APAC: By Market Size, By Country, 2016–2023 (USD Million)
Table 16 APAC: By Market Size in Li-Ion Application, By Country, 2016–2023 (USD Million)
Table 17 APAC: By Market Size in Li-Ion Application, By Sub Application, 2016–2023 (USD Million)
Table 18 APAC: By Market Size in Lead Acid Application, By Country, 2016–2023 (USD Million)
Table 19 APAC: By Market Size in Lead Acid Application, By Sub Application, 2016–2023 (USD Million)
Table 20 APAC: By Market Size in Other Applications, By Country, 2016–2023 (USD Million)
Table 21 China: By Market Size, By Application, 2016–2023 (USD Million)
Table 22 India: By Market Size, By Application, 2016–2023 (USD Million)
Table 23 Japan: By Market Size, By Application, 2016–2023 (USD Million)
Table 24 South Korea: By Market Size, By Application, 2016–2023 (USD Million)
Table 25 Malaysia: By Market Size, By Application, 2016–2023 (USD Million)
Table 26 Taiwan: By Market Size, By Application, 2016–2023 (USD Million)
Table 27 Indonesia: By Market Size, By Application, 2016–2023 (USD Million)
Table 28 Rest of APAC: By Market Size, By Application, 2016–2023 (USD Million)
Table 29 Europe: By Market Size, By Country, 2016–2023 (USD Million)
Table 30 Europe: By Market Size in Li-Ion Application, By Country, 2016–2023 (USD Million)
Table 31 Europe: By Market Size in Li-Ion Application, By Sub Application, 2016–2023 (USD Million)
Table 32 Europe: By Market Size in Lead Acid Application, By Country, 2016–2023 (USD Million)
Table 33 Europe: By Market Size in Lead Acid Application, By Sub Application, 2016–2023 (USD Million)
Table 34 Europe: By Market Size in Other Applications, By Country, 2016–2023 (USD Million)
Table 35 Germany: By Market Size, By Application, 2016–2023 (USD Million)
Table 36 France: By Market Size, By Application, 2016–2023 (USD Million)
Table 37 UK: By Market Size, By Application, 2016–2023 (USD Million)
Table 38 Italy: By Market Size, By Application, 2016–2023 (USD Million)
Table 39 Netherlands: By Market Size, By Application, 2016–2023 (USD Million)
Table 40 Norway: By Market Size, By Application, 2016–2023 (USD Million)
Table 41 Spain: By Market Size, By Application, 2016–2023 (USD Million)
Table 42 Rest of Europe: By Market Size, By Application, 2016–2023 (USD Million)
Table 43 South America: By Market Size, By Country, 2016–2023 (USD Million)
Table 44 South America: By Market Size in Li-Ion Application, By Country, 2016–2023 (USD Million)
Table 45 South America: By Market Size in Li-Ion Application, By Sub Application, 2016–2023 (USD Million)
Table 46 South America: By Market Size in Lead Acid Application, By Country, 2016–2023 (USD Million)
Table 47 South America: By Market Size in Lead Acid Application, By Sub Application, 2016–2023 (USD Million)
Table 48 South America: By Market Size in Other Applications, By Country, 2016–2023 (USD Million)
Table 49 Brazil: By Market Size, By Application, 2016–2023 (USD Million)
Table 50 Argentina: By Market Size, By Application, 2016–2023 (USD Million)
Table 51 Rest of South America: By Market Size, By Application, 2016–2023 (USD Million)
Table 52 Middle East & Africa: By Market Size, By Country, 2016–2023 (USD Million)
Table 53 Middle East & Africa: By Market Size in Li-Ion Application, By Country, 2016–2023 (USD Million)
Table 54 Middle East & Africa: By Market Size in Li-Ion Application, By Sub Application, 2016–2023 (USD Million)
Table 55 Middle East & Africa: By Market Size in Lead Acid Application, By Country, 2016–2023 (USD Million)
Table 56 Middle East & Africa: By Market Size in Lead Acid Application, By Sub Application, 2016–2023 (USD Million)
Table 57 Middle East & Africa: By Market Size in Other Applications, By Country, 2016–Million)78
Table 58 Saudi Arabia: By Market Size, By Application, 2016–2023 (USD Million)
Table 59 South Africa: By Market Size, By Application, 2016–2023 (USD Million)
Table 60 Rest of the Middle East & Africa: By Market Size, By Application, 2016–2023 79
Table 61 Expansion, 2015–2019
Table 62 Acquisition, 2015–2019
Table 63 New Product Launch, 2015–2019
List of Figures (34 Figures)
Figure 1 Battery Additives Market: Research Design
Figure 2 Battery Additive Market: Data Triangulation
Figure 3 Lead Acid Application Segment to Account for A Larger Market Share
Figure 4 Electric Vehicles Application Held the Largest Market Share in Li-Ion Segment in 2017
Figure 5 APAC to Register the Highest Cagr in the Battery Additives Market
Figure 6 Growth in the Use of Li-Ion Batteries in Various Industries to Drive the Battery Additive Market
Figure 7 Lead Acid Application to Dominate the Battery Additives Market
Figure 8 China to Register the Highest Cagr in the Battery Additive Market
Figure 9 Lead Acid Application Segment and China Accounted for the Largest Market Share in 2017
Figure 10 Drivers, Restraints, Opportunities, and Challenges in the Battery Additives Market
Figure 11 Battery Additive Market: Porter’s Five Forces Analysis
Figure 12 Lead Acid Application to Drive the Battery Additives Market
Figure 13 APAC to Dominate the Battery Additive Market
Figure 14 Battery Additives Market in China to Register the Highest Cagr
Figure 15 North America: Battery Additives Market Snapshot
Figure 16 APAC: Battery Additive Market Snapshot
Figure 17 Europe: Battery Additives Market Snapshot
Figure 18 Companies Adopted Both Organic and Inorganic Growth Strategies Between 2015 and 2019
Figure 19 Battery Additive Market: Competitive Leadership Mapping, 2018
Figure 20 Cabot Corporation: Company Snapshot
Figure 21 Cabot Corporation: SWOT Analysis
Figure 22 Hammond Group: Company Snapshot
Figure 23 Hammond Group: SWOT Analysis
Figure 24 Orion Engineered Carbons: Company Snapshot
Figure 25 Orion Engineered Carbons: SWOT Analysis
Figure 26 IMERYS: Company Snapshot
Figure 27 IMERYS: SWOT Analysis
Figure 28 3M: Company Snapshot
Figure 29 3M: SWOT Analysis
Figure 30 ALTANA: Company Snapshot
Figure 31 Borregaard: Company Snapshot
Figure 32 HOPAX: Company Snapshot
Figure 33 PENOX: Company Snapshot
Figure 34 SGL Group: Company Snapshot
The study involves four major activities in estimating the current market size of battery additives. Exhaustive secondary research was carried out to collect information on the market, peer market, and parent market. The next step was to validate these findings, assumptions, and sizing with industry experts across the value chain through primary research. Both top-down and bottom-up approaches were employed to estimate the complete market size. After that, the market breakdown and data triangulation methodologies were used to estimate the market size of segments and subsegments.
Battery Additives Market Secondary Research
In the secondary research process, various secondary sources, such as Hoovers and Bloomberg BusinessWeek, were referred to for identifying and collecting information for this study. These secondary sources included annual reports, press releases & investor presentations of companies, white papers, certified publications, articles by recognized authors, gold standard & silver standard websites, regulatory bodies, and databases.
Battery Additives Market Primary Research
The battery additives market comprises several stakeholders, such as raw material suppliers, distributors of battery additives, industry associations, end-product manufacturers, and regulatory organizations in the supply chain. The demand side of this market consists of manufacturers of automotive and consumer electronics; whereas the supply side consists of battery additives manufacturers. Various primary sources from both the supply and demand sides of the market were interviewed to obtain qualitative and quantitative information.
To know about the assumptions considered for the study, download the pdf brochure
Battery Additives Market Size Estimation
Both top-down and bottom-up approaches were used to estimate and validate the total size of the battery additives market. These methods were also used extensively to estimate the size of various subsegments in the market. The research methodology used to estimate the market size includes the following:
- The key players in the market were identified through extensive secondary research.
- The industry’s supply chain and market size, in terms of value, were determined through primary and secondary research processes.
- All percentage shares, splits, and breakdowns were determined using secondary sources and verified through primary sources.
Battery Additives Market Data Triangulation
After arriving at the overall market size-using the market size estimation processes explained above-the market was split into several segments and subsegments. In order to complete the overall market engineering process and arrive at the exact statistics of each market segment and subsegment, the data triangulation and market breakdown procedures were employed, wherever applicable. Data was triangulated by studying various factors and trends from both the demand and supply sides.
Battery Additives Market Objectives of the Study:
- To analyze and forecast the battery additives market size, in terms of value
- To provide detailed information about the key factors (drivers, restraints, opportunities, and challenges) influencing the market growth
- To define and describe the market by type, application, and sub application
- To forecast the size of the market with respect to five regions, namely, Asia Pacific (APAC), Europe, North America, South America, and the Middle East & Africa along with their key countries
- To strategically analyze micromarkets with respect to individual trends, growth prospects, and their contribution to the overall market
- To analyze opportunities in the market for stakeholders and provide a competitive landscape for the market leaders
- To analyze competitive developments, such as new product launch, acquisition, and expansion, in the market
- To strategically profile the key players and comprehensively analyze their market shares and core competencies.
Battery Additives Market Report Available Customizations
MarketsandMarkets offers customizations according to the specific needs of the companies along with the market data. The following customization options are available for this report:
Battery Additives Market Product Analysis
- A product matrix that provides a detailed comparison of the product portfolio of each company
Battery Additives Market Regional Analysis
- Further breakdown of the Rest of APAC battery additives market
Battery Additives Market Company Information:
- Detailed analysis and profiles of additional market players.


Growth opportunities and latent adjacency in Battery Additives Market