Beer Processing Market by Brewery Type (Macrobrewery, Microbrewery, Brew Pubs, Regional), Beer Type (Lager, Ale & stout, Specialty beer, Low alcohol beer), Distribution Channel, Price Category, Equipment Type, and Region - Global Forecast to 2025


[205 Pages Report] The global beer processing market size is projected to grow from USD 677.5 Billion in 2019 to USD 815.4 Billion by 2025, recording a compound annual growth rate (CAGR) of 3.1% during the forecast period. The growing popularity of low- or no-alcohol beer, as well as the growing number of microbreweries and brewpubs, has significantly fueled the beer processing market. Several brewers, including Heineken, Greene King, AB InBev, and Budweiser, are expanding their portfolios to include low-alcohol versions of their flagship beers. Furthermore, product innovations and advancements in the brewery equipment market have resulted in an increasing demand among beer processors for updated and sustainable brewery equipment.
Beer Processing Market Dynamics
Driver: Growing number of microbreweries and brewpubs
Globally, the craft brewery market, which includes microbreweries and brewpubs, has grown significantly in recent years. According to the Brewers Association, more than 55 percent of the total 7450 breweries in the United States in 2015 were microbreweries and brewpubs. For 2017-2018, the number of microbreweries increased by 15%, while the number of brewpubs increased by 10% during the same period. Developing countries, such as India, are also seeing an increase in the number of microbreweries. According to the Craft Brewers Association of India, the number of microbreweries in India increased from 20 to 120 between 2013 and 2018. This demonstrates that the beer industry is growing. This is due to people's changing lifestyles, as they are always looking for new experiences. Furthermore, consumers today are willing to pay a premium for handcrafted beer produced in small batches. Another ongoing trend is beer tourism, which entails visiting various locations with the primary goal of tasting the beer. All of this is driving up demand for local and regional beer, which is driving up the number of craft breweries, particularly microbreweries.
Restraint: High capital investments and maintenance costs
The Craft beer producers must make significant capital investments to install various types of processing equipment. This installation not only incurs high costs, but it also necessitates timely maintenance, which acts as an additional cost that affects beer manufacturers' operating margins. Furthermore, large capital investments have a long-term impact on product costs, which theme beer manufacturers do not like. Established beer manufacturers must also make significant capital investments to install new machine lines to produce specific or new beer types in order to compete in the market. Replacing old machines improves efficiency but has an impact on the company's fixed cost structure due to the high installation costs and timely maintenance costs. The average turnkey project cost is also significantly high, which may be a burden for many brewery owners.
Opportunity: Focus on digitalization and automation using IoT and big data
Automation lowers labour costs while increasing the ability to switch between different processing operations. As a result, there is a growing demand for new equipment automation, which is a major purchasing factor for beer manufacturers. Robotic automation is the most recent advancement in processing technology, and it is being used by beer manufacturers to improve efficiency and reduce costs. Robotics is increasingly being used in beer manufacturing facilities, where these technologies are used in packaging systems: they are also used in palletizing and material movement, including driverless forklifts by beer manufacturers. Beer producers are looking for new machinery that can be easily integrated into the production process. Manufacturers believe that automation allows their beer to reach the market much more quickly. Automation and digitalization are the real draws for microbreweries with limited manpower and small facilities. This will provide them with a competitive advantage while also lowering long-term costs. Automation not only provides faster processing and higher precision, but also hygiene, which is one of the most important factors in the industry. The Internet of Things (lot) reduces waste by gathering data at nearly every step of a process, including weight, the volume of ingredients, gas, waste products, motion light levels, and other prominent data points.
Challenge: Competition from other beverages offering health benefits
The market for non-alcoholic beverages is expanding as consumer preferences shift toward healthier beverages. People prefer non-alcoholic beverages that are low in calories and high in nutrients to alcoholic beverages. Functional beverages, including fortified drinks, are increasingly popular among consumers these days. People prefer on-the-go nutritious drinks that can replace meals due to their hectic lifestyles. Beer consumption is being reduced by consumers seeking weight loss options. Big brands are developing functional and fortified beverages. In addition, the beverage industry is constantly evolving, many manufacturers are experimenting with different combinations to attract customers.
The lager beer in the By type segment is estimated to account for the largest market share in the beer processing market.
The Lager is a type of beer brewed with bottom-fermenting yeast. This allows more sugar to stay in the mix, resulting in a smoother, sweeter beer. It also goes through a cold conditioning process, which ales do not, to develop more clarity and finer flavour. Because of the higher sugar content, slower fermentation, and cold treatment, this beer has a lighter and clearer appearance with lower alcohol content, as well as a sweeter, smoother, and crisper flavour making it the most popular choice amongst the consumers.
The super premium subsegment in the by price segment is projected to account for the fastest growth during the forecast period.
In recent years, super premium beers have thrived. The rising affluence, rapid urbanisation, and progressive lifestyles are driving the consumer trend toward premiumization. Beer on tap, super premium international brands, and beer festivals are all assisting beer processors in expanding their market presence. The popularity of foreign brands, craft, and super-premium beers is also fueling the expansion of can packaging in the beer industry in order to meet the growing consumer preference for the pack type.
The on premise segment in distriution channel is estimated to account for the largest market share in the beer processing market during the forecast period.
The on trade/on-premise sales of beer for immediate consumption on premises such as bars and cafes are classified as on trade/on-premise sales. This distribution channel offers higher beer prices because breweries are closer to the final consumer, allowing for a better understanding of consumption patterns. In terms of value, on-trade distribution channels account for a lion's share of total beer sales. The growing consumption of beer in bars, restaurants, coffee shops, clubs, and hotels in both developed and developing countries, as well as the growth of microbreweries offering their own craft beers, are some of the major factors driving the growth of the beer market's on trade segment.
The macro brewery segment in brewery type is estimated to account for the biggest market share in the beer processing market during the forecast period.
Macrobreweries are large breweries with annual output of more than 6,000,000 barrels. Because macrobreweries have larger capacities and more facilities, the macrobrewery equipment segment accounted for a significant share of the global brewery equipment market. Many consumers still prefer beer from leading brands over craft beer due to standardised taste and quality making it the first choice of majority of the consumers.

To know about the assumptions considered for the study, Request for Free Sample Report
During the forecast period, Asia Pacific is expected to account for the largest market share in the beer industry.
In the total beer volume market, the Asia Pacific region accounted for nearly 33% of the market share. Because of the health benefits, the region is seeing a growing trend of premiumization and low or no alcohol beer beverages. Anheuser-Busch InBev (Belgium), Heineken N.V. (Netherlands), United Breweries (India), China Resources Snow Breweries Limited (China), and Carlsberg A/S (Denmark) all have production bases in the region. Alfa Laval (Sweden), GEA Group (Germany), Krones (Germany), and Ningbo Lehui International Engineering Equipment Co Ltd are among the beer equipment manufacturers in this region (China). China's beer market is still the world's largest. According to Kirin Holdings Company, Ltd., China was the world's largest producer and consumer of beer in 2017. Consumers in China are becoming more health conscious, which has resulted in a growing preference for premium beers with low alcohol content or no alcohol, which are replacing traditional beers. Furthermore, as people's standard of living has improved and their disposable incomes have increased, they are willing to spend more money on alcohol. As a result, the number of microbreweries in the country has increased.

To know about the assumptions considered for the study, download the pdf brochure
North America is projected to be the fastest growing in the beer processing market during the forecast period.
Beer imports and exports have increased significantly in the region. According to the Beer Institute (US), Mexico is the world's largest beer exporter, and Mexican beer is in high demand around the world. Furthermore, the United States is the second-largest beer producing country after China, and the country is seeing the presence of leading brands due to rising demand. This creates profitable opportunities for brewery equipment manufacturers. In North America, the microbrewery culture is also on the rise. These microbreweries require turnkey projects to get their operations up and running. The beer industry in this region has also seen a significant shift in consumer preferences. Consumers are willing to spend more money on premium products.
Key Market Players
The key players in the brewery equipment market, include Alfa Laval (Sweden), GEA Group (Germany), Krones Group (Germany), Paul Mueller (US), Praj Industries (India), Meura SA (Belgium), Della Toffola (Italy), Criveller Group (US), Kasper Schulz (Germany), Ningbo Lehui International Engineering Equipment Co., Ltd. (China), Hypro Group (India), and Shanghai Hengcheng Beverage Equipment Co., Ltd. (China). These players in this market are focusing on increasing their presence through agreements and collaborations. These companies have a strong presence in North America, Asia Pacific and Europe. They also have manufacturing facilities along with strong distribution networks across these regions.
Scope of Report
|
Report Metric |
Details |
|
Market Size for available years |
2017-2025 |
|
Base year considered |
2018 |
|
Forecast period |
2019–2025 |
|
Forecast units |
Value (USD Million/Billion), Volume (Billion Liters) |
|
Segments covered |
Beer Market (Beer Type, Price Category, and Distribution Channel); Brewing Equipment Market (Equipment Type, Brewery Type), and Region |
|
Geographies covered |
North America, Europe, Asia Pacific, and Rest of the World (RoW) |
|
Companies covered |
Brewery Equipment Manufacturers: |
This research report categorizes the beer processing market (brewery equipment and beer market) based on equipment type, brewery type, beer type, price category, distribution channel, and region.
Based on equipment type, the beer processing (brewery equipment) market has been segmented as follows:
-
Macrobrewery equipment
- Milling equipment
-
Brewhouse
- Mash kettles
- Lauter tun
- Wort kettles
- Whirlpoolers
- Steam generators
- Others (hot liquor tanks and cold-water tanks, laboratory equipment, and aeration devices)
- Cooling equipment
- Fermentation equipment
- Filtration & filling equipment
- Others (cleaning systems, spent grain silos, generators, bright beer tanks, compressors, and pipes)
-
Craft brewery equipment
- Mashing equipment
- Fermentation equipment
- Cooling equipment
- Storage equipment
- Storage equipment
- Compressors
- Others (pumps, filters, and separators)
Based on brewery type, the beer processing (brewery equipment) market has been segmented as follows:
- Macrobrewery
- Craft brewery
- Microbrewery
- Brewpub
- Others (farm breweries and regional breweries)
Based on the beer type, the beer processing market has been segmented as follows:
- Lager
- Ale and Stout
- Specialty Beer
- Low Alcohol Beer
Based on the price category, the beer processing (beer) market has been segmented as follows:
- Mainstream
- Discount
- Premium
- Super-premium
Based on the distribution channel, the beer processing (beer) market has been segmented as follows:
- Off-trade
- On-trade
Based on the region, the beer processing market (brewery equipment and beer market) has been segmented as follows:
- North America
- Europe
- Asia Pacific
- RoW (South America and the Middle East & Africa)
Recent Developments
- In 2019 March, Carlsberg purchased a minority stake in Chinese craft brewery Jing-A, producer of a wide range of craft beers for the Chinese market, including Flying Fist IPA, Tuhao Gold Pils, and Koji Red Ale, and the brewer also operates two bars in the country. Carlsberg has taken the responsibility of distributing the beer while Jing-A would continue with the production.
- In 2019 May, Heineken acquired Biela Ecuador, an Ecuador-based beer company, which is fully operational with high-quality brewing and packaging equipment base. This would help Heineken to expand in Ecuador, which is an attractive market owing to governmental support toward foreign investment.
- In 2018 November, Heineken acquired China Snow Resource (China), a company with a deep understanding and thereby a footprint in the Chinese market.
- In 2018 October, Krones Group acquired W.M Sprinkman Corporation (US), a company that provides engineered food & beverage processing equipment which are specialized in dairy & brewing industries.
- In 2018 February, Carlsberg Group acquired Olympic Brewery (Greece), a company that provides brands like Mythos, Mythos Radler, FIX Hellas, FIX Alcohol-free, FIX Dark, Kaiser, and Henninger.
Frequently Asked Questions (FAQ):
Who are some of the key players operating in the beer processing market and how intense is the competition?
The key players in the brewery equipment market, include Alfa Laval (Sweden), GEA Group (Germany), Krones Group (Germany), Paul Mueller (US), Praj Industries (India), Meura SA (Belgium), Della Toffola (Italy), Criveller Group (US), Kasper Schulz (Germany), Ningbo Lehui International Engineering Equipment Co., Ltd. (China), Hypro Group (India), and Shanghai Hengcheng Beverage Equipment Co., Ltd. (China). The beer processing market is highly competitive with the leading companies working hard in order to maintain their market positions while parallelly there are local and domestic companies arising in every region. The strong manufacturing regions such as Europe and North America show a high rise in the development of new companies in the market which strongly are emerging as exporters.
What kind of stakeholders would be interested in this market? What will be their go-to-market strategy, and which emerging market will be of significant interest?
The key stakeholders to beer processing market would be
- Manufacturers, importers & exporters, traders, distributors, and suppliers of brewery equipment
- Beer manufacturers
- Research & development institutions
- Regulatory bodies & government agencies
- Associations for breweries like the Brewers Association (BA), the Brewers of Europe, Craft Brewers Association of India
- Trade associations
What are the potential challenges to the beer processing market?
Competition from the top players which offer beer at low cost and with standard texture and taste every time is a mighty challenge to tackle with low investment. Apart from that other beverages with added health benefits are now preferred more due to incorporation of healthy lifestyle
What are the key market trends in the beer processing market?
The current key market trends depict that the demand for low alcohol beer has increased due to the healthy lifestyle influence. With availability of disposable income the population is shifting towards super premium beer and craft beer. Apart from these the on trade distribution channel still remains the first preference choice.
What are the key development strategies undertaken by companies in the beer processing market?
Strategies such as new product launches, investments into expansion and development, research initiatives are the key strategies being used by large players in order to achieve differential positioning in the global market .
To speak to our analyst for a discussion on the above findings, click Speak to Analyst
 Exclusive indicates content/data unique to MarketsandMarkets and not available with any competitors.
Table of Contents
1 Introduction (Page No. - 18)
1.1 Objectives of the Study
1.2 Market Definition
1.3 Market Scope
1.3.1 Periodization Considered
1.4 Currency Considered
1.5 Units
1.6 Stakeholders
2 Research Methodology (Page No. - 22)
2.1 Research Data
2.1.1 Secondary Data
2.1.1.1 Key Data From Secondary Sources
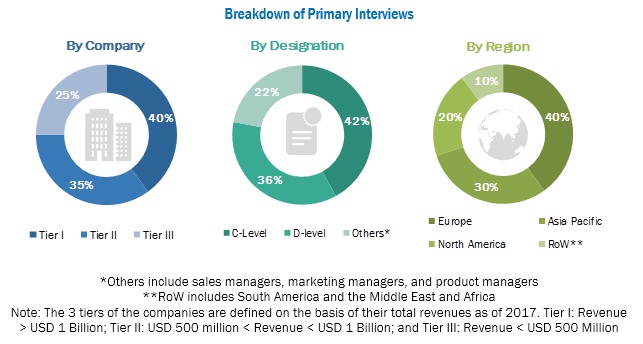
2.1.2 Primary Data
2.1.2.1 Breakdown of Primary Interviews
2.2 Market Size Estimation
2.2.1 Market Breakdown and Data Triangulation
2.3 Research Assumptions & Limitations
2.3.1 Assumptions
2.3.2 Limitations
3 Executive Summary (Page No. - 31)
4 Premium Insights (Page No. - 42)
4.1 Opportunities in the Beer Processing Market
4.2 Beer Market, By Price Category, 2019 vs 2025 (USD Billion)
4.3 Beer Market, By Distribution Channel, 2019 vs 2025 (USD Billion)
4.4 Brewery Equipment Market: Key Countries, 2018
4.5 Brewery Equipment Market, By Brewery Type, 2019 vs 2025 (USD Billion)
4.6 Macrobrewery Equipment Market Subsegments, 2019 vs 2025 (USD Million)
4.7 Craft Brewery Equipment Market Subsegments, 2019 vs 2025 (USD Million)
4.8 Europe: Brewery Equipment Market, By Brewery Type and Country, 2018
4.9 Asia Pacific: Beer Market, By Country, 2018
5 Market Overview (Page No. - 49)
5.1 Introduction
5.2 Market Dynamics
5.2.1 Drivers
5.2.1.1 Growing Number of Microbreweries and Brewpubs
5.2.1.2 Continuous Innovations in the Brewery Industry Driving the Demand For Advanced Brewery Equipment
5.2.1.3 Rising Trend of Low- Or No-Alcohol, and Organic Beer
5.2.2 Restraints
5.2.2.1 High Capital Investments and Maintenance Costs
5.2.2.2 Rising Power and Energy Costs
5.2.3 Opportunities in Beer Processing Market
5.2.3.1 Focus on Digitalization and Automation Using Iot and Big Data
5.2.3.2 Increasing Demand From Developing Economies Such as China, India, Vietnam, and South America
5.2.4 Challenges in Beer Processing Market
5.2.4.1 Competition From Craft Brewers and Top Players Offering Beer at A Low Cost
5.2.4.2 Competition From Other Beverages Offering Health Benefits
5.2.4.3 Competition From Other Substitutes of Alcoholic Beverages
6 Global Beer Market, By Beer Type (Page No. - 57)
6.1 Introduction
6.2 Lager
6.3 Specialty Beer
6.4 Ale and Stout
6.5 Low Alcohol Beer
7 Global Beer Market, By Price Category (Page No. - 61)
7.1 Introduction
7.2 Mainstream
7.3 Discount
7.4 Premium
7.5 Super-Premium
8 Global Beer Market, By Distribution Channel (Page No. - 65)
8.1 Introduction
8.2 Off-Trade/Off-Premise Channels
8.3 On-Trade/On-Premise Channels
9 Global Brewery Equipment Market, By Brewery Type (Page No. - 69)
9.1 Introduction
9.2 Macrobrewery
9.2.1 Presence of Large Beer Manufacturers and Their Expansion Plans Drive the Demand For Macrobrewery Equipment
9.3 Craft Brewery
9.3.1 Microbrewery
9.3.1.1 Rise in Demand For Handcrafted Beer to Drive the Microbrewery Equipment
9.3.2 Brewpub
9.3.2.1 Change in Socio-Cultural Dynamics to Enhance the Brewpub Equipment Market
9.3.3 Others
9.3.3.1 Regional and Farm Breweries to Contribute to the Share of Craft Brewery Equipment Market
10 Global Brewery Equipment Market, By Equipment Type (Page No. - 76)
10.1 Introduction
10.2 Macrobrewery Equipment
10.2.1 Milling Equipment
10.2.2 Brewhouse
10.2.2.1 Mash Kettle
10.2.2.2 Lauter Tun
10.2.2.3 Wort Kettle
10.2.2.4 Whirlpooler
10.2.2.5 Steam Generator
10.2.2.6 Others
10.2.3 Cooling Equipment
10.2.4 Fermentation Equipment
10.2.4.1 Yeast Management System
10.2.5 Filtration & Filling Equipment
10.2.6 Others
10.2.6.1 Cleaning System
10.2.6.2 Spent Grain Silos
10.2.6.3 Generators
10.2.6.4 Bright Beer Tanks
10.2.6.5 Compressors
10.2.6.6 Pipes
10.3 Craft Brewery Equipment
10.3.1 Mashing Equipment
10.3.2 Fermentation Equipment
10.3.3 Cooling Equipment
10.3.4 Storage Equipment
10.3.5 Compressors
10.3.6 Others
11 Global Beer Processing Market, By Region* (Page No. - 93)
11.1 Introduction
11.2 North America
11.2.1 US
11.2.1.1 Growing Retail Distribution Network in the Country is the Major Driving Force For the Beer Market
11.2.2 Canada
11.2.2.1 Growing Number of Breweries in the Country Fueling the Growth of Beer Industry
11.2.3 Mexico
11.2.3.1 Growing Number of Expansions and Acquisitions in the Beer Market Drive the Beer Processing Market Growth
11.3 Europe
11.3.1 Germany
11.3.1.1 Germany, With the Largest Base of Breweries, Dominates the European Market
11.3.2 UK
11.3.2.1 Demand For Premium Beer Driving the Craft Brewery Market in the Country
11.3.3 France
11.3.3.1 Growth of the Beer Market Driven By Demand For Microbreweries
11.3.4 Italy
11.3.4.1 Growing Per Capita Consumption of Beer Driving the Demand For Craft Breweries
11.3.5 Switzerland
11.3.5.1 Rise in Demand For Premium and Artisanal Beer Driving the Growth of Craft Brewery Equipment in the Country
11.3.6 Rest of Europe
11.3.6.1 Abundant Raw Material Resources in the Rest of European Countries Led to the Expansion of Breweries
11.4 Asia Pacific
11.4.1 China
11.4.1.1 Adoption of Mini-Drinks Production Line and Rising Investment By Leading Breweries Driving the Beer Processing Market Growth
11.4.2 India
11.4.2.1 Growing Investment By International Beer Processors Driving the Beer Processing Market Growth
11.4.3 Japan
11.4.3.1 Government Intervention Through Tax Revisions For Increased Sales Driving the Beer Processing Market
11.4.4 Australia
11.4.4.1 Innovations in the Production Process and Quality Ingredients to Enhance the Taste & Flavor is A Major Trend in the Country
11.4.5 New Zealand
11.4.5.1 Tourism, and Innovations in Low-Alcohol Beer are Driving the Market For Craft Brewery
11.4.6 Rest of Asia Pacific
11.4.6.1 Growing Trend of Craft Beer in Countries Such as Thailand and Vietnam Drive the Beer Processing Market Growth
11.5 Rest of the World (RoW)
11.5.1 South America
11.5.1.1 Establishment of Large Breweries and Demand For Premium and Super Premium Beers are Driving the Beer Processing Market
11.5.2 the Middle East & Africa
11.5.2.1 Tourism Industry and Footfall of Expats to Upsurge Growth of Beer Industry
12 Competitive Landscape (Page No. - 141)
12.1 Overview
12.2 Competitive Leadership Mapping
12.2.1 Visionary Leaders
12.2.2 Innovators
12.2.3 Dynamic Differentiators
12.2.4 Emerging Companies
12.3 Competitive Benchmarking
12.3.1 Strength of Product Portfolio (Brewery Equipment Market)
12.3.2 Strength of Product Portfolio (Beer Market)
12.3.3 Business Strategy Excellence (Brewery Equipment Market)
12.3.4 Business Strategy Excellence (Beer Market)
12.4 Ranking of Key Players, 2018
12.5 Competitive Scenario
12.5.1 New Product Launches
12.5.2 Expansions
12.5.3 Acquisitions
12.5.4 Agreements, Collaborations, and Partnerships
13 Company Profiles (Page No. - 155)
(Business Overview, Products Offered, Recent Developments, SWOT Analysis, MnM View)*
13.1 Brewery Equipment Market
13.1.1 Alfa Laval
13.1.2 GEA Group
13.1.3 Krones Group
13.2.4 Molson Coors Brewing Company (MCBC)
13.1.5 Paul Mueller
13.1.6 Ningbo Lehui International Engineering Equipment Co., Ltd.
13.2 Beer Market
13.2.1 Anheuser Busch Inbev Nv (BUD)
13.2.2 Heineken
13.2.3 Carlsberg Group
13.2.4 Molson Coors Brewing Company (MCBC)
13.2.5 Asahi Group Holdings
13.2.6 Tsingtao Brewery Group
*Details on Business Overview, Products Offered, Recent Developments, SWOT Analysis, MnM View Might Not Be Captured in Case of Unlisted Companies.
14 Appendix (Page No. - 196)
14.1 Discussion Guide
14.2 Knowledge Store: Marketsandmarkets’ Subscription Portal
14.3 Available Customizations
14.4 Related Reports
14.5 Author Details
List of Tables (107 Tables)
Table 1 USD Exchange Rates Considered, 2013–2017
Table 2 Some of the Innovations That Recently Took Place in the Commercial Brewery Equipment Market Include:
Table 3 Initial Equipment Cost For A Microbrewery Plant
Table 4 Beer Market Size, By Beer Type, 2017–2025 (USD Billion)
Table 5 Beer Market Size, By Beer Type, 2017–2025 (Billion Liters)
Table 6 Beer Market Size, By Price Category, 2017–2025 (USD Billion)
Table 7 Beer Market Size, By Price Category, 2017–2025 (Billion Liters)
Table 8 Beer Market Size, By Distribution Channel, 2017–2025 (USD Billion)
Table 9 Beer Market Size, By Distribution Channel, 2017–2025 (Billion Liters)
Table 10 Brewery Equipment Market Size, By Brewery Type, 2017–2025 (USD Million)
Table 11 Craft Brewery Equipment Market Size, By Type, 2017–2025 (USD Million)
Table 12 Macrobrewery: Brewery Equipment Market Size, By Region, 2017–2025 (USD Million)
Table 13 Craft Brewery: Brewery Equipment Market Size, By Region, 2017–2025 (USD Million)
Table 14 Microbrewery: Craft Brewery Equipment Market Size, By Region, 2017–2025 (USD Million)
Table 15 Brewpub: Craft Brewery Equipment Market Size, By Region, 2017–2025 (USD Million)
Table 16 Others: Craft Brewery Equipment Market Size, By Region, 2017–2025 (USD Million)
Table 17 Macrobrewery Equipment Market Size, By Type, 2017–2025 (USD Million)
Table 18 Milling Equipment: Macrobrewery Equipment Market Size, By Region, 2017–2025 (USD Million)
Table 19 Brewhouse: Macrobrewery Equipment Market Size, By Region,2017–2025 (USD Million)
Table 20 Cooling Equipment: Macrobrewery Equipment Market Size, By Region, 2017–2025 (USD Million)
Table 21 Fermentation Equipment: Macrobrewery Equipment Market Size, By Region, 2017–2025 (USD Million)
Table 22 Filtration & Filling Equipment: Macrobrewery Equipment Market Size, By Region, 2017–2025 (USD Million)
Table 23 Others: Macrobrewery Equipment Market Size, By Region, 2017–2025 (USD Million)
Table 24 Craft Brewery Equipment Market Size, By Type, 2017–2025 (USD Million)
Table 25 Mashing Equipment: Craft Brewery Equipment Market Size, By Region, 2017–2025 (USD Million)
Table 26 Fermentation Equipment: Craft Brewery Equipment Market Size, By Region, 2017–2025 (USD Million)
Table 27 Cooling Equipment: Craft Brewery Equipment Market Size, By Region, 2017–2025 (USD Million)
Table 28 Storage Equipment: Craft Brewery Equipment Market Size, By Region, 2017–2025 (USD Million)
Table 29 Compressors: Craft Brewery Equipment Market Size, By Region, 2017–2025 (USD Million)
Table 30 Others: Craft Brewery Equipment Market Size, By Region, 2017–2025 (USD Million)
Table 31 Beer Market Size, By Region, 2017–2025 (USD Billion)
Table 32 Beer Market Size, By Region, 2017–2025 (Billion Liters)
Table 33 Brewery Equipment Market Size, By Region, 2017–2025 (USD Billion)
Table 34 Macrobrewery Equipment Market Size, By Region, 2017–2025 (USD Billion)
Table 35 Craft Brewery Equipment Market Size, By Region, 2017–2025 (USD Billion)
Table 36 North America: Beer Market Size, By Country, 2017–2025 (Billion Liters)
Table 37 North America: Brewery Equipment Market Size, By Country, 2017–2025 (USD Million)
Table 38 North America: Macrobrewery Equipment Market Size, By Country, 2017–2025 (USD Million)
Table 39 North America: Craft Brewery Equipment Market Size, By Country, 2017–2025 (USD Million)
Table 40 North America: Brewery Equipment Market Size, By Brewery Type, 2017–2025 (USD Billion)
Table 41 North America: Craft Brewery Equipment Market Size, By Craft Brewery Type, 2017–2025 (USD Million)
Table 42 North America: Macrobrewery Equipment Market Size, By Equipment Type, 2017–2025 (USD Million)
Table 43 North America: Craft Brewery Equipment Market Size, By Equipment Type, 2017–2025 (USD Million)
Table 44 Number of Breweries in the Us, 2014–2018
Table 45 US: Brewery Equipment Market Size, By Brewery Type, 2017–2025 (USD Billion)
Table 46 US: Craft Brewery Equipment Market Size, By Craft Brewery Type, 2017–2025 (USD Million)
Table 47 Canada: Brewery Equipment Market Size, By Brewery Type, 2017–2025 (USD Million)
Table 48 Canada: Craft Brewery Equipment Market Size, By Craft Brewery Type, 2017–2025 (USD Million)
Table 49 Mexico: Brewery Equipment Market Size, By Brewery Type, 2017–2025 (USD Million)
Table 50 Mexico: Craft Brewery Equipment Market Size, By Craft Brewery Type, 2017–2025 (USD Million)
Table 51 Europe: Beer Market Size, By Country, 2017–2025 (Billion Liters)
Table 52 Europe: Brewery Equipment Market Size, By Country, 2017–2025 (USD Million)
Table 53 Europe: Macrobrewery Equipment Market Size, By Country, 2017–2025 (USD Million)
Table 54 Europe: Craft Brewery Equipment Market Size, By Country, 2017–2025 (USD Million)
Table 55 Europe: Brewery Equipment Market Size, By Brewery Type, 2017–2025 (USD Billion)
Table 56 Europe: Craft Brewery Equipment Market Size, By Brewery Type, 2017–2025 (USD Million)
Table 57 Europe: Macrobrewery Equipment Market Size, By Equipment Type, 2017–2025 (USD Million)
Table 58 Europe: Craft Brewery Equipment Market Size, By Equipment Type, 2017–2025 (USD Million)
Table 59 Germany: Brewery Equipment Market Size, By Brewery Type, 2017–2025 (USD Million)
Table 60 Germany: Craft Brewery Equipment Market Size, By Brewery Type, 2017–2025 (USD Million)
Table 61 UK: Brewery Equipment Market Size, By Brewery Type, 2017–2025 (USD Million)
Table 62 UK: Craft Brewery Equipment Market Size, By Brewery Type, 2017–2025 (USD Million)
Table 63 France: Brewery Equipment Market Size, By Brewery Type, 2017–2025 (USD Million)
Table 64 France: Craft Brewery Equipment Market Size, By Brewery Type, 2017–2025 (USD Million)
Table 65 Italy: Brewery Equipment Market Size, By Brewery Type, 2017–2025 (USD Million)
Table 66 Italy: Craft Brewery Equipment Market Size, By Brewery Type, 2017–2025 (USD Million)
Table 67 Switzerland: Brewery Equipment Market Size, By Brewery Type, 2017–2025 (USD Million)
Table 68 Switzerland: Craft Brewery Equipment Market Size, By Brewery Type, 2017–2025 (USD Million)
Table 69 Rest of Europe: Brewery Equipment Market Size, By Brewery Type, 2017–2025 (USD Million)
Table 70 Rest of Europe: Craft Brewery Equipment Market Size, By Brewery Type, 2017–2025 (USD Million)
Table 71 Asia Pacific: Beer Market Size, By Country, 2017–2025 (Billion Liters)
Table 72 Asia Pacific: Brewery Equipment Market Size, By Country, 2017–2025 (USD Million)
Table 73 Asia Pacific: Macrobrewery Equipment Market Size, By Country, 2017–2025 (USD Million)
Table 74 Asia Pacific: Craft Brewery Equipment Market Size, By Country, 2017–2025 (USD Million)
Table 75 Asia Pacific: Brewery Equipment Market Size, By Brewery Type, 2017–2025 (USD Million)
Table 76 Asia Pacific: Craft Brewery Equipment Market Size, By Craft Brewery Type, 2017–2025 (USD Million)
Table 77 Asia Pacific: Macrobrewery Equipment Market Size, By Equipment Type, 2017–2025 (USD Million)
Table 78 Asia Pacific: Craft Brewery Equipment Market Size, By Equipment Type, 2017–2025 (USD Million)
Table 79 China: Brewery Equipment Market Size, By Brewery Type, 2017–2025 (USD Million)
Table 80 China: Craft Brewery Equipment Market Size, By Craft Brewery Type, 2017–2025 (USD Million)
Table 81 India: Brewery Equipment Market Size, By Brewery Type, 2017–2025 (USD Million)
Table 82 India: Craft Brewery Equipment Market Size, By Craft Brewery Type, 2017–2025 (USD Million)
Table 83 Japan: Brewery Equipment Market Size, By Brewery Type, 2017–2025 (USD Million)
Table 84 Japan: Craft Brewery Equipment Market Size, By Craft Brewery Type, 2017–2025 (USD Million)
Table 85 Australia: Brewery Equipment Market Size, By Brewery Type, 2017–2025 (USD Million)
Table 86 Australia: Craft Brewery Equipment Market Size, By Craft Brewery Type, 2017–2025 (USD Million)
Table 87 New Zealand: Brewery Equipment Market Size, By Brewery Type, 2017–2025 (USD Million)
Table 88 New Zealand: Craft Brewery Equipment Market Size, By Craft Brewery Type, 2017–2025 (USD Million)
Table 89 Rest of Asia Pacific: Brewery Equipment Market Size, By Brewery Type, 2017–2025 (USD Million)
Table 90 Rest of Asia Pacific: Craft Brewery Equipment Market Size, By Craft Brewery Type, 2017–2025 (USD Million)
Table 91 RoW: Beer Market Size, By Country, 2017–2025 (USD Billion)
Table 92 RoW: Beer Market Size, By Country, 2017–2025 (Billion Liters)
Table 93 RoW: Brewery Equipment Market Size, By Country, 2017–2025 (USD Million)
Table 94 RoW: Macrobrewery Equipment Market Size, By Country, 2017–2025 (USD Million)
Table 95 RoW: Craft Brewery Equipment Market Size, By Country, 2017–2025 (USD Million)
Table 96 RoW: Brewery Equipment Market Size, By Brewery Type, 2017–2025 (USD Million)
Table 97 RoW: Craft Brewery Equipment Market Size, By Craft Brewery Type, 2017–2025 (USD Million)
Table 98 RoW: Macrobrewery Equipment Market Size, By Equipment Type, 2017–2025 (USD Million)
Table 99 RoW: Craft Brewery Equipment Market Size, By Equipment Type, 2017–2025 (USD Million)
Table 100 South America: Brewery Equipment Market Size, By Brewery Type, 2017–2025 (USD Million)
Table 101 South America: Craft Brewery Equipment Market Size, By Craft Brewery Type, 2017–2025 (USD Million)
Table 102 Middle East & Africa: Brewery Equipment Market Size, By Brewery Type, 2017–2025 (USD Million)
Table 103 Middle East & Africa: Craft Brewery Equipment Market Size, By Craft Brewery Type, 2017–2025 (USD Million)
Table 104 New Product Launches, 2014-2019
Table 105 Expansions, 2014-2019
Table 106 Acquisitions, 2014-2019
Table 107 Agreements, Collaborations, and Partnerships, 2014-2019
List of Figures (83 Figures)
Figure 1 Beer Processing Market Segmentation
Figure 2 Beer Processing Market: Geographic Scope
Figure 3 Beer Processing Market: Research Design
Figure 4 Breakdown of Primary Interviews: By Company Type, Designation, and Region
Figure 5 Market Size Estimation Methodology: Top-Down Approach (Beer Market)
Figure 6 Market Size Estimation Methodology: Top-Down Approach (Brewery Equipment Market)
Figure 7 Market Size Estimation Methodology: Bottom-Up Approach (Beer Market)
Figure 8 Market Size Estimation Methodology: Bottom-Up Approach (Brewery Equipment Market)
Figure 9 Market Breakdown and Data Triangulation
Figure 10 Beer Market Size, By Beer Type, 2019 vs 2025 (USD Billion)
Figure 11 Beer Market Size, By Price Category, 2019 vs 2025 (USD Billion)
Figure 12 Beer Market Size, By Distribution Channel, 2019 vs 2025 (USD Billion)
Figure 13 Brewery Equipment Market Size, By Brewery Type, 2019 vs 2025 (USD Billion)
Figure 14 Macrobrewery Equipment Market Size, By Equipment Type, 2019 vs 2025 (USD Million)
Figure 15 Craft Brewery Equipment Market Size, By Equipment Type, 2019 vs 2025 (USD Million)
Figure 16 North America to Grow at the Highest Cagr in the Brewery Equipment Market From 2019 to 2025
Figure 17 RoW to Grow at the Highest CAGR in the Beer Market From 2019 to 2025
Figure 18 Brewery Equipment Market Share and Growth (Value), By Region
Figure 19 Beer Market Share and Growth (Volume), By Region
Figure 20 The Growing Demand For Innovative Beer Products is Expected to Drive the Global Beer Market
Figure 21 Growing Number of Microbreweries and Continuous Innovation in the Brewery Equipment Market Driving the Global Market For Brewery Equipment
Figure 22 The Mainstream Segment Dominated the Market
Figure 23 The On-Trade Segment Dominated the Beer Processing Market
Figure 24 Germany Dominated The Brewery Equipment Market in 2018
Figure 25 Macrobrewery Segment to Dominate the Beer Processing Market Throughout 2025
Figure 26 The Fermentation Equipment Subsegment Dominated the Macrobrewery Equipment Segment
Figure 27 The Compressors Subsegment Dominated the Craft Brewery Equipment Segment
Figure 28 Germany Accounted For The Largest Share in 2018
Figure 29 China Accounted For the Largest Share in Volume Terms, 2018
Figure 30 Beer Processing Market: Market Dynamics
Figure 31 Number of Microbreweries in Europe, By Major Countries, 2012 vs 2017
Figure 32 Total Number of Craft Breweries in The Us, 2012–2017
Figure 33 Beer Market Size, By Beer Type, 2019 vs 2025 (USD Billion)
Figure 34 Beer Market Size, By Price Category, 2019 vs 2025 (USD Billion)
Figure 35 Beer Market Size, By Distribution Channel, 2019 vs 2025 (USD Billion)
Figure 36 Brewery Equipment Market Size, By Brewery Type, 2019 vs 2025 (USD Million)
Figure 37 Macrobrewery: Brewery Equipment Market Size, By Region, 2019 vs 2025 (USD Million)
Figure 38 Basic Brewing Process
Figure 39 Macrobrewery Equipment Market Size, By Type, 2019 vs 2025 (USD Million)
Figure 40 Fermentation Equipment: Macrobrewery Equipment Market Size, By Region, 2019 vs 2025 (USD Million)
Figure 41 Craft Brewery Equipment Market Size, By Type, 2019 vs 2025 (USD Million)
Figure 42 Compressors: Craft Brewery Equipment Market Size, By Type, 2019 vs 2025 (USD Million)
Figure 43 Australia to Record the Highest Growth Rate During the Forecast Period in the Brewery Equipment Market
Figure 44 Mexico to Record the Highest Growth Rate During the Forecast Period in the Beer Market
Figure 45 North America: Beer Processing Market Snapshot
Figure 46 Total Retail Establishments Selling Alcohol in the Us, 2008–2018
Figure 47 Number of Breweries in Canada, 2013-2017
Figure 48 Europe: Beer Processing Market Snapshot
Figure 49 Number of Active Breweries in Germany, 2013–2017
Figure 50 UK: Number of Active Breweries, 2011–2017
Figure 51 France: Beer Consumption, 2013–2017 (‘000 Hectoliter)
Figure 52 France: Number of Microbreweries, 2011–2017
Figure 53 Italy: Beer Consumption, 2013–2017 (‘000 Hectoliter)
Figure 54 Switzerland: Total Number of Active Breweries and Microbreweries, 2011–2017
Figure 55 Rest of Europe: Number of Active Breweries, 2011–2017
Figure 56 Asia Pacific: Beer Processing Market Snapshot
Figure 57 Alcohol Available For Consumption, 2017
Figure 58 Global Brewery Equipment Market: Competitive Leadership Mapping, 2018
Figure 59 Global Beer Market: Competitive Leadership Mapping, 2018
Figure 60 The Alfa Laval Led the Brewery Equipment Market In, 2018
Figure 61 Anheuser Busch Inbev Led the Beer Market In, 2018
Figure 62 Alfa Laval: Company Snapshot
Figure 63 Alfa Laval: SWOT Analysis
Figure 64 GEA Group: Company Snapshot
Figure 65 GEA Group: SWOT Analysis
Figure 66 Krones Group: Company Snapshot
Figure 67 Krones Group: SWOT Analysis
Figure 68 Praj Industries: Company Snapshot
Figure 69 Praj Industries: SWOT Analysis
Figure 70 Paul Mueller: Company Snapshot
Figure 71 Paul Mueller: SWOT Analysis
Figure 72 AB Inbev: Company Snapshot
Figure 73 AB Inbev: SWOT Analysis
Figure 74 Heineken: Company Snapshot
Figure 75 Heineken Group: SWOT Analysis
Figure 76 Carlsberg Group: Company Snapshot
Figure 77 Carlsberg Group: SWOT Analysis
Figure 78 Molson Coors: Company Snapshot
Figure 79 Molson Coors: Company Snapshot
Figure 80 Asahi Group Holding: Company Snapshot
Figure 81 Asahi Group: SWOT Analysis
Figure 82 Tsingtao Brewery Group: Company Snapshot
Figure 83 Tsingtao Brewery Group: SWOT Analysis
The beer processing market studied in this report involves four major activities to estimate the current market size for the brewery equipment and beer market. Exhaustive secondary research was done to collect information on the market, the peer market, and parent market. The next step was to validate these findings, assumptions, and sizing with industry experts across the value chain through primary research. Both the top-down and bottom-up approaches were employed to estimate the complete market size. After that, market breakdown and data triangulation were used to estimate the market size of segments and subsegments.
Secondary Research
In the secondary research process, various secondary sources were referred to (such as directories and databases)—Hoovers, Bloomberg BusinessWeek, and Dun & Bradstreet (which acquired Avention)—to identify and collect information useful for the study of the beer processing market. These secondary sources included annual reports, press releases & investor presentations of companies, white papers, certified publications, articles by recognized authors, gold standard & silver standard websites, food safety organizations, regulatory bodies, trade directories, and databases.
Primary Research
The beer processing market includes several stakeholders in the supply chain—equipment manufacturers, raw material suppliers, beer processors, importers & exporters, traders, distributors, regulatory organizations, and suppliers. The beer processors characterize the demand side of the market for the brewing equipment industry and consumers for the beer industry. The supply side is characterized by the presence of key manufacturers of brewery equipment and raw material (grains, yeast, plastic, glass, aluminum) suppliers for the beer industry. Various primary sources from the supply and demand sides of both markets were interviewed to obtain qualitative and quantitative information.
To know about the assumptions considered for the study, download the pdf brochure
Market Size Estimation
Both the top-down and bottom-up approaches were used to estimate and validate the total size of the beer processing market (brewery equipment and beer industry). These methods were also used extensively to estimate the size of various subsegments in the market. The research methodology used to estimate the market size includes the following:
- Key players in the industry and markets were identified through extensive secondary research.
- The industry’s supply chain and market size, in terms of value, were determined through primary and secondary research processes.
- All percentage shares, splits, and breakdowns were determined using secondary sources and verified through primary sources.
Data Triangulation
After arriving at the overall market size, using the market size estimation processes as explained above—the market was split into several segments and subsegments. To complete the overall market engineering process and arrive at the exact statistics of each market segment and subsegment, the data triangulation, and market breakdown procedures were employed, wherever applicable. The data was triangulated by studying various factors and trends from both the demand and supply sides. Also, the market size was validated using both the top-down and bottom-up approaches.
Report Objectives
-
Determining the beer processing market with the following:
- Determining and projecting the size of the beer market, with respect to beer type, price category, distribution channel, and region, over six years ranging from 2019 to 2025
- Determining and projecting the size of the brewery equipment market, with respect to brewery type, equipment type, and region, over six years ranging from 2019 to 2025
- Identifying the attractive opportunities in the market by determining the largest and fastest-growing segments across the key regions
-
Analyzing the demand-side factors based on the following:
- Impact of macro- and microeconomic factors on the market
- Shifts in demand patterns across different subsegments and regions
- Identifying and profiling key market players in the beer processing market (brewery equipment and beer market).
- Determining the market share of key players operating in the beer processing market (brewery equipment and beer market)
-
Providing a comparative analysis of the market leaders based on the following:
- Product offerings
- Business strategies
- Strengths and weaknesses
- Key financials
- Understanding the competitive landscape and identifying the major growth strategies adopted by players across the key regions
Available Customizations
With the given market data, MarketsandMarkets offers customizations according to company-specific scientific needs. The following customization options are available for the report:
Product Analysis
- Product matrix, which provides a detailed comparison of the product portfolio of each company
Segmental Analysis
- Further breakdown of other brewery equipment type, by region, in the beer processing market
- Further breakdown of other brewery type in the beer processing market
- Further breakdown of beer type, by region, in the beer processing market
- Further breakdown of the distribution channel in the beer processing market
- Further breakdown of beer by price category in the beer processing market
Geographic Analysis
- Further breakdown of the Rest of Asia Pacific beer processing market, by key country
- Further breakdown of the Rest of European beer processing market, by key country
- Further breakdown of the Rest of the World beer processing market, by key country
Company Information
- · Detailed analysis and profiling of additional market players (up to five)


Growth opportunities and latent adjacency in Beer Processing Market