Global Biocide Market - By Types, Applications, Trends & Forecast (2011 � 2016)


Biocides are substances that kill or inhibit all life forms when introduced in sufficient concentration and/or duration. They are used to control harmful organisms and control bacterial and fungal growth. Different types of biocide such as halogen compounds, metallic compounds, organosulfurs, organic acids, phenolic, etc. are used for various applications in personal care, water treatment, wood preservation, food and beverage, paints and coatings, and others. Growth in water treatment market on account of increasing water consumption due to population growth, changing food habits, and climate change is a major driver for global biocide market.
Biocides are also used as additives in polymers for preventing the growth of bacteria or fungi and also to prevent degradation of polymer�s physical and sensorial properties, both within the material and at its surface. The incorporation of biocides in plastics and rubbers helps in reducing cost and effort required in cleaning especially, in demanding sectors such as food processing plants, hospitals, and home care.
Biocides are becoming compliant to environment regulations as more and more companies are meeting the regulations. The newer breed of biocide, which have lesser environmental impact and better performance features are key drivers of the biocide market. Higher priced specialty biocides are providing stiff competition to the commodity biocides.
Biocide market is also witnessing an increase in demand for environmentally friendly biocides in disinfectants and sanitizers in household, industrial, and institutional cleaners as compared to other biocide formulations. Other applications of biocides such as health care industry are growing due to increasing health consciousness thus leading to need for protection from infections.
The best growth opportunities for the biocide products are in the Asia-Pacific and Eastern Europe region, whereas mature North American and West European markets are predictable to register a modest growth. Moreover, China will be the fastest-growing country in global biocide market as its strong economic growth continues. In mature markets such as the U.S., Western Europe, and Japan, growth will be driven more by a shift to higher value products rather than by significant volume pick-up.
We have used various secondary sources such as encyclopedia, directories, and databases to identify and collect information useful for this extensive commercial study of biocide market. The primary sources � experts from related industries and suppliers have been interviewed to obtain and verify critical information as well as to assess the future prospects of biocides.
We have also profiled leading players of this industry with their recent developments and other strategic industry activities. These include : Albemarle Corporation (U.S.), AkzoNobel N.V. (The Netherlands), Ashland Inc. (U.S.), Baker Hughes Incorporated (U.S.), BASF SE (Germany), Champion Technologies (U.S.), Clariant AG (Switzerland), Cortec Corporation (U.S.), The Dow Chemical Company (U.S.), FMC Corporation (U.S.), GE Water and Process Technologies (U.S.), Kemira Oyj (Finland), Lubrizol Corporation (U.S.), LANXESS AG (Germany), Lonza Group Ltd (Switzerland), Nalco Holding Company (U.S.), Thor Group Limited (U.K.), Troy Corporation (U.S.).
Scope of the report
This biocides market research report categorizes the global market on the basis of applications, product types, and geography; forecasting volume and revenue and analyzing trends in each of the submarkets:
On the basis of applications:
The biocide market is segmented on the basis of end-user applications such as: Personal care, water treatment, wood preservation, food and beverage, and paints and coatings. Each application is further described in detail in the report with volume and revenue forecasted for each application.
On the basis of product type:
Halogen compounds, metallic compounds, organosulfurs, organic acids, and phenolic.
On the basis of geography:
North America, Europe, Asia-Pacific, and ROW and key countries in every region.
Please click here to get the updated version of Biocides Market By Type (Halogen Compounds, Metallic Compounds, Organosulfurs, Organic Acid, Phenolics), Application (Personal Care, Water Treatment, Wood Preservation, Food & Beverages, Paints & Coatings) - Global Trends & Forecasts to 2018
Biocides are used to control harmful organisms and control bacterial and fungal growth. Major types of biocide include halogen compounds, metallic compounds, organosulfurs, organic acids and phenolic. They are used for various applications in personal care, water treatment, wood preservation, food and beverage, paints and coatings, and others.
Biocide market is witnessing an increase in demand on account of growing demand of water and entry of environmentally friendly products. However, growth in the market is hindered by rising raw material costs and difficult and expensive registration process.
The global market for biocide in terms of revenue was estimated to be worth $7.2 billion in 2010 and is expected to reach $9.4 billion by 2016, growing at a CAGR of 4.3% from 2011 to 2016. North America dominated the global biocide market, accounting for 45.0% of the global biocide demand in 2010. Asia-Pacific is expected to be the fastest growing market in the near future owing to the rapid advancement and increasing demand from key countries such as China and India.
Biocide Market Share, By Geography, 2010
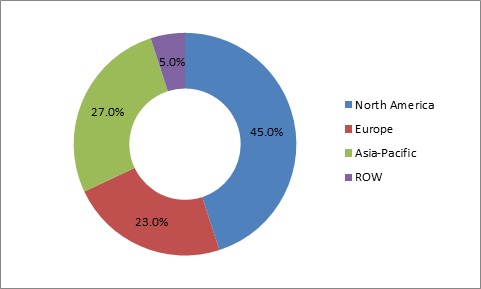
Source: Coaings World, ICIS, MarketsandMarkets Analysis
Market participants are continuously focusing on the Asia-Pacific region to gain market share and improve profitability. Since biocides are specialty chemicals their market is price sensitive. Market participants have thus shifted their focus on product differentiation through innovation. Patents have become common in the market as participants look to capture market share by differentiating on new technologies. The number of patents that have been filed increased due to new product development across the globe. As the consumption level for biocide increased in various applications such as water treatment and wood preservative, the number of patents filings by players also registered an increasing trend. The report also analyzes market share of leading producers, key developments, and strategies deployed to win the market.
Key participants in the global biocide market include AkzoNobel N.V. (The Netherlands), Ashland Inc. (U.S.), BASF SE (Germany), Champion Technologies (U.S.), Clariant AG (Switzerland), Cortec Corporation (U.S.), LANXESS AG (Germany), Lonza Group Ltd (Switzerland), Nalco Holding Company (U.S.), Thor Group Limited (U.K.), and Troy Corporation (U.S.).
 Exclusive indicates content/data unique to MarketsandMarkets and not available with any competitors.
TABLE OF CONTENTS
1 INTRODUCTION
1.1 KEY TAKE-AWAYS
1.2 REPORT DESCRIPTION
1.3 MARKETS COVERED
1.4 STAKEHOLDERS
1.5 RESEARCH METHODOLOGY
1.5.1 MARKET SIZE
1.5.2 KEY DATA POINTS TAKEN FROM SECONDARY SOURCES
1.5.3 LIST OF SECONDARY SOURCES
1.5.4 KEY DATA POINTS TAKEN FROM PRIMARY SOURCES
1.5.5 ASSUMPTIONS MADE FOR THIS REPORT
1.5.6 LIST OF COMPANIES COVERED DURING PRIMARIES
1.5.7 KEY QUESTIONS ANSWERED
2 EXECUTIVE SUMMARY
3 MARKET OVERVIEW
3.1 INTRODUCTION
3.2 GLOBAL BIOCIDE MARKET LANDSCAPE
3.3 MARKET SHARE ANALYSIS
3.4 MARKET DYNAMICS
3.4.1 DRIVERS
3.4.1.1 Increasing demand for water
3.4.1.2 Environmental regulations & low and zero voc coatings are driving biocide market
3.4.2 RESTRAINTS
3.4.2.1 Rising raw material cost
3.4.2.2 Lengthy & expensive registration process
3.4.3 OPPORTUNITIES
3.4.3.1 High growth rate in asia-pacific region & eastern europe
3.4.3.2 New applications in plastics
3.5 BURNING ISSUE
3.5.1 GREEN TREND AFFECTS BIOCIDE DEMAND
3.6 WINNING IMPERATIVES
3.6.1 NEW PRODUCT INNOVATION
3.7 RAW MATERIAL ANALYSIS
3.7.1 BROMINE
3.7.2 SULFUR
3.7.3 CHLORINE
3.7.4 AMMONIA
3.8 PORTER�S FIVE FORCES
3.8.1 BARGAINING POWER OF SUPPLIERS
3.8.2 BARGAINING POWER OF BUYERS
3.8.3 THREAT OF NEW ENTRANTS
3.8.4 THREAT OF SUBSTITUTES
3.8.5 DEGREE OF COMPETITION
3.9 POLICY & REGULATIONS
3.9.1 REACH
3.9.2 BIOCIDE PRODUCT DIRECTIVE (BPD)
3.9.3 FIFRA
3.9.4 PEST MANAGEMENT REGULATORY AGENCY (PMRA)
3.9.5 ENVIRONMENTAL PROTECTION AGENCY (EPA)
3.10 VALUE CHAIN ANALYSIS
3.11 PATENT ANALYSIS
3.12 PRICE ANALYSIS
4 GLOBAL BIOCIDE MARKET, BY TYPES
4.1 INTRODUCTION
4.2 HALOGEN COMPOUNDS
4.3 METALLIC COMPOUNDS
4.4 ORGANOSULFURS
4.5 ORGANIC ACIDS
4.6 PHENOLIC
4.7 OTHERS
4.7.1 NITROGEN COMPOUNDS
4.7.2 GLUTARALDEHYDE
5 GLOBAL BIOCIDE MARKET, BY APPLICATIONS
5.1 INTRODUCTION
5.2 PERSONAL CARE
5.3 WATER TREATMENT
5.4 WOOD PRESERVATION
5.5 FOOD & BEVERAGE
5.6 PAINTS & COATINGS
6 GEOGRAPHICAL ANALYSIS
6.1 INTRODUCTION
6.2 NORTH AMERICA
6.3 EUROPE
6.4 ASIA-PACIFIC
6.5 REST OF THE WORLD
7 COMPETITIVE LANDSCAPE
7.1 INTRODUCTION
7.2 MERGERS & ACQUISITIONS
7.3 PARTNERSHIPS/COLLABORATIONS/JOINT VENTURES/AGREEMENTS/CONTRACTS
7.4 NEW PRODUCTS LAUNCH
7.5 INVESTMENTS, EXPANSIONS & OTHER DEVELOPMENTS
8 COMPANY PROFILES
8.1 AKCROS CHEMICALS LTD
8.1.1 OVERVIEW
8.1.2 FINANCIALS
8.1.3 PRODUCTS & SERVICES
8.1.4 STRATEGY
8.1.5 DEVELOPMENTS
8.2 AKZONOBEL N.V.
8.2.1 OVERVIEW
8.2.2 FINANCIALS
8.2.3 PRODUCTS & SERVICES
8.2.4 STRATEGY
8.2.5 DEVELOPMENTS
8.3 ALBEMARLE CORPORATION
8.3.1 OVERVIEW
8.3.2 FINANCIALS
8.3.3 PRODUCTS & SERVICES
8.3.4 STRATEGY
8.3.5 DEVELOPMENTS
8.4 ANPATH GROUP INCORPORATED
8.4.1 OVERVIEW
8.4.2 FINANCIALS
8.4.3 PRODUCTS & SERVICES
8.4.4 STRATEGY
8.4.5 DEVELOPMENTS
8.5 ASHLAND INC.
8.5.1 OVERVIEW
8.5.2 FINANCIALS
8.5.3 PRODUCTS & SERVICES
8.5.4 STRATEGY
8.5.5 DEVELOPMENTS
8.6 BAKER HUGHES INCORPORATED
8.6.1 OVERVIEW
8.6.2 FINANCIALS
8.6.3 PRODUCTS & SERVICES
8.6.4 STRATEGY
8.6.5 DEVELOPMENTS
8.7 BASF SE
8.7.1 OVERVIEW
8.7.2 FINANCIALS
8.7.3 PRODUCTS & SERVICES
8.7.4 STRATEGY
8.7.5 DEVELOPMENTS
8.8 BUCKMAN LABORATORIES INTERNATIONAL INC.
8.8.1 OVERVIEW
8.8.2 FINANCIALS
8.8.3 PRODUCTS & SERVICES
8.8.4 STRATEGY
8.8.5 DEVELOPMENTS
8.9 BWA WATER ADDITIVE UK LIMITED
8.9.1 OVERVIEW
8.9.2 FINANCIALS
8.9.3 PRODUCTS & SERVICES
8.9.4 STRATEGY
8.9.5 DEVELOPMENTS
8.10 CAMSON BIO TECHNOLOGIES LIMITED
8.10.1 OVERVIEW
8.10.2 FINANCIALS
8.10.3 PRODUCTS & SERVICES
8.10.4 STRATEGY
8.10.5 DEVELOPMENTS
8.11 CHAMPION TECHNOLOGIES INC
8.11.1 OVERVIEW
8.11.2 FINANCIALS
8.11.3 PRODUCTS & SERVICES
8.11.4 STRATEGY
8.11.5 DEVELOPMENTS
8.12 CLARIANT AG
8.12.1 OVERVIEW
8.12.2 FINANCIALS
8.12.3 PRODUCTS & SERVICES
8.12.4 STRATEGY
8.12.5 DEVELOPMENTS
8.13 CORTEC CORPORATION
8.13.1 OVERVIEW:
8.13.2 FINANCIALS
8.13.3 PRODUCTS & SERVICES
8.13.4 STRATEGY
8.13.5 DEVELOPMENTS
8.14 FMC CORPORATION
8.14.1 OVERVIEW
8.14.2 FINANCIALS
8.14.3 PRODUCTS & SERVICES
8.14.4 STRATEGY
8.14.5 DEVELOPMENTS
8.15 GE WATER AND PROCESS TECHNOLOGIES
8.15.1 OVERVIEW
8.15.2 FINANCIALS
8.15.3 PRODUCTS & SERVICES
8.15.4 STRATEGY
8.15.5 DEVELOPMENTS
8.16 KEMIRA OYJ
8.16.1 OVERVIEW
8.16.2 FINANCIALS
8.16.3 PRODUCTS & SERVICES
8.16.4 STRATEGY
8.16.5 DEVELOPMENTS
8.17 LANXESS AG
8.17.1 OVERVIEW
8.17.2 FINANCIALS
8.17.3 PRODUCTS & SERVICES
8.17.4 STRATEGY
8.17.5 DEVELOPMENTS
8.18 LONZA GROUP LTD.
8.18.1 OVERVIEW
8.18.2 FINANCIALS
8.18.3 PRODUCTS & SERVICES
8.18.4 STRATEGY
8.18.5 DEVELOPMENTS
8.19 NALCO HOLDING COMPANY
8.19.1 OVERVIEW
8.19.2 FINANCIALS
8.19.3 PRODUCTS & SERVICES
8.19.4 STRATEGY
8.19.5 DEVELOPMENTS
8.20 RHODIA SA
8.20.1 OVERVIEW
8.20.2 FINANCIALS
8.20.3 PRODUCTS & SERVICES
8.20.4 STRATEGY
8.20.5 DEVELOPMENTS
8.21 SIGMA-ALDRICH CORP
8.21.1 OVERVIEW
8.21.2 FINANCIALS
8.21.3 PRODUCTS & SERVICES
8.21.4 STRATEGY
8.21.5 DEVELOPMENTS
8.22 THE DOW CHEMICAL COMPANY
8.22.1 OVERVIEW
8.22.2 FINANCIALS
8.22.3 PRODUCTS & SERVICES
8.22.4 STRATEGY
8.22.5 DEVELOPMENTS
8.23 THE LUBRIZOL CORPORATION
8.23.1 OVERVIEW
8.23.2 FINANCIALS
8.23.3 PRODUCTS & SERVICES
8.23.4 STRATEGY
8.23.5 DEVELOPMENTS
8.24 THOR GROUP LIMITED
8.24.1 OVERVIEW
8.24.2 FINANCIALS
8.24.3 PRODUCTS & SERVICES
8.24.4 STRATEGY
8.24.5 DEVELOPMENTS
8.25 TROY CORPORATION
8.25.1 OVERVIEW
8.25.2 FINANCIALS
8.25.3 PRODUCTS & SERVICES
8.25.4 STRATEGY
8.25.5 DEVELOPMENTS
LIST OF TABLES
TABLE 1 BIOCIDE MARKET REVENUE, BY GEOGRAPHY, 2009 � 2016 ($MILLION)
TABLE 2 BROMINE: PRICE TRENDS, 2009 � 2016 ($/TON)
TABLE 3 SULFUR: PRICE TRENDS, 2009 � 2016 ($/TON)
TABLE 4 CHLORINE: PRICE TRENDS, 2009 � 2016 ($/TON)
TABLE 5 BPD REGULATIONS
TABLE 6 PMRA REGULATIONS
TABLE 7 GLOBAL BIOCIDE MARKET REVENUE, BY TYPES, 2009 � 2016 ($MILLION)
TABLE 8 GLOBAL BIOCIDE MARKET VOLUME, BY TYPES, 2009 � 2016 (KILO TONS)
TABLE 9 TYPE OF BIOCIDES USED IN INDUSTRIAL APPLICATIONS
TABLE 10 VARIOUS METALS & THEIR CONCENTRATION
TABLE 11 DIFFERENT TYPE OF ORGANIC ACIDS & THEIR APPLICATIONS
TABLE 12 GLOBAL BIOCIDES MARKET REVENUE, BY APPLICATIONS, 2009 � 2016 ($MILLION)
TABLE 13 GLOBAL BIOCIDES MARKET VOLUME, BY APPLICATIONS, 2009 �2016 (KILO TONS)
TABLE 14 BIOCIDE USED IN INDUSTRIAL PRESERVATION
TABLE 15 BIOCIDES USED IN WATER TREATMENT
TABLE 16 BIOCIDES USED IN OTHER APPLICATIONS
TABLE 17 PERSONAL CARE: BIOCIDE MARKET REVENUE, BY GEOGRAPHY, 2009 � 2016 ($MILLION)
TABLE 18 PERSONAL CARE: BIOCIDE MARKET REVENUE, BY GEOGRAPHY, 2009 � 2016 (KILO TONS)
TABLE 19 WATER TREATMENT: BIOCIDE MARKET REVENUE, BY GEOGRAPHY, 2009 � 2016 ($MILLION)
TABLE 20 WATER TREATMENT: BIOCIDE MARKET VOLUME, BY GEOGRAPHY, 2009 � 2016 (KILO TONS)
TABLE 21 WOOD PRESERVATION: BIOCIDE MARKET REVENUE, BY GEOGRAPHY, 2009 � 2016 ($MILLION)
TABLE 22 WOOD PRESERVATION: BIOCIDE MARKET VOLUME, BY GEOGRAPHY, 2009 � 2016 (KILO TONS)
TABLE 23 FOOD & BEVERAGE: BIOCIDE MARKET REVENUE, BY GEOGRAPHY, 2009 � 2016 ($MILLION)
TABLE 24 FOOD & BEVERAGE: BIOCIDE MARKET VOLUME, BY GEOGRAPHY, 2009 � 2016 (KILO TONS)
TABLE 25 PAINTS & COATINGS: BIOCIDE MARKET REVENUE, BY GEOGRAPHY, 2009 � 2016 ($MILLION)
TABLE 26 PAINTS & COATINGS: BIOCIDE MARKET VOLUME, BY GEOGRAPHY, 2009 � 2016 (KILO TONS)
TABLE 27 BIOCIDE MARKET VOLUME, BY GEOGRAPHY, 2009 � 2016 (KILO TONS)
TABLE 28 NORTH AMERICA: BIOCIDE MARKET REVENUE, BY COUNTRY, 2009 � 2016 ($MILLION)
TABLE 29 NORTH AMERICA: BIOCIDE MARKET VOLUME, BY COUNTRY, 2009 � 2016 (KILO TONS)
TABLE 30 EUROPE: BIOCIDE MARKET REVENUE, BY COUNTRY, 2009 � 2016 ($MILLION)
TABLE 31 EUROPE: BIOCIDE MARKET VOLUME, BY COUNTRY, 2009 � 2016 (KILO TONS)
TABLE 32 ASIA-PACIFIC: BIOCIDE MARKET REVENUE, BY COUNTRY, 2009 � 2016 ($MILLION)
TABLE 33 ASIA-PACIFIC: BIOCIDE MARKET VOLUME, BY COUNTRY, 2009 � 2016 (KILO TONS)
TABLE 34 ROW: BIOCIDE MARKET REVENUE, BY COUNTRY, 2009 � 2016 ($MILLION)
TABLE 35 ROW: BIOCIDE MARKET VOLUME, BY COUNTRY, 2009 � 2016 ($MILLION)
TABLE 36 MERGERS & ACQUISITIONS, 2008 � 2012
TABLE 37 AGREEMENTS, PARTNERSHIPS, COLLABORATIONS, JOINT VENTURES, 2008 � 2012
TABLE 38 NEW PRODUCTS LAUNCH, 2008 � 2012
TABLE 39 INVESTMENTS, EXPANSIONS & OTHER DEVELOPMENTS, 2008 � 2012
TABLE 40 AKCROS CHEMICALS: BIOCIDES FOR PLASTICS
TABLE 41 AKCROS CHEMICALS: BIOCIDES FOR INDUSTRIAL APPLICATIONS
TABLE 42 AKZONOBEL: TOTAL REVENUE, BY SEGMENTS, 2010 � 2011 ($MILLION)
TABLE 43 AKZONOBEL: TOTAL REVENUE, BY GEOGRAPHY, 2010 - 2011 ($MILLION)
TABLE 44 AKZONOBEL: PRODUCTS PORTFOLIO & ITS APPLICATIONS
TABLE 45 ALBEMARLE CORP: TOTAL REVENUE, BY SEGMENTS, 2010 � 2011 ($MILLION)
TABLE 46 ALBEMARLE CORP: TOTAL REVENUE, BY GEOGRAPHY, 2010 - 2011 ($MILLION)
TABLE 47 ALBEMARLE CORP: PRODUCTS PORTFOLIO & ITS APPLICATIONS
TABLE 48 ANPATH GROUP INCORPORATED: SURFACE CARE PRODUCTS & ITS APPLICATIONS
TABLE 49 ANPATH GROUP INCORPORATED: GEOBIOCIDES
TABLE 50 ANPATH GROUP INCORPORATED: ANIMAL CARE PRODUCTS
TABLE 51 ASHLAND INC: TOTAL REVENUE, BY SEGMENTS, 2010 - 2011 ($MILLION)
TABLE 52 ASHLAND INC: TOTAL REVENUE, BY GEOGRAPHY, 2010 - 2011 ($MILLION)
TABLE 53 ASHLAND INC: PRODUCTS PORTFOLIO & ITS APPLICATION
TABLE 54 BAKER HUGHES: TOTAL REVENUE, BY SEGMENTS, 2010 - 2011 ($MILLION)
TABLE 55 BAKER HUGHES: TOTAL REVENUE, BY GEOGRAPHY, 2010 - 2011 ($MILLION)
TABLE 56 BAKER HUGHES: PRODUCTS PORTFOLIO & ITS APPLICATION
TABLE 57 BASF SE: TOTAL REVENUE, BY SEGMENTS, 2010 - 2011 ($MILLION)
TABLE 58 BASF SE: PERFORMANCE PRODUCT SEGMENT REVENUE, BY SUB-SEGMENTS, 2010 - 2011 ($MILLION)
TABLE 59 BASF SE: PRODUCTS PORTFOLIO & ITS APPLICATIONS
TABLE 60 BUCKMAN LABORATORIES: PRODUCTS PORTFOLIO & ITS APPLICATIONS
TABLE 61 BWA WATER: PRODUCTS PORTFOLIO & ITS FEATURES
TABLE 62 CAMSON: TOTAL REVENUE, BY SEGMENTS, 2010 - 2011 ($MILLION)
TABLE 63 CAMSON: BIO-INSECTICIDE PORTFOLIO & ITS APPLICATIONS
TABLE 64 CAMSON: BIO-FUNGICIDES PORTFOLIO & ITS APPLICATIONS
TABLE 65 CHAMPION TECHNOLOGIES: PRODUCTS PORTFOLIO & ITS APPLICATIONS
TABLE 66 CLARIANT: TOTAL REVENUE, BY SEGMENTS,2010 - 2011 ($MILLION)
TABLE 67 CLARIANT: TOTAL REVENUE, BY GEOGRAPHY, 2010 - 2011 ($MILLION)
TABLE 68 CLARIANT: DRY-FILM BIOCIDE PORTFOLIO & ITS APPLICATIONS
TABLE 69 CLARIANT: DRY-IN-CAN BIOCIDES FORMULATIONS & ITS APPLICATIONS
TABLE 70 CORTEC CORP: BIOCIDE PORTFOLIO & ITS APPLICATIONS
TABLE 71 FMC CORP: TOTAL REVENUE, BY SEGMENTS, 2010 � 2011 ($MILLION)
TABLE 72 FMC CORP: TOTAL REVENUE, BY GEOGRAPHY, 2009 - 2010 ($MILLION)
TABLE 73 FMC CORP: PESTICIDES FOR USE IN THE FOOD INDUSTRY
TABLE 74 FMC CORP: PESTICIDES FOR ENVIRONMENTAL USE
TABLE 75 FMC CORP: PESTICIDES FOR LEGIONELLA & REFRIGERATION TOWERS
TABLE 76 FMC CORP: PESTICIDES PORTFOLIO & ITS APPLICATIONS
TABLE 77 FMC CORP: MICROBIAL CONTROL PORTFOLIO & ITS APPLICATIONS
TABLE 78 GE WATER: PRODUCTS PORTFOLIO & ITS APPLICATIONS
TABLE 79 KEMIRA: TOTAL REVENUE, BY SEGMENTS, 2010 - 2011 ($MILLION)
TABLE 80 KEMIRA: AMERICA & ASIA-PACIFIC BIOCIDE PRODUCT LINE FOR OILFIELD APPLICATIONS
TABLE 81 KEMIRA: EUROPE BIOCIDE PRODUCT LINE FOR OILFIELD APPLICATIONS
TABLE 82 LANXESS: TOTAL REVENUE, BY SEGMENTS, 2009 - 2010 ($MILLION)
TABLE 83 LANXESS: TOTAL REVENUE, BY GEOGRAPHY, 2009 - 20110 ($MILLION)
TABLE 84 LANXESS: PRODUCTS PORTFOLIO & ITS APPLICATIONS
TABLE 85 LONZA GROUP: TOTAL REVENUE, BY SEGMENTS, 2010 � 2011 ($MILLION)
TABLE 86 LONZA GROUP: BIOCIDE PRODUCTS PORTFOLIO & ITS APPLICATIONS
TABLE 87 LONZA GROUP: OTHER BIOCIDE PRODUCTS PORTFOLIO & ITS APPLICATIONS
TABLE 88 NALCO: ANNUAL REVENUE, BY SEGMENTS, 2009 - 2010 ($MILLION)
TABLE 89 NALCO: ANNUAL REVENUE, BY GEOGRAPHY,2009 - 2010 ($MILLION)
TABLE 90 NALCO: PRODUCTS PORTFOLIO & ITS APPLICATIONS
TABLE 91 RHODIA SA: TOTAL REVENUE, 2009 - 2010 ($MILLION)
TABLE 92 RHODIA: TOTAL REVENUE, BY SEGMENTS, 2009 � 2010 ($MILLION)
TABLE 93 RHODIA: TOTAL REVENUE, BY GEOGRAPHY, 2009 � 2010 ($MILLION)
TABLE 94 RHODIA: PRODUCTS PORTFOLIO & ITS PROPERTIES
TABLE 95 SIGMA-ALDRICH: TOTAL REVENUE, BY SEGMENTS, 2010 � 2011 ($MILLION)
TABLE 96 SIGMA-ALDRICH: TOTAL REVENUE, BY GEOGRAPHY, 2010 � 2011 ($MILLION)
TABLE 97 SIGMA-ALDRICH: PRODUCTS PORTFOLIO & ITS PROPERTIES
TABLE 98 DOW CHEMICAL: TOTAL REVENUE, BY SEGMENTS, 2010 - 2011 ($MILLION)
TABLE 99 DOW CHEMICAL: TOTAL REVENUE, BY GEOGRAPHY, 2010 - 2011 ($MILLION)
TABLE 100 DOW CHEMICAL: BIOCIDE PORTFOLIO & ITS APPLICATIONS
TABLE 101 LUBRIZOL: ANNUAL REVENUE, BY SEGMENTS, 2009 - 2010 ($MILLION)
TABLE 102 LUBRIZOL: PRODUCTS PORTFOLIO & ITS APPLICATIONS
TABLE 103 THOR GROUP: PAINTS & INKS - WET-STATE BIOCIDE & ITS APPLICATIONS
TABLE 104 THOR GROUP: PAINTS & INKS - DRY-FILM BIOCIDE & ITS APPLICATIONS
TABLE 105 THOR GROUP: POLYMER DISPERSIONS & ADHESIVES BIOCIDE & ITS APPLICATIONS
TABLE 106 THOR GROUP: WATER TREATMENT BIOCIDES & ITS APPLICATIONS
TABLE 107 THOR GROUP: FUEL BIOCIDES PRODUCTS PORTFOLIO & ITS APPLICATIONS
TABLE 108 TROY CORP: PRODUCTS PORTFOLIO & ITS APPLICATIONS
LIST OF FIGURES
FIGURE 1 WATER CONSUMPTION, BY GEOGRAPHY, 2010
FIGURE 2 GLOBAL BIOCIDE MARKET LANDSCAPE
FIGURE 3 MARKET SHARE, BY COMPANIES, 2010
FIGURE 4 BIOCIDE MARKET REVENUE, BY GEOGRAPHY, 2010
FIGURE 5 IMPACT OF MAJOR DRIVERS ON GLOBAL BIOCIDE MARKET, 2010 � 2016
FIGURE 6 IMPACT OF MAJOR RESTRAINTS ON GLOBAL BIOCIDE MARKET, 2010 � 2016
FIGURE 7 MAJOR OPPORTUNITIES IN GLOBAL BIOCIDE MARKET, 2010 � 2016
FIGURE 8 AMMONIA MARKET SHARE, BY GEOGRAPHY, 2010
FIGURE 9 PORTER�S FIVE FORCES ANALYSIS
FIGURE 10 BIOCIDE INDUSTRY � VALUE CHAIN
FIGURE 11 GLOBAL PATENT ANALYSIS, BY PLAYERS, 2007 � 2011 (%)
FIGURE 12 PATENT ANALYSIS, BY GEOGRAPHY, 2007 � 2011
FIGURE 13 GLOBAL TRENDS IN PATENT FILINGS, 2007 � 2011
FIGURE 14 BIOCIDE MARKET, BY AVERAGE PRICES, 2009 � 2016 (USD/KG)
FIGURE 15 DIFFERENT TYPE OF HALOGEN COMPOUNDS BIOCIDE
FIGURE 16 DIFFERENT TYPE OF METALLIC COMPOUNDS BIOCIDE
FIGURE 17 DIFFERENT TYPE OF ORGANOSULFUR COMPOUNDS BIOCIDE
FIGURE 18 DIFFERENT TYPE OF ORGANIC ACIDS BIOCIDE
FIGURE 19 DIFFERENT TYPE OF PHENOLIC BIOCIDE
FIGURE 20 NITROGEN-BASED BIOCIDE DEMAND, BY GEOGRAPHY, 2010
FIGURE 21 NORTH AMERICA: MARKET SHARE, BY COUNTRY, 2010
FIGURE 22 EUROPE: MARKET SHARE, BY COUNTRY, 2010
FIGURE 23 ASIA-PACIFIC: MARKET SHARE, BY COUNTRY, 2010
FIGURE 24 GLOBAL BIOCIDE MARKET SHARE, BY GROWTH STRATEGIES, 2008 � 2011
FIGURE 25 GLOBAL BIOCIDE GROWTH STRATEGY, BY COMPANY, 2008 � 2011
FIGURE 26 TRENDS IN GROWTH STRATEGIES, 2008 � 2011
FIGURE 27 GROWTH STRATEGIES, BY GEOGRAPHY, 2008 � 2011


Growth opportunities and latent adjacency in Global Biocide Market
Specific information on biocides used as disinfectant in Ireland
Market data for Biocides market for South Africa region on water industry
Interested to buy report section of Global Biocide Market study
General information on biocides market
Information on future demand for Bromine from high growth markets with a forecast of five years and competitive analysis of top players.
biocides in enhanced oil recovery for Oil & Gas application
Biocide market for Asia and the Pacific and value chain analysis
Specific information on disinfectants used in healthcare application