Biofungicides Market by Type (Microbial species, Botanical), Mode of Application (Soil treatment, Foliar application, Seed treatment), Species (Bacillus, Trichoderma, Streptomyces, Pseudomonas), Crop Type, Formulation, and Region � Global Forecast to 2025


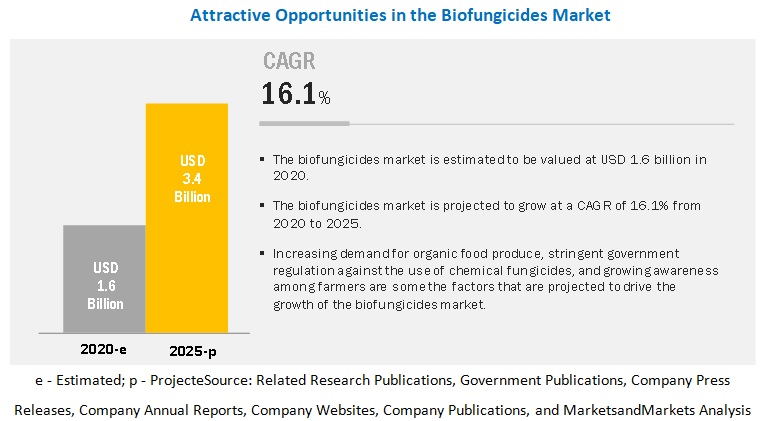
[209 Pages Report] The global biofungicides market is estimated to account for a value of USD 1.6 billion in 2020 and is projected to grow at a CAGR 16.1%, to reach a value of USD 3.4 billion by 2025. The increase in demand for organic food products, stringent government regulation against the use of chemical-based crop protection methods, and the growing awareness among farmers about the benefits of adopting biofungicides are some of the factors that are projected to drive the growth of the market. New product launches and partnerships were the dominant strategies adopted by key players to capitalize on the strong market potential.
By type, the microbial species segment is projected to be the fastest-growing in the biofungicides market during the forecast period
Microbial biofungicides are more efficient in terms of their mode of action than botanical biofungicides. They act against the pathogenic fungi by parasitism, antibiosis, or competition. The ease of production of microbial biofungicides is another factor that has led to an increase in the adoption rate.
By form, the wettable powder segment is projected to be the fastest-growing in the biofungicides market during the forecast period
The flexibility in the usage, longer shelf life, and affordable prices has led to a higher preference for wettable powdered form in the market. Farmers can use the wettable powder as a direct sprinkle over the soil, or it can be mixed with water, which is meant for irrigation. It can also be mixed with the seeds before sowing, or it can be mixed with any aqueous liquid and sprayed over the soil at regular intervals.
By species, Trichoderma is projected to dominate the biofungicides market during the forecast period.
The market for biofungicides, on the basis of species, has been segmented into Bacillus, Trichoderma, Pseudomonas, and Streptomyces. Trichoderma is used as the most effective strain in controlling soil-borne and foliar fungal pathogens.
By mode of application, the soil treatment segment is projected to be the fastest-growing in the biofungicides market during the forecast period
Soil treatment is the most adopted mode of application for biofungicides due to the advancements in soil treatment techniques. In addition, a majority of the fungal infections happen in the soil and root zone area of the plant, which delays the plant growth and eventually leads to plant death. Therefore, farmers adopt soil treatment solutions to ensure a healthy crop yield.
By crop type, the fruits & vegetables segment is projected to be the fastest-growing segment in the biofungicides market during the forecast period
The rising demand for organic fruits and vegetables globally has resulted in an increase in the use of biofungicides in the segment. Framers are now discarding the use of chemical-based biofungicides due to the harmful health concerns associated with synthetic products.
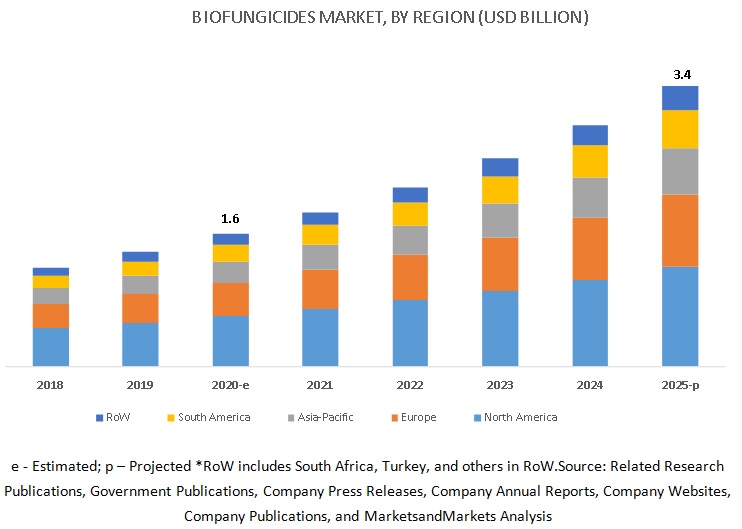
The shift toward sustainable agriculture and the presence of key players in the North American region are factors that are projected to drive the growth of the biofungicides market.
The North American region is one of the largest producers of organic fruits and vegetables. In addition, the increasing use of integrated pest management solutions is projected to drive the market growth of biofungicides in the region.
Key Market Players
Key players in the biofungicides market include BASF SE (Germany), Bayer AG (Germany), Syngenta AG (Switzerland), FMC Corporation (US), Nufarm (Australia), Novozymes (Denmark), Marrone Bio Innovations (US), Koppert Biological Systems (Netherlands), Isagro S.P.A (Italy), T. Stanes & Company Limited (India), BioWorks (US), The Stockton Group (Israel), Valent Biosciences (US), Agri Life (India). Certis U.S.A (US), Andermatt Biocontrol AG (Switzerland), Lesaffre (France), Rizobacter (Argentina), Vegalab S.A (US), Biobest Group NV (Belgium), and Biolchim (Italy).
Scope of the Biofungicides Market Report
|
Report Metric |
Details |
|
Market size available for years |
2018-2025 |
|
Base year considered |
2019 |
|
Forecast period |
2020-2025 |
|
Forecast units |
Value (USD million) |
|
Segments covered |
By type, form, species, mode of application, and crop type |
|
Geographies covered |
North America, Europe, Asia Pacific, South America, and Rest of World (RoW) |
|
Companies covered |
BASF SE (Germany), Bayer AG (Germany), Syngenta AG (Switzerland), FMC Corporation (US), Nufarm (Australia), Novozymes (Denmark), Marrone Bio Innovations (US), Koppert Biological Systems (Netherlands), Isagro S.P.A (Italy), T. Stanes & Company Limited (India), BioWorks (US), The Stockton Group (Israel), Valentt Biosciences (US), Agri Life (India), Certis U.S.A (US), Andermatt Biocontrol AG (Switzerland), Lesaffre (France), Rizobacter (Argentina), Vegalab S.A (US), Biobest Group NV (Belgium), and Biolchim (Italy) |
This research report categorizes the biofungicides market based on type, form, species, crop type, mode of application, and region.
Based on Type:
- Microbial species
- Botanical
Based on Form:
- Wettable powder
- Aqueous solution
- Granules
Based on Species:
- Bacillus
- Trichoderma
- Pseudomonas
- Streptomyces
-
Other species
- Saccharomyces
- Aureobasidium
- Coniothyrium
Based on Mode of Application:
- Foliar spray
- Soil treatment
- Seed treatment
-
Other modes of application
- Post-harvest
- Root dipping
- Sprinkler and drip irrigation
Based on Crop-type:
- Fruits & vegetables
- Cereals & grains
- Oilseeds & pulses
-
Other crops
- Turf & ornamentals
Based on Region:
- North America
- Europe
- Asia Pacific
- South America
-
Rest of the World (RoW)
- South Africa
- Turkey
- Others in RoW
Recent Developments:
- In April 2020, Marrone launched a recently approved bio-based plant health product, Pacesetter, for crops, such as corn, soybean, and wheat. The active ingredient is a plant extract Reynoutria, which acts synergistically with conventional fungicides to improve plant health and vigor.
- In March 2020, BioWorks launched PERpose Plus, a broad-spectrum algaecide, and fungicide for the prevention, suppression, and control of fungus and algae on equipment and hard surface in all stages of crop protection and for post-harvest and storage applications.
- In November 2018, Koppert launched a new biofungicide for botrytis, fruit rot, grey mold, and Monila rot. This product is registered for the market of France and the US.
Key questions addressed by the report:
- Who are some of the key players operating in the biofungicides market, and how intense is the competition?
- What kind of competitors and stakeholders would be interested in this market? What will be their go-to-market strategy, and which emerging market will be of significant interest?
- How are the current R&D activities and M&As in the biofungicides market projected to create a disrupting environment in the coming years?
- What will be the level of impact of new product launches on the revenues of stakeholders due to the benefits offered by biofungicides, such as increasing revenue, environmental regulatory compliance, and sustainable profits for suppliers?
- Which regions are projected to witness an increase in the adoption of biofungicides?
To speak to our analyst for a discussion on the above findings, click Speak to Analyst
 Exclusive indicates content/data unique to MarketsandMarkets and not available with any competitors.
TABLE OF CONTENTS
1 INTRODUCTION (Page No. - 20)
1.1 OBJECTIVES OF THE STUDY
1.2 MARKET DEFINITION
1.3 STUDY SCOPE
1.4 PERIODIZATION CONSIDERED
1.5 CURRENCY CONSIDERED
1.6 UNITS
1.7 STAKEHOLDERS
1.8 INCLUSIONS & EXCLUSIONS
2 RESEARCH METHODOLOGY (Page No. - 25)
2.1 RESEARCH DATA
2.1.1 SECONDARY DATA
2.1.1.1 Key Data from Secondary Sources
2.1.2 PRIMARY DATA
2.1.2.1 Key Data from Primary Sources
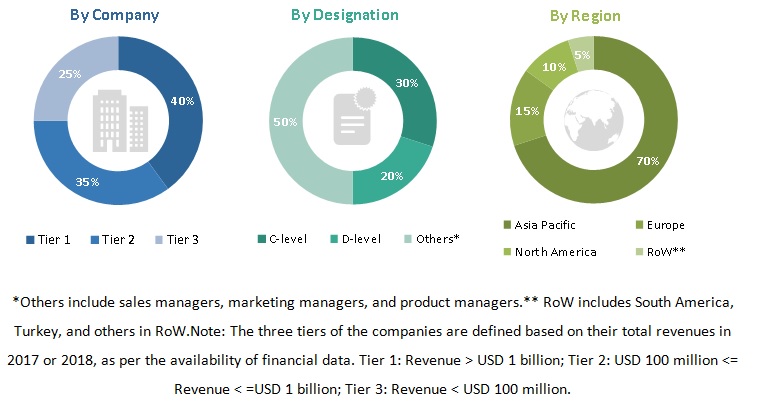
2.1.2.2 Breakdown of Primaries
2.2 MARKET SIZE ESTIMATION
2.2.1 BOTTOM-UP APPROACH
2.2.2 TOP-DOWN APPROACH
2.3 MARKET BREAKDOWN & DATA TRIANGULATION
2.4 RESEARCH ASSUMPTIONS & LIMITATIONS
2.4.1 ASSUMPTIONS
2.4.2 LIMITATIONS OF THE STUDY
3 EXECUTIVE SUMMARY (Page No. - 34)
4 PREMIUM INSIGHTS (Page No. - 40)
4.1 OPPORTUNITIES IN THE BIOFUNGICIDES MARKET
4.2 BIOFUNGICIDES MARKET, BY MICROBIAL SPECIES
4.3 NORTH AMERICA: BIOFUNGICIDES MARKET, BY TYPE AND KEY COUNTRIES
4.4 BIOFUNGICIDES, BY MODE OF APPLICATION AND REGION
4.5 BIOFUNGICIDES MARKET, BY FORMULATION
4.6 BIOFUNGICIDES, CROP TYPE
5 MARKET OVERVIEW (Page No. - 43)
5.1 INTRODUCTION
5.2 MACROECONOMIC INDICATORS
5.2.1 EXPANSION OF CULTIVATION AREA UNDER ORGANIC AGRICULTURE
5.2.2 DECLINING TREND OF USING CHEMICAL PESTICIDES
5.2.3 INCREASING INCIDENCES OF FUNGAL INFECTIONS IN FRUIT AND VEGETABLE CROPS
5.3 MARKET DYNAMICS
5.3.1 DRIVERS
5.3.1.1 Regulatory pressures and harmful effects associated with the use of synthetic plant protectants
5.3.1.2 Growing emphasis on integrated pest management solutions
5.3.1.3 Growing preference for organic products to encourage the adoption of biological products
5.3.2 RESTRAINTS
5.3.2.1 Technological limitations for the use of biological products
5.3.2.2 Need for frequent reapplications of biofungicides as compared to its chemical counterparts
5.3.3 OPPORTUNITIES
5.3.3.1 Advancements in microbial research undertaken by key players across regions
5.3.3.2 Plant pathogens developing resistance to chemical fungicides
5.3.4 CHALLENGES
5.3.4.1 Preference for chemical fungicides among farmers in developing countries
5.3.4.2 Introduction of new biofungicides in the market
5.4 VALUE CHAIN ANALYSIS
5.5 PATENT ANALYSIS
5.6 REGULATORY FRAMEWORK
5.6.1 US
5.6.2 CANADA
5.6.3 EUROPE
5.6.4 INDIA
5.6.5 AUSTRALIA
6 COVID-19 IMPACT ON THE BIOFUNGICIDES MARKET (Page No. - 66)
6.1 INTRODUCTION
6.2 IMPACT OF COVID-19 ON THE PESTICIDE INDUSTRY
6.3 OPPORTUNITIES FOR BIOFUNGICIDES DURING THE OUTBREAK
7 BIOFUNGICIDES MARKET, BY TYPE (Page No. - 68)
7.1 INTRODUCTION
7.2 MICROBIAL
7.2.1 MICROBIAL PESTICIDES HAVE LOWER CHANCES OF DEVELOPING RESISTANT PATHOGENS DUE TO MULTIPLE MODES OF ACTION
7.3 BOTANICAL
7.3.1 BOTANICAL BIOFUNGICIDES WITNESS HIGH DEMAND AS THEY PROVIDE NON-TOXICITY TO HOST PLANTS
8 BIOFUNGICIDES MARKET, BY MICROBIAL SPECIES (Page No. - 74)
8.1 INTRODUCTION
8.2 TRICHODERMA
8.2.1 EASY AVAILABILITY OF TRICHODERMA AND ITS HIGH SHELF LIFE TO ENCOURAGE ADOPTION AMONG FARMERS
8.3 BACILLUS
8.3.1 BACILLUS ACTS AS A PLANT GROWTH REGULATOR AND HELPS IN CONTROLLING PATHOGENIC FUNGI
8.4 PSEUDOMONAS
8.4.1 PSEUDOMONAS IS A WIDE-SPECTRUM BIOFUNGICIDES, WHICH IS SUITABLE FOR ALL TYPES OF CROPS
8.5 STREPTOMYCES
8.5.1 STREPTOMYCES DESTROYS PATHOGENIC ANTAGONISTS BY SECRETING VOLATILE COMPOUNDS
8.6 OTHER MICROBIAL SPECIES
8.6.1 YEAST AND BACTERIAL SPP. PRODUCE ANTAGONISTIC METABOLITES TO SUPPRESS PATHOGENIC FUNGAL ACTIVITIES
9 BIOFUNGICIDES MARKET, BY MODE OF APPLICATION (Page No. - 82)
9.1 INTRODUCTION
9.2 SOIL TREATMENT
9.2.1 EFFECTIVENESS OF SOIL TREATMENT IN PROMOTING SEED GROWTH AND PREVENTING SOIL-BORNE FUNGAL INFECTIONS ENCOURAGES ITS ADOPTION
9.3 FOLIAR SPRAY
9.3.1 THE APPEARANCE OF PATHOGENIC FUNGI IN THE LATER STAGES OF PLANTS INCREASES THE USAGE OF FOLIAR SPRAY AS A MODE OF APPLICATION
9.4 SEED TREATMENT
9.4.1 SEED TREATMENT IMPROVES THE STRESS TOLERANCE CAPACITY OF SEEDS AND PROVIDES PROTECTION AGAINST SOIL-BORNE FUNGAL PATHOGENS
9.5 OTHER MODES OF APPLICATION
9.5.1 FUNGAL SPORES PRESENT IN THE AIR AFFECT AGRICULTURAL PRODUCTION, WHICH REQUIRES POST-HARVEST APPLICATION OF BIOFUNGICIDES
10 BIOFUNGICIDES MARKET, BY CROP TYPE (Page No. - 90)
10.1 INTRODUCTION
10.2 FRUITS & VEGETABLES
10.2.1 INCREASED CONSUMPTION OF ORGANIC FRUITS AND VEGETABLES HAS LED TO THE ADOPTION OF BIOFUNGICIDES AMONG FARMERS
10.3 CEREALS & GRAINS
10.3.1 POST-HARVEST LOSSES OF GRAINS AND THE DEGRADATION OF THEIR QUALITY HAVE LED TO A HIGH DEMAND FOR BIOFUNGICIDES TO PREVENT PATHOGEN ATTACKS AND RETAIN GRAIN WEIGHT AND QUALITY
10.4 OILSEEDS & PULSES
10.4.1 RISING DEMAND FOR PROTEIN-RICH FOOD PRODUCTS ACROSS REGIONS HAS ENCOURAGED FARMERS TO ADOPT BIOFUNGICIDES FOR PRODUCING ORGANIC AND HEALTHIER PULSES
10.5 OTHER CROPS
10.5.1 INCREASING NUMBER OF GOLF COURSES REQUIRE THE USAGE OF BIOFUNGICIDES TO MAINTAIN HIGH GRASS QUALITY
11 BIOFUNGICIDES MARKET, BY FORMULATION (Page No. - 98)
11.1 INTRODUCTION
11.2 WETTABLE POWDER
11.2.1 WETTABLE POWDER IS EFFECTIVE FOR ACTIVE INGREDIENTS THAT ARE INSOLUBLE IN WATER AND OIL
11.3 GRANULES
11.3.1 GRANULAR BIOFUNGICIDES EFFECTIVELY WORK BY SECRETING ENZYMES, WHICH DISRUPT THE PATHOGENIC CELL MEMBRANE, CAUSING THEM TO DIE
11.4 AQUEOUS SOLUTION
11.4.1 INTEGRATION OF AQUEOUS SOLUTION BIOFUNGICIDES WITH IRRIGATION SYSTEMS INCREASES ITS ADOPTION RATE AMONG FARMERS
12 BIOFUNGICIDES MARKET, BY REGION (Page No. - 105)
12.1 INTRODUCTION
12.2 NORTH AMERICA
12.2.1 US
12.2.1.1 Increasing consumption of wheat has led to a rise in demand for biofungicides in the country to cater to the domestic, as well as export needs
12.2.2 CANADA
12.2.2.1 High losses in staple crops and fruits & vegetables have led to a rise in demand for biofungicides in Canada
12.2.3 MEXICO
12.2.3.1 Rising demand for high-quality and safe organic crops have led to an increased usage of biofungicides in the market
12.3 EUROPE
12.3.1 FRANCE
12.3.1.1 Increasing adoption of organic farming practices in France has led to a rise in demand for biofungicides
12.3.2 SPAIN
12.3.2.1 Fungal attacks on vineyards are affecting the Spanish wine industry, which, in turn, is driving the market growth in the country
12.3.3 GERMANY
12.3.3.1 Adoption of organic agriculture practices to drive the market growth for biofungicides in the country
12.3.4 ITALY
12.3.4.1 Decrease in citrus production due to fungal infections is a major factor driving the growth of the biofungicides market in Italy
12.3.5 UK
12.3.5.1 Increasing instances of greenhouse fungal infections to drive the demand for biofungicides in the UK
12.3.6 RUSSIA
12.3.6.1 Fluctuations in climatic conditions and biocontrol mechanisms against potato fungal diseases to encourage the adoption of biofungicides
12.3.7 REST OF EUROPE
12.3.7.1 Harmful effects of chemical fungicides and introduction of stringent government rules to drive the market for biofungicides
12.4 ASIA PACIFIC
12.4.1 AUSTRALIA
12.4.1.1 Introduction of government regulations and investments in innovative and sustainable agriculture to drive the market growth for biofungicides
12.4.2 CHINA
12.4.2.1 As the leading exporters of organic food products, the Chinese farmers are shifting their focus on bio-based crop protection products
12.4.3 INDIA
12.4.3.1 Increasing government support for integrated pest management programs and biological crop protection products to drive the market growth for biofungicides
12.4.4 JAPAN
12.4.4.1 Strict regulations against agrochemicals and the increasing demand for organic food to drive the growth of the biofungicides market in Japan
12.4.5 INDONESIA
12.4.5.1 Increased health concerns associated with chemical crop protection products to drive the growth of the biofungicides market
12.4.6 REST OF ASIA PACIFIC
12.4.6.1 Increased adoption of sustainable farming to drive the market growth of biofungicides in the region
12.5 SOUTH AMERICA
12.5.1 BRAZIL
12.5.1.1 Increasing instances of soybean rust infections to drive the market growth of biofungicides in the region
12.5.2 ARGENTINA
12.5.2.1 Increase in instances of infections in fruits and vegetable crops is encouraging farmers to adopt biofungicides in the region
12.5.3 REST OF SOUTH AMERICA
12.5.3.1 Stricter government regulations against the use of chemical products to drive the market growth for biofungicides in the region
12.6 REST OF THE WORLD (ROW)
12.6.1 TURKEY
12.6.1.1 Increasing export demands for organic food products is influencing farmers to adopt biological crop protection methods
12.6.2 SOUTH AFRICA
12.6.2.1 Decline in the wine quality due to the usage of chemical-based products is driving the growth of the biofungicides market in the region
12.6.3 OTHERS IN ROW
12.6.3.1 Stringent rules for the non-usage of chemical fungicides to drive the market growth in the Middle East
13 COMPETITIVE LANDSCAPE (Page No. - 157)
13.1 OVERVIEW
13.2 COMPETITIVE LEADERSHIP MAPPING
13.2.1 VISIONARY LEADERS
13.2.2 INNOVATORS
13.2.3 DYNAMIC DIFFERENTIATORS
13.2.4 EMERGING COMPANIES
13.3 RANKING OF KEY PLAYERS, 2019
13.4 COMPETITIVE SCENARIO
13.4.1 NEW PRODUCT LAUNCHES
13.4.2 EXPANSIONS & INVESTMENTS
13.4.3 ACQUISITIONS
13.4.4 AGREEMENTS & COLLABORATIONS
14 COMPANY PROFILES (Page No. - 165)
(Business overview, Products offered, Recent Developments, SWOT analysis, Right to win)*
14.1 BASF SE
14.2 BAYER AG
14.3 SYNGENTA AG
14.4 NUFARM
14.5 FMC CORPORATION
14.6 NOVOZYMES
14.7 MARRONE BIO INNOVATIONS
14.8 KOPPERT BIOLOGICAL SYSTEMS
14.9 ISAGRO S.P.A
14.10 BIOWORKS
14.11 THE STOCKTON GROUP
14.12 VALENT BIOSCIENCES
14.13 AGRI LIFE
14.14 CERTIS U.S.A LLC
14.15 ANDERMATT BIOCONTROL AG
14.16 LESAFFRE
14.17 RIZOBACTER
14.18 T. STANES & COMPANY LIMITED
14.19 VEGALAB S.A
14.20 BIOBEST GROUP NV
*Details on Business overview, Products offered, Recent Developments, SWOT analysis, Right to win might not be captured in case of unlisted companies.
15 APPENDIX (Page No. - 201)
15.1 DISCUSSION GUIDE
15.2 KNOWLEDGE STORE: MARKETSANDMARKETS’ SUBSCRIPTION PORTAL
15.3 AVAILABLE CUSTOMIZATIONS
15.4 RELATED REPORTS
15.5 AUTHOR DETAILS
LIST OF TABLES (124 Tables)
TABLE 1 USD EXCHANGE RATE, 2015–2019
TABLE 2 LIST OF A FEW PATENTS IN THE BIOFUNGICIDES MARKET, 2018–2020
TABLE 3 BIOFUNGICIDES MARKET SIZE, BY TYPE, 2018–2025 (USD MILLION)
TABLE 4 MICROBIAL STRAINS COMMONLY USED FOR BIOFUNGICIDES
TABLE 5 MICROBIAL: BIOFUNGICIDES MARKET SIZE, BY REGION, 2018–2025 (USD MILLION)
TABLE 6 BOTANICAL STRAINS COMMONLY USED FOR BIOFUNGICIDES
TABLE 7 BOTANICAL: BIOFUNGICIDES MARKET SIZE, BY REGION, 2018–2025 (USD MILLION)
TABLE 8 BIOFUNGICIDES MARKET SIZE, BY MICROBIAL SPECIES, 2018–2025 (USD MILLION)
TABLE 9 SECONDARY METABOLITES RELEASED BY TRICHODERMA SPP.
TABLE 10 MARKET SIZE FOR TRICHODERMA, BY REGION, 2018–2025 (USD MILLION)
TABLE 11 MARKET SIZE FOR BACILLUS, BY REGION, 2018–2025 (USD MILLION)
TABLE 12 MARKET SIZE FOR PSEUDOMONAS, BY REGION, 2018–2025 (USD MILLION)
TABLE 13 DISEASES/ TARGET PESTS CONTROLLED BY STREPTOMYCES SPP.
TABLE 14 MARKET SIZE FOR STREPTOMYCES, BY REGION, 2018–2025 (USD MILLION)
TABLE 15 MARKET SIZE FOR OTHER MICROBIAL SPECIES, BY REGION, 2018–2025 (USD MILLION)
TABLE 16 MARKET SIZE, BY MODE OF APPLICATION, 2018–2025 (USD MILLION)
TABLE 17 MARKET SIZE FOR SOIL TREATMENT, BY REGION, 2018–2025 (USD MILLION)
TABLE 18 MARKET SIZE FOR FOLIAR SPRAY, BY REGION, 2018–2025 (USD MILLION)
TABLE 19 KEY MICROBIAL BIOCONTROL AGENTS USED AS SEED TREATMENTS
TABLE 20 BIOFUNGICIDES MARKET SIZE FOR SEED TREATMENT, BY REGION, 2018–2025 (USD MILLION)
TABLE 21 MARKET SIZE FOR OTHER MODES OF APPLICATION, BY REGION, 2018–2025 (USD MILLION)
TABLE 22 MARKET SIZE, BY CROP TYPE, 2018–2025 (USD MILLION)
TABLE 23 FRUITS & VEGETABLES INFECTED BY FUNGAL PATHOGENS
TABLE 24 BIOFUNGICIDES MARKET SIZE FOR FRUITS & VEGETABLES, BY REGION, 2018–2025 (USD MILLION)
TABLE 25 MARKET SIZE FOR CEREALS & GRAINS, BY REGION, 2018–2025 (USD MILLION)
TABLE 26 MARKET SIZE FOR OILSEEDS & PULSES, BY REGION, 2018–2025 (USD MILLION)
TABLE 27 MARKET SIZE FOR OTHER CROPS, BY REGION, 2018–2025 (USD MILLION)
TABLE 28 MARKET SIZE, BY FORMULATION, 2018–2025 (USD MILLION)
TABLE 29 MARKET SIZE, BY FORMULATION, 2018–2025 (TON)
TABLE 30 MARKET SIZE FOR WETTABLE POWDER, BY REGION, 2018–2025 (USD MILLION)
TABLE 31 MARKET SIZE FOR WETTABLE POWDER, BY REGION, 2018–2025 (TON)
TABLE 32 MARKET SIZE FOR GRANULES, BY REGION, 2018–2025 (USD MILLION)
TABLE 33 MARKET SIZE FOR GRANULES, BY REGION, 2018–2025 ( TON)
TABLE 34 MARKET SIZE FOR AQUEOUS SOLUTION, BY REGION, 2018–2025 (USD MILLION)
TABLE 35 MARKET SIZE FOR AQUEOUS SOLUTION, BY REGION, 2018–2025 (TON)
TABLE 36 MARKET SIZE, BY REGION, 2018–2025 (USD MILLION)
TABLE 37 CROPS AND RELATED FUNGAL DISEASES IN NORTH AMERICA
TABLE 38 NORTH AMERICA: BIOFUNGICIDES MARKET SIZE, BY COUNTRY, 2018–2025 (USD MILLION)
TABLE 39 NORTH AMERICA: MARKET SIZE, BY TYPE, 2018–2025 (USD MILLION)
TABLE 40 NORTH AMERICA: MARKET SIZE, BY MODE OF APPLICATION, 2018–2025 (USD MILLION)
TABLE 41 NORTH AMERICA: MARKET SIZE, BY MICROBIAL SPECIES, 2018–2025 (USD MILLION)
TABLE 42 NORTH AMERICA: MARKET SIZE, BY CROP TYPE, 2018–2025 (USD MILLION)
TABLE 43 NORTH AMERICA: MARKET SIZE, BY FORMULATION, 2018–2025 (USD MILLION)
TABLE 44 NORTH AMERICA: MARKET SIZE, BY FORMULATION, 2018–2025 (TON)
TABLE 45 US: MARKET SIZE, BY TYPE, 2018–2025 (USD MILLION)
TABLE 46 US: MARKET SIZE, BY CROP TYPE, 2018–2025 (USD MILLION)
TABLE 47 COMMON DISEASES CAUSED BY FUNGAL SPECIES IN CANADA
TABLE 48 CANADA: MARKET SIZE, BY TYPE, 2018–2025 (USD MILLION)
TABLE 49 CANADA: MARKET SIZE, BY CROP TYPE, 2018–2025 (USD MILLION)
TABLE 50 MEXICO: MARKET SIZE, BY TYPE, 2018–2025 (USD MILLION)
TABLE 51 MEXICO: MARKET SIZE, BY CROP TYPE, 2018–2025 (USD MILLION)
TABLE 52 EUROPE: BIOFUNGICIDES MARKET SIZE, BY COUNTRY, 2018–2025 (USD MILLION)
TABLE 53 EUROPE: MARKET SIZE, BY TYPE, 2018–2025 (USD MILLION)
TABLE 54 EUROPE: MARKET SIZE, BY MODE OF APPLICATION, 2018–2025 (USD MILLION)
TABLE 55 EUROPE: MARKET SIZE, BY MICROBIAL SPECIES, 2018–2025 (USD MILLION)
TABLE 56 EUROPE: MARKET SIZE, BY CROP TYPE, 2018–2025 (USD MILLION)
TABLE 57 EUROPE: MARKET SIZE, BY FORMULATION, 2018–2025 (USD MILLION)
TABLE 58 EUROPE: MARKET SIZE, FORMULATION, 2018–2025 (TON)
TABLE 59 FRANCE: MARKET SIZE, BY TYPE, 2018–2025 (USD MILLION)
TABLE 60 FRANCE: MARKET SIZE, BY CROP TYPE, 2018–2025 (USD MILLION)
TABLE 61 SPAIN: MARKET SIZE, BY TYPE, 2018–2025 (USD MILLION)
TABLE 62 SPAIN: MARKET SIZE, BY CROP TYPE, 2018–2025 (USD MILLION)
TABLE 63 GERMANY: MARKET SIZE, BY TYPE, 2018–2025 (USD MILLION)
TABLE 64 GERMANY: MARKET SIZE, BY CROP TYPE, 2018–2025 (USD MILLION)
TABLE 65 ITALY: MARKET SIZE, BY TYPE, 2018–2025 (USD MILLION)
TABLE 66 ITALY: MARKET SIZE, BY CROP TYPE, 2018–2025 (USD MILLION)
TABLE 67 UK: MARKET SIZE, BY TYPE, 2018–2025 (USD MILLION)
TABLE 68 UK: MARKET SIZE, BY CROP TYPE, 2018–2025 (USD MILLION)
TABLE 69 RUSSIA: MARKET SIZE, BY TYPE, 2018–2025 (USD MILLION)
TABLE 70 RUSSIA: MARKET SIZE, BY CROP TYPE, 2018–2025 (USD MILLION)
TABLE 71 REST OF EUROPE: MARKET SIZE, BY TYPE, 2018–2025 (USD MILLION)
TABLE 72 REST OF EUROPE: MARKET SIZE, BY CROP TYPE, 2018–2025 (USD MILLION)
TABLE 73 KEY CROPS PRODUCED IN THE ASIA PACIFIC REGION
TABLE 74 ASIA PACIFIC: BIOFUNGICIDES MARKET SIZE, BY COUNTRY, 2018–2025 (USD MILLION)
TABLE 75 ASIA PACIFIC: MARKET SIZE, BY TYPE 2018–2025 (USD MILLION)
TABLE 76 ASIA PACIFIC: MARKET SIZE, BY MODE OF APPLICATION, 2018–2025 (USD MILLION)
TABLE 77 ASIA PACIFIC: MARKET SIZE, BY MICROBIAL SPECIES, 2018–2025 (USD MILLION)
TABLE 78 ASIA PACIFIC: MARKET SIZE, BY CROP TYPE, 2018–2025 (USD MILLION)
TABLE 79 ASIA PACIFIC: MARKET SIZE, BY FORMULATION, 2018–2025 (USD MILLION)
TABLE 80 ASIA PACIFIC: MARKET SIZE, BY FORMULATION, 2018–2025 (TON)
TABLE 81 AUSTRALIA: MARKET SIZE, BY TYPE, 2018–2025 (USD MILLION)
TABLE 82 AUSTRALIA: MARKET SIZE, BY CROP TYPE, 2018–2025 (USD MILLION)
TABLE 83 CHINA: MARKET SIZE, BY TYPE, 2018–2025 (USD MILLION)
TABLE 84 CHINA: MARKET SIZE, BY CROP TYPE, 2018–2025 (USD MILLION)
TABLE 85 INDIA: MARKET SIZE, BY TYPE, 2018–2025 (USD MILLION)
TABLE 86 INDIA: MARKET SIZE, BY CROP TYPE, 2018–2025 (USD MILLION)
TABLE 87 JAPAN: MARKET SIZE, BY TYPE, 2018–2025 (USD MILLION)
TABLE 88 JAPAN: MARKET SIZE, BY CROP TYPE, 2018–2025 (USD MILLION)
TABLE 89 INDONESIA: MARKET SIZE, BY TYPE, 2018–2025 (USD MILLION)
TABLE 90 INDONESIA: MARKET SIZE, BY CROP TYPE, 2018–2025 (USD MILLION)
TABLE 91 REST OF ASIA PACIFIC: MARKET SIZE, BY TYPE, 2018–2025 (USD MILLION)
TABLE 92 REST OF ASIA PACIFIC: MARKET SIZE, BY CROP TYPE, 2018–2025 (USD MILLION)
TABLE 93 SOUTH AMERICA: MARKET SIZE, BY COUNTRY, 2018–2025 (USD MILLION)
TABLE 94 SOUTH AMERICA: BIOFUNGICIDES SIZE, BY TYPE, 2018–2025 (USD MILLION)
TABLE 95 SOUTH AMERICA: BIOFUNGICIDES MARKET SIZE, BY MODE OF APPLICATION, 2018–2025 (USD MILLION)
TABLE 96 SOUTH AMERICA: MARKET SIZE, BY MICROBIAL SPECIES, 2018–2025 (USD MILLION)
TABLE 97 SOUTH AMERICA: MARKET SIZE, BY CROP TYPE, 2018–2025 (USD MILLION)
TABLE 98 SOUTH AMERICA: MARKET SIZE, BY FORM, 2018–2025 (USD MILLION)
TABLE 99 SOUTH AMERICA: MARKET SIZE, BY FORMULATION, 2018–2025 (TON)
TABLE 100 ACTIVE STRAINS REGISTERED IN THE BRAZILIAN MARKET
TABLE 101 BRAZIL: MARKET SIZE, BY TYPE, 2018–2025 (USD MILLION)
TABLE 102 BRAZIL: MARKET SIZE, BY CROP TYPE, 2018–2025 (USD MILLION)
TABLE 103 ARGENTINA: MARKET SIZE, BY TYPE, 2018–2025 (USD MILLION)
TABLE 104 ARGENTINA: MARKET SIZE, BY CROP TYPE, 2018–2025 (USD MILLION)
TABLE 105 BIOCONTROL AGENTS REGISTERED IN COLUMBIA
TABLE 106 REST OF SOUTH AMERICA: MARKET SIZE, BY TYPE, 2018–2025 (USD MILLION)
TABLE 107 REST OF SOUTH AMERICA: MARKET SIZE, BY CROP TYPE, 2018–2025 (USD MILLION)
TABLE 108 ROW: BIOFUNGICIDES MARKET SIZE, BY COUNTRY, 2018–2025 (USD MILLION)
TABLE 109 ROW: MARKET SIZE, BY TYPE, 2018–2025 (USD MILLION)
TABLE 110 ROW: MARKET SIZE, BY MICROBIAL SPECIES, 2018–2025 (USD MILLION)
TABLE 111 ROW: MARKET SIZE, BY MODE OF APPLICATION, 2018–2025 (USD MILLION)
TABLE 112 ROW: MARKET SIZE, BY CROP TYPE, 2018–2025 (USD MILLION)
TABLE 113 ROW: MARKET SIZE, BY FORM, 2018–2025 (USD MILLION)
TABLE 114 ROW: MARKET SIZE, BY FORMULATION, 2018–2025 (TON)
TABLE 115 TURKEY: MARKET SIZE, BY TYPE, 2018–2025 (USD MILLION)
TABLE 116 TURKEY: MARKET SIZE, BY CROP TYPE, 2018–2025 (USD MILLION)
TABLE 117 SOUTH AFRICA: MARKET SIZE, BY TYPE, 2018–2025 (USD MILLION)
TABLE 118 SOUTH AFRICA: MARKET SIZE, BY CROP TYPE, 2018–2025 (USD MILLION)
TABLE 119 OTHERS IN ROW: MARKET SIZE, BY TYPE, 2018–2025 (USD MILLION)
TABLE 120 OTHERS IN ROW: BIOFUNGICIDES MARKET SIZE, BY CROP TYPE, 2018–2025 (USD MILLION)
TABLE 121 NEW PRODUCT LAUNCHES, 2018-2020
TABLE 122 EXPANSIONS & INVESTMENTS, 2018-2020
TABLE 123 ACQUISITIONS, 2019
TABLE 124 AGREEMENTS & COLLABORATIONS, 2019-2020
LIST OF FIGURES (52 Figures)
FIGURE 1 BIOFUNGICIDES MARKET SEGMENTATION
FIGURE 2 REGIONAL SEGMENTATION
FIGURE 3 RESEARCH DESIGN: BIOFUNGICIDES MARKET
FIGURE 4 MARKET SIZE ESTIMATION METHODOLOGY: BOTTOM-UP APPROACH
FIGURE 5 MARKET SIZE ESTIMATION METHODOLOGY: TOP-DOWN APPROACH
FIGURE 6 DATA TRIANGULATION METHODOLOGY
FIGURE 7 GLOBAL BIOFUNGICIDES MARKET, 2018–2025 (USD MILLION)
FIGURE 8 MICROBIAL BIOFUNGICIDES ACCOUNT FOR A LARGER MARKET SHARE IN THE BIOFUNGICIDES MARKET
FIGURE 9 TRICHODERMA SPECIES HOLDS THE LARGEST MARKET SHARE DUE TO ITS COST-EFFECTIVENESS AND HIGHER EFFICACY
FIGURE 10 SOIL TREATMENT TO HOLD THE LARGEST MARKET SHARE DURING THE FORECAST PERIOD
FIGURE 11 FRUITS & VEGETABLES TO HOLD THE LARGEST MARKET SHARE DURING THE FORECAST PERIOD
FIGURE 12 WETTABLE POWDER ACCOUNTED FOR THE HIGHEST SHARE IN THE BIOFUNGICIDES MARKET
FIGURE 13 BIOFUNGICIDES SNAPSHOT: NORTH AMERICA ACCOUNTED FOR THE LARGEST SHARE, 2019 (USD MILLION)
FIGURE 14 INCREASING ADOPTION OF ORGANIC FARMING PRACTICES TO DRIVE THE GROWTH OF THE BIOFUNGICIDES MARKET
FIGURE 15 TRICHODERMA SEGMENT HELD THE LARGEST MARKET SHARE IN THE BIOFUNGICIDES MARKET IN 2019
FIGURE 16 NORTH AMERICA: THE US IS ONE OF THE LARGEST MARKETS FOR BIOFUNGICIDES
FIGURE 17 NORTH AMERICA HELD THE LARGEST MARKET SHARE FOR SEED TREATMENT IN 2019
FIGURE 18 WETTABLE POWDER HELD THE LARGEST MARKET SHARE FOR BIOFUNGICIDES IN 2019
FIGURE 19 FRUITS & VEGETABLES HELD THE LARGEST MARKET SHARE IN 2019
FIGURE 20 GLOBAL ORGANIC AGRICULTURE, BY REGION (2017)
FIGURE 21 TOP TEN COUNTRIES WITH LARGE AREAS UNDER ORGANIC FARMING (2017)
FIGURE 22 USE OF PESTICIDES WORLDWIDE, 2010–2017 (TONS)
FIGURE 23 WORLD PRODUCTION OF FRUITS AND VEGETABLES, 2015–2017 (MT)
FIGURE 24 GROWING ADOPTION OF INTEGRATED PEST MANAGEMENT SOLUTIONS HAS LED TO AN INCREASE IN DEMAND FOR BIOFUNGICIDES
FIGURE 25 LOW INTRODUCTION OF ACTIVE INGREDIENTS
FIGURE 26 EUROPE: ORGANIC MARKET SHARE (2016 VS. 2017)
FIGURE 27 TOTAL NUMBER OF ACTIVE INGREDIENTS AVAILABLE AT THE GLOBAL LEVEL (1950–2010)
FIGURE 28 VALUE CHAIN ANALYSIS
FIGURE 29 NUMBER OF PATENTS GRANTED FOR BIOFUNGICIDES IN THE MARKET, 2015–2020
FIGURE 30 REGIONAL ANALYSIS OF PATENTS GRANTED IN THE BIOFUNGICIDES MARKET, 2015–2020
FIGURE 31 BIOFUNGICIDES MARKET SIZE, BY TYPE, 2020 VS. 2025 (USD MILLION)
FIGURE 32 MARKET SIZE, BY MICROBIAL SPECIES, 2020 VS. 2025 (USD MILLION)
FIGURE 33 MARKET SIZE, BY MODE OF APPLICATION, 2020 VS. 2025 (USD MILLION)
FIGURE 34 MARKET SIZE, BY CROP TYPE, 2020 VS. 2025 (USD MILLION)
FIGURE 35 BIOFUNGICIDES MARKET SIZE, BY FORMULATION, 2020 VS. 2025 (USD MILLION)
FIGURE 36 WETTABLE POWDER: COMPOSITION
FIGURE 37 BRAZIL IS PROJECTED TO BE THE FASTEST-GROWING MARKET FOR BIOFUNGICIDES DURING THE FORECAST PERIOD
FIGURE 38 NORTH AMERICA: MARKET SNAPSHOT, 2019
FIGURE 39 ORGANIC FOOD PRODUCTION IN FRANCE, 2017
FIGURE 40 ASIA PACIFIC: MARKET SNAPSHOT, 2019
FIGURE 41 BIOFUNGICIDES MARKET COMPETITIVE LEADERSHIP MAPPING, 2019
FIGURE 42 KEY DEVELOPMENTS OF LEADING PLAYERS IN THE BIOFUNGICIDES MARKET, 2018-2020
FIGURE 43 BASF SE LED THE BIOFUNGICIDES MARKET, 2019
FIGURE 44 MARKET EVALUATION FRAMEWORK
FIGURE 45 BASF SE: COMPANY SNAPSHOT
FIGURE 46 BAYER AG: COMPANY SNAPSHOT
FIGURE 47 SYNGENTA AG: COMPANY SNAPSHOT
FIGURE 48 NUFARM: COMPANY SNAPSHOT
FIGURE 49 FMC CORPORATION: COMPANY SNAPSHOT
FIGURE 50 NOVOZYMES: COMPANY SNAPSHOT
FIGURE 51 MARRONE BIO INNOVATIONS: COMPANY SNAPSHOT
FIGURE 52 ISAGRO S.P.A: COMPANY SNAPSHOT
The study involves four major activities to estimate the current biofungicides market size. Exhaustive secondary research was conducted to collect information on the market, peer market, and parent market. These findings, assumptions, and market size were validated with the industry experts across the value chain through primary research. Both the top-down and bottom-up approaches were employed to estimate the total market size. After that, the market breakdown and data triangulation methods were used to estimate the market size of segments and subsegments.
Secondary Research
In the secondary research process, various secondary sources have been referred to, so as to identify and collect information for this study. The secondary sources included annual reports, press releases and investor presentations of companies, white papers, certified publications, articles from recognized authors, gold standard and silver standard websites, regulatory bodies, trade directories, and databases.
Secondary research has mainly been used to obtain key information about the industry’s supply chain, the market’s monetary chain, the total pool of key players, market classification and segmentation according to industry trends to the bottom-most level, and geographical markets. It has also been used to obtain information on key developments from a market-oriented perspective.
Primary Research
The market comprises several stakeholders in the supply chain, which include suppliers, manufacturers, and end-use product manufacturers. Various primary sources from both supply and demand sides of both markets have been interviewed to obtain qualitative and quantitative information. The primary interviewees from the demand-side include key opinion leaders, executives, vice presidents, and CEOs of companies manufacturing automation systems. The primary sources from the supply-side include research institutions involved in R&D activities, key opinion leaders, and manufacturing companies.
To know about the assumptions considered for the study, download the pdf brochure
Market Size Estimation
Both top-down and bottom-up approaches have been used to estimate and validate the total size of the market. These approaches have also been used extensively to estimate the size of various dependent submarkets. The research methodology used to estimate the market size includes the following:
- The key players have been identified through extensive secondary research.
- All percentage shares, splits, and breakdowns have been determined using secondary sources and verified through primary sources.
- All the possible parameters that affect the markets covered in this research study have been accounted for, viewed in extensive detail, verified through primary research, and analyzed to obtain the final quantitative and qualitative data.
- Research included the study of the reports, reviews, and newsletters of top market players, along with extensive interviews for opinions from leaders such as CEOs, directors, and marketing executives.
Data Triangulation
After arriving at the overall market size from the estimation process explained above, the total market was split into several segments and subsegments. In order to complete the overall biofungicides market estimation and arrive at the exact statistics for all segments and subsegments, the data triangulation and market breakdown procedures have been employed wherever applicable. The data has been triangulated by studying various factors and trends from both the demand and supply sides. Along with this, the market has been validated using both top-down and bottom-up approaches.
Report Objectives
- To define, segment, and project the global market size for biofungicides
- To understand the structure of the biofungicides market by identifying its various subsegments
- To provide detailed information about the key factors influencing the growth of the market (drivers, restraints, opportunities, and industry-specific challenges)
- To analyze the micro-markets, concerning individual growth trends, prospects, and their contribution to the total biofungicides market
- To project the size of the market and its submarkets, in terms of value, for various regions (along with their respective key countries)
- To profile the key players and comprehensively analyze their core competencies
- To understand the competitive landscape and identify the major growth strategies adopted by the players across key regions
- To analyze the competitive developments, such as expansions & investments, mergers & acquisitions, new product launches, partnerships, joint ventures, and agreements.
Available Customizations
Based on the given market data, MarketsandMarkets offers customizations in the reports as per client-specific requirements. The available customization options are as follows:
Product analysis:
- Product Matrix, which gives a detailed comparison of the product portfolio of each company
Geographic analysis
- Further breakdown of the Rest of Europe market for biofungicides into Belgium, Netherlands, Poland, Portugal, and Ukraine.
- Further breakdown of the Rest of Asia Pacific market for biofungicides into Malaysia, South Korea, Thailand, and Vietnam.
- Further breakdown of the Rest of South America market for biofungicides into Chile, Columbia, Paraguay, Peru.
Company Information
- Detailed analysis and profiling of additional market players (up to five)


Growth opportunities and latent adjacency in Biofungicides Market
What are advanced soil treatment techniques are used using biofungicides?
What microbials are added in this report?
Does this report provide market for key active ingredients used as biofungicides for European region countries such as France, Spain and Italy
Does this report provide information for patents applied by companies across the region ?
I would like to see some update on bacillus amyloliquifaciens.
Does this report cover biofungicides market for ornamental crops?